Cohort-based Semantic Labeling: AI-Enabled Recovery of Visualization Semantics from Deployed SVGs
Pith reviewed 2026-06-27 14:51 UTC · model grok-4.3
The pith
CSL recovers mark type, visualization role, and data role from deployed SVGs at 82-86% accuracy using cohort decomposition.
A machine-rendered reading of the paper's core claim, the machinery that carries it, and where it could break.
Core claim
CSL organizes heterogeneous SVG primitives into cohorts to shrink the semantic assignment space, then uses hybrid semantic grounding that combines model inference with deterministic validation and propagation; this produces annotations for mark type, visualization role, and data role, reaching global macro-averaged accuracies of 0.822, 0.853, and 0.860 respectively on 102 SVGs, with cohorting yielding statistically significant improvements.
What carries the argument
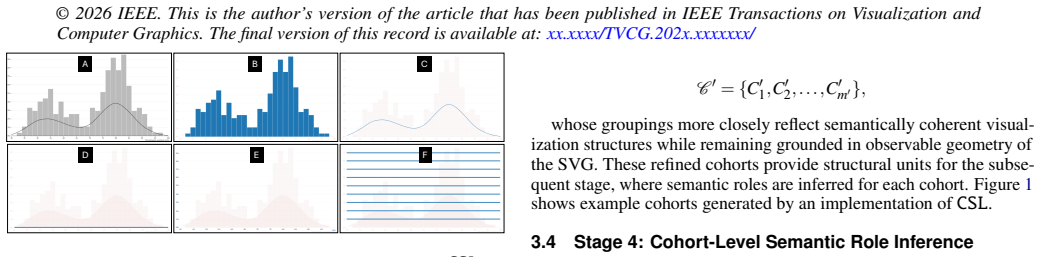
Cohort-based decomposition, which partitions SVG primitives into structurally coherent subsets that reduce the space for subsequent hybrid semantic grounding and deterministic validation.
If this is right
- Deployed SVGs become machine-usable inputs for querying, accessibility augmentation, and personalization without original source files.
- Visualization systems can apply transformations or explanations directly to published graphics.
- Repeated runs on the same SVG achieve over 91% agreement, supporting use in production pipelines.
- The method works on heterogeneous real-world SVGs rather than only synthetic or controlled examples.
Where Pith is reading between the lines
- The same cohorting step could be adapted to recover semantics from other vector formats such as PDF or Canvas exports.
- Integration with interactive tools might let users correct a few labels and propagate fixes across an entire cohort.
- Accuracy on marks and roles may enable automatic generation of data tables or alt-text for screen readers from legacy charts.
Load-bearing premise
Real deployed SVGs contain primitives that can be partitioned into cohorts whose internal structure meaningfully narrows down possible semantic labels.
What would settle it
A collection of SVGs in which automatic cohorting produces groups whose elements do not share consistent mark or role properties, resulting in labeling accuracy no higher than the non-cohort baseline.
Figures
read the original abstract
Many web-based visualizations are deployed as Scalable Vector Graphics (SVG), a format that faithfully preserves visual appearance but typically omits the higher-level semantic structure needed for machine interpretation. Once rendered and published, information about a visualization's components, roles, and encodings is no longer explicitly available, limiting downstream operations such as querying, accessibility augmentation, explanation, personalization, and transformation. To address this gap, we introduce CSL, an AI-enabled, multi-stage pipeline for automatically recovering visualization semantics from deployed SVGs through two complementary mechanisms: (1) cohort-based decomposition, which organizes heterogeneous SVG primitives into structurally coherent subsets that reduce the semantic assignment space, and (2) hybrid semantic grounding, which combines model-based inference with deterministic structural validation and propagation to make labeling both context-sensitive and structurally anchored. CSL produces Semantic SVG (SSVG), a representation in which SVG elements are annotated with graphical mark type, visualization role, and data role. We implemented CSL as an end-to-end prototype and evaluated it on 102 SVG visualizations, achieving global macro-averaged accuracies of 0.822 for mark type, 0.853 for visualization role, and 0.860 for data-role recovery. An ablation against a non-cohort whole-chart baseline showed that cohorting significantly improves accuracy (paired t-test: t > 20, p < 0.001; Cohen's d > 2.0), and repeated labeling of a randomly selected SVG over 100 runs yielded mean agreement above 91.9% across all three attributes. These results provide strong evidence that CSL can transform deployed SVGs into machine-usable semantic representations, enabling more accessible, adaptive, and user-steerable visualization systems.
Editorial analysis
A structured set of objections, weighed in public.
Referee Report
Summary. The paper introduces CSL, a multi-stage pipeline for recovering visualization semantics from deployed SVGs via cohort-based decomposition (partitioning primitives into structurally coherent subsets to reduce the semantic assignment space) and hybrid semantic grounding (model-based inference combined with deterministic structural validation). It produces Semantic SVG (SSVG) annotations for mark type, visualization role, and data role. Evaluation on 102 SVGs reports global macro-averaged accuracies of 0.822, 0.853, and 0.860 respectively; an ablation shows cohorting yields statistically significant gains (paired t-test t > 20, p < 0.001, Cohen's d > 2.0) over a non-cohort baseline, with stability >91.9% mean agreement over 100 runs on a sample SVG.
Significance. If the results hold, the work has clear significance for HCI and visualization by enabling semantic recovery from existing deployed SVGs, supporting downstream tasks like accessibility, querying, and adaptation. The empirical components are strengthened by the inclusion of a paired statistical test on the ablation and a repeated-run stability check. Credit is due for the explicit non-cohort baseline and the falsifiable accuracy claims on a held-out set.
major comments (2)
- [Abstract / Evaluation] Abstract / Evaluation: The central claim that cohort-based decomposition reduces the semantic assignment space is supported only indirectly via end-to-end accuracy gains; no separate metric is reported for space reduction factor, intra-cohort primitive similarity, or inter-cohort separation. This leaves open the possibility that gains arise primarily from the hybrid grounding stage rather than the claimed mechanism.
- [Methods / Dataset description] Methods / Dataset description: The evaluation reports results on 102 SVGs but provides no details on their sources, selection criteria, diversity of chart types, or how cohort partitioning was implemented and validated for structural coherence. These omissions are load-bearing for reproducing the accuracies and confirming the weakest assumption that heterogeneous SVG primitives can be reliably partitioned.
minor comments (1)
- [Abstract] The abstract introduces 'Semantic SVG (SSVG)' without specifying its exact annotation schema or output format, which would aid clarity for readers.
Simulated Author's Rebuttal
We thank the referee for their positive assessment of the work's significance and for the constructive comments. We address each major comment below.
read point-by-point responses
-
Referee: [Abstract / Evaluation] Abstract / Evaluation: The central claim that cohort-based decomposition reduces the semantic assignment space is supported only indirectly via end-to-end accuracy gains; no separate metric is reported for space reduction factor, intra-cohort primitive similarity, or inter-cohort separation. This leaves open the possibility that gains arise primarily from the hybrid grounding stage rather than the claimed mechanism.
Authors: We thank the referee for this observation. The ablation isolates the effect of cohort decomposition by comparing against a non-cohort whole-chart baseline while holding the hybrid grounding stage fixed; the large, statistically significant accuracy gains (paired t-test t > 20, p < 0.001, Cohen's d > 2.0) therefore attribute the improvement to cohorting rather than grounding alone. That said, we agree that explicit metrics would strengthen the mechanistic claim. In the revised manuscript we will report the average reduction in assignment space per cohort together with intra-cohort similarity and inter-cohort separation statistics computed on the 102-SVG corpus. revision: yes
-
Referee: [Methods / Dataset description] Methods / Dataset description: The evaluation reports results on 102 SVGs but provides no details on their sources, selection criteria, diversity of chart types, or how cohort partitioning was implemented and validated for structural coherence. These omissions are load-bearing for reproducing the accuracies and confirming the weakest assumption that heterogeneous SVG primitives can be reliably partitioned.
Authors: We agree that these details are necessary for reproducibility. The revised Methods section will specify the sources of the 102 SVGs, the selection criteria applied, the distribution of chart types represented, the precise algorithm used for cohort partitioning, and the validation procedures (including any quantitative or manual checks) employed to confirm structural coherence of the resulting cohorts. revision: yes
Circularity Check
No significant circularity; evaluation is independent of fitted inputs.
full rationale
The paper presents an empirical pipeline (CSL) evaluated on 102 held-out SVGs with an explicit non-cohort baseline ablation and repeated-run stability check. Reported accuracies (0.822/0.853/0.860) and statistical gains (t>20, p<0.001) are measured outcomes, not quantities that reduce by construction to parameters fitted on the same test data. No equations, self-definitional loops, or load-bearing self-citations appear in the provided text; the central claim rests on external validation rather than renaming or re-deriving its own inputs.
Axiom & Free-Parameter Ledger
axioms (1)
- domain assumption Deployed SVGs from visualization libraries contain structurally coherent subsets that can be identified without prior knowledge of the original data or encoding.
invented entities (1)
-
Semantic SVG (SSVG)
no independent evidence
Reference graph
Works this paper leans on
-
[1]
M. Z. I. Alam, S. Islam, and E. Hoque. Seechart: Enabling accessible vi- sualizations through interactive natural language interface for people with visual impairments. InProceedings of the 28th International Conference on Intelligent User Interfaces, pp. 46–64, 2023. 1
2023
-
[2]
Andrews and C
K. Andrews and C. A. Kopel. Accessible svg charts with achart. In2024 1st Workshop on Accessible Data Visualization (AccessViz), pp. 5–8. IEEE,
-
[3]
Battle, P
L. Battle, P. Duan, Z. Miranda, D. Mukusheva, R. Chang, and M. Stone- braker. Beagle: Automated extraction and interpretation of visualizations from the web. InProceedings of the 2018 CHI conference on human factors in computing systems, pp. 1–8, 2018. 1, 2, 4
2018
-
[4]
Bellamy-Royds, J
A. Bellamy-Royds, J. Diggs, and M. Cooper. Wai-aria graphics module 1.0. W3C Recommendation 02 October 2018, World Wide Web Consortium (W3C), 2018. 3
2018
-
[5]
Bostock, V
M. Bostock, V . Ogievetsky, and J. Heer. D3 data-driven documents.IEEE transactions on visualization and computer graphics, 17(12):2301–2309,
-
[6]
C. Chen, H. K. Bako, P. Yu, J. Hooker, J. Joyal, S. C. Wang et al. Visanatomy: An svg chart corpus with fine-grained semantic labels.IEEE Transactions on Visualization and Computer Graphics, 2025. 2, 3, 6, 7, 9
2025
-
[7]
C. Chen, B. Lee, Y . Wang, Y . Chang, and Z. Liu. Mystique: Deconstructing svg charts for layout reuse.IEEE Transactions on Visualization and Computer Graphics, 30(1):447–457, 2023. 2, 3, 4
2023
-
[8]
Chen and Z
C. Chen and Z. Liu. The state of the art in creating visualization corpora for automated chart analysis. InComputer Graphics Forum, vol. 42, pp. 449–470. Wiley Online Library, 2023. 2, 9
2023
-
[9]
M. Chen, I. Pedraza Pineros, A. Satyanarayan, and J. Zong. Tactile vega- lite: Rapidly prototyping tactile charts with smart defaults. InProceedings of the 2025 CHI Conference on Human Factors in Computing Systems, pp. 1–23, 2025. 3
2025
-
[10]
Q. Chen, F. Sun, X. Xu, Z. Chen, J. Wang, and N. Cao. Vizlinter: A linter and fixer framework for data visualization.IEEE transactions on visualization and computer graphics, 28(1):206–216, 2021. 2, 3
2021
-
[11]
S. Chen, X. Dong, H. Xu, X. Wu, F. Tang, H. Zhang et al. Svgenius: Benchmarking llms in svg understanding, editing and generation. In Proceedings of the 33rd ACM International Conference on Multimedia, pp. 13289–13296, 2025. 1, 9
2025
-
[12]
Cooper, J
M. Cooper, J. Diggs, and A. Bellamy-Royds. Graphics accessibility api mappings 1.0. W3C Recommendation 02 October 2018, World Wide Web Consortium (W3C), 2018. 3
2018
-
[13]
W. Cui, J. Wang, H. Huang, Y . Wang, C.-Y . Lin, H. Zhang et al. A mixed- initiative approach to reusing infographic charts.IEEE Transactions on Visualization and Computer Graphics, 28(1):173–183, 2021. 2
2021
-
[14]
D. Deng, Y . Wu, X. Shu, J. Wu, S. Fu, W. Cui et al. Visimages: A fine-grained expert-annotated visualization dataset.IEEE Transactions on Visualization and Computer Graphics, 29(7):3298–3311, 2022. 2
2022
-
[15]
S. Dou, X. Jiang, L. Liu, L. Ying, C. Shan, Y . Shen et al. Hierarchi- cally recognizing vector graphics and a new chart-based vector graphics dataset.IEEE Transactions on Pattern Analysis and Machine Intelligence, 46(12):7556–7573, 2024. 2
2024
-
[16]
Duarte, R
D. Duarte, R. Costa, P. Bizarro, and C. Duarte. Autovizua11y: A tool to automate screen reader accessibility in charts. InComputer Graphics Forum, vol. 43, p. e15099. Wiley Online Library, 2024. 3
2024
-
[17]
Elavsky, L
F. Elavsky, L. Nadolskis, and D. Moritz. Data navigator: an accessibility- centered data navigation toolkit.IEEE transactions on visualization and computer graphics, 30(1):803–813, 2023. 9
2023
-
[18]
D. Fan, A. Fay Siu, H. Rao, G. S.-H. Kim, X. Vazquez, L. Greco et al. The accessibility of data visualizations on the web for screen reader users: Practices and experiences during covid-19.ACM Transactions on Accessible Computing, 16(1):1–29, 2023. 1, 9
2023
-
[19]
J. Fu, B. Zhu, W. Cui, S. Ge, Y . Wang, H. Zhang et al. Chartem: Reviving chart images with data embedding.IEEE Transactions on Visualization and Computer Graphics, 27(2):337–346, 2020. 2
2020
-
[20]
Harper and M
J. Harper and M. Agrawala. Deconstructing and restyling d3 visualizations. InProceedings of the 27th annual ACM symposium on User interface software and technology, pp. 253–262, 2014. 2, 4, 9
2014
-
[21]
Harper and M
J. Harper and M. Agrawala. Converting basic d3 charts into reusable style templates.IEEE transactions on visualization and computer graphics, 24(3):1274–1286, 2017. 2
2017
-
[22]
Y . Holtz. D3 graph gallery. https://d3-graph-gallery.com , 2024. Accessed: 2026-03-29. 1, 6, 9
2024
-
[23]
Hoque and M
E. Hoque and M. Agrawala. Searching the visual style and structure of d3 visualizations.IEEE transactions on visualization and computer graphics, 26(1):1236–1245, 2019. 1, 2, 4
2019
-
[24]
customization is key
S. Jones, I. Pedraza Pineros, D. Hajas, J. Zong, and A. Satyanarayan. “customization is key”: Reconfigurable textual tokens for accessible data visualizations. InProceedings of the 2024 CHI Conference on Human Factors in Computing Systems, pp. 1–14, 2024. 1
2024
-
[25]
D. Jung, W. Kim, H. Song, J.-i. Hwang, B. Lee, B. Kim et al. Chartsense: Interactive data extraction from chart images. InProceedings of the 2017 chi conference on human factors in computing systems, pp. 6706–6717,
2017
-
[26]
U. I. D. Lab. Vega visualization examples. https://vega.github.io/ vega/examples/, 2026. Accessed: 2026-03-29. 6, 9
2026
- [27]
-
[28]
H. Li, Y . Wang, A. Wu, H. Wei, and H. Qu. Structure-aware visualization retrieval. InProceedings of the 2022 CHI Conference on Human Factors in Computing Systems, pp. 1–14, 2022. 1
2022
-
[29]
M. Lin, H. Patel, M. Lamkin, H. Bako, and L. Battle. How do observable users decompose d3 code? a qualitative study. In2025 IEEE Visualization and Visual Analytics (VIS), pp. 221–225. IEEE, 2025. 1
2025
-
[30]
C. Liu, Y . Zhang, C. Wu, C. Li, and X. Yuan. A spatial constraint model for manipulating static visualizations.ACM Transactions on Interactive Intelligent Systems, 14(2):1–29, 2024. 1
2024
-
[31]
F. Liu, J. Eisenschlos, F. Piccinno, S. Krichene, C. Pang, K. Lee et al. Deplot: One-shot visual language reasoning by plot-to-table translation. InFindings of the Association for Computational Linguistics: ACL 2023, pp. 10381–10399, 2023. 1
2023
-
[32]
Z. Liu, C. Chen, and J. Hooker. Manipulable semantic components: a computational representation of data visualization scenes.IEEE Transac- tions on Visualization and Computer Graphics, 31(1):732–742, 2024. 2, 3, 9
2024
-
[33]
Masry, X
A. Masry, X. L. Do, J. Q. Tan, S. Joty, and E. Hoque. Chartqa: A benchmark for question answering about charts with visual and logical reasoning. InFindings of the association for computational linguistics: ACL 2022, pp. 2263–2279, 2022. 2
2022
-
[34]
Masson, S
D. Masson, S. Malacria, D. V ogel, E. Lank, and G. Casiez. Chartdetec- tive: Easy and accurate interactive data extraction from complex vector charts. InProceedings of the 2023 CHI Conference on Human Factors in Computing Systems, pp. 1–17, 2023. 2, 3, 4
2023
-
[35]
Methani, P
N. Methani, P. Ganguly, M. M. Khapra, and P. Kumar. Plotqa: Reasoning over scientific plots. InProceedings of the ieee/cvf winter conference on applications of computer vision, pp. 1527–1536, 2020. 2
2020
-
[36]
Moritz, C
D. Moritz, C. Wang, G. L. Nelson, H. Lin, A. M. Smith, B. Howe et al. Formalizing visualization design knowledge as constraints: Actionable and extensible models in draco.IEEE transactions on visualization and computer graphics, 25(1):438–448, 2018. 2, 3 10 © 2026 IEEE. This is the author’s version of the article that has been published in IEEE Transactio...
2018
-
[37]
Moured, S
O. Moured, S. Alzalabny, A. Osman, T. Schwarz, K. Müller, and R. Stiefel- hagen. Chartformer: A large vision language model for converting chart images into tactile accessible svgs. InInternational Conference on Com- puters Helping People with Special Needs, pp. 299–305. Springer, 2024. 3
2024
-
[38]
Narechania, A
A. Narechania, A. Srinivasan, and J. Stasko. Nl4dv: A toolkit for gener- ating analytic specifications for data visualization from natural language queries.IEEE Transactions on Visualization and Computer Graphics, 27(2):369–379, 2020. 1
2020
-
[39]
D3 observable notebooks
Observable. D3 observable notebooks. https://observablehq.com/ @d3, 2026. Accessed: 2026-03-29. 1
2026
-
[40]
Poco and J
J. Poco and J. Heer. Reverse-engineering visualizations: Recovering visual encodings from chart images. InComputer graphics forum, vol. 36, pp. 353–363. Wiley Online Library, 2017. 2, 3
2017
-
[41]
Satyanarayan, B
A. Satyanarayan, B. Lee, D. Ren, J. Heer, J. Stasko, J. Thompson et al. Critical reflections on visualization authoring systems.IEEE transactions on visualization and computer graphics, 26(1):461–471, 2019. 2
2019
-
[42]
Satyanarayan, D
A. Satyanarayan, D. Moritz, K. Wongsuphasawat, and J. Heer. Vega-lite: A grammar of interactive graphics.IEEE transactions on visualization and computer graphics, 23(1):341–350, 2016. 1, 2, 3, 9
2016
-
[43]
Satyanarayan, R
A. Satyanarayan, R. Russell, J. Hoffswell, and J. Heer. Reactive vega: A streaming dataflow architecture for declarative interactive visualization. IEEE transactions on visualization and computer graphics, 22(1):659–668,
-
[44]
Savva, N
M. Savva, N. Kong, A. Chhajta, L. Fei-Fei, M. Agrawala, and J. Heer. Revision: Automated classification, analysis and redesign of chart images. InProceedings of the 24th annual ACM symposium on User interface software and technology, pp. 393–402, 2011. 2, 3
2011
-
[45]
J. Seo, S. S. Kamath, A. Zeidieh, S. Venkatesh, and S. McCurry. Maidr meets ai: Exploring multimodal llm-based data visualization interpretation by and with blind and low-vision users. InProceedings of the 26th Inter- national ACM SIGACCESS Conference on Computers and Accessibility, pp. 1–31, 2024. 9
2024
-
[46]
Sharif, S
A. Sharif, S. S. Chintalapati, J. O. Wobbrock, and K. Reinecke. Under- standing screen-reader users’ experiences with online data visualizations. InProceedings of the 23rd International ACM SIGACCESS Conference on Computers and Accessibility, pp. 1–16, 2021. 1, 9
2021
-
[47]
Shelly and M
C. Shelly and M. Rogers. Svg accessibility api mappings. W3C Working Draft 20 March 2026, World Wide Web Consortium (W3C), 2026. 3
2026
-
[48]
S. Shin, I. Na, and N. Elmqvist. Drillboards: Adaptive visualization dashboards for dynamic personalization of visualization experiences.IEEE Transactions on Visualization and Computer Graphics, 2025. 9
2025
-
[49]
L. S. Snyder and J. Heer. Divi: Dynamically interactive visualization. IEEE Transactions on Visualization and Computer Graphics, 30(1):403– 413, 2023. 2, 4, 8, 9
2023
-
[50]
L. S. Snyder, C. Wang, and S. M. Drucker. Challenges & opportunities with llm-assisted visualization retargeting.2025 IEEE Visualization and Visual Analytics (VIS), pp. 141–145, 2025. 1, 9
2025
-
[51]
Srinivasan, T
A. Srinivasan, T. Harshbarger, D. Hilliker, and J. Mankoff. Azimuth: Designing accessible dashboards for screen reader users. InProceedings of the 25th International ACM SIGACCESS Conference on Computers and Accessibility, pp. 1–16, 2023. 9
2023
-
[52]
J. R. Thompson, J. J. Martinez, A. Sarikaya, E. Cutrell, and B. Lee. Chart reader: Accessible visualization experiences designed with screen reader users. InProceedings of the 2023 CHI Conference on Human Factors in Computing Systems, pp. 1–18, 2023. 1, 8
2023
-
[53]
Vaithilingam, E
P. Vaithilingam, E. L. Glassman, J. P. Inala, and C. Wang. Dynavis: Dy- namically synthesized ui widgets for visualization editing. InProceedings of the 2024 CHI Conference on Human Factors in Computing Systems, pp. 1–17, 2024. 1
2024
-
[54]
H. Wang, J. Yin, Q. Wei, W. Zeng, L. Gu, S. Ye et al. Internsvg: Towards unified svg tasks with multimodal large language models.arXiv preprint arXiv:2510.11341, 2025. 1
arXiv 2025
-
[55]
Z. Wang, J. Hsu, X. Wang, K.-H. Huang, M. Li, J. Wu et al. Text-based reasoning about vector graphics.arXiv preprint arXiv:2404.06479, 6,
-
[56]
H. Wickham. A layered grammar of graphics.Journal of computational and graphical statistics, 19(1):3–28, 2010. 2
2010
-
[57]
Wilkinson
L. Wilkinson. ggplot2: elegant graphics for data analysis by wickham, h.,
-
[58]
Wilkinson
L. Wilkinson. The grammar of graphics. InHandbook of computational statistics: Concepts and methods, pp. 375–414. Springer, 2011. 2, 3, 9
2011
-
[59]
B. Wimer. Bridging chart extraction and accessibility in data visualization. In2025 IEEE Workshop on Accessible Data Visualization (AccessViz), pp. 25–29. IEEE, 2025. 9
2025
-
[60]
A. Wu, Y . Wang, X. Shu, D. Moritz, W. Cui, H. Zhang et al. Ai4vis: Survey on artificial intelligence approaches for data visualization.IEEE Transactions on Visualization and Computer Graphics, 28(12):5049–5070,
-
[61]
L. Xie, Y . Lin, C. Liu, H. Qu, and X. Shu. Datawink: Reusing and adapting svg-based visualization examples with large multimodal models.IEEE Transactions on Visualization and Computer Graphics, 2025. 2, 4, 9
2025
-
[62]
L. Ying, Y . Wang, H. Li, S. Dou, H. Zhang, X. Jiang et al. Reviving static charts into live charts.IEEE Transactions on Visualization and Computer Graphics, 2024. 2, 3, 4
2024
-
[63]
L. Ying, A. Wu, H. Li, Z. Deng, J. Lan, J. Wu et al. Vaid: Indexing view designs in visual analytics system. InProceedings of the 2024 CHI Conference on Human Factors in Computing Systems, pp. 1–15, 2024. 3
2024
-
[64]
Zhang, J
Z. Zhang, J. R. Thompson, A. Shah, M. Agrawal, A. Sarikaya, J. O. Wobbrock et al. Charta11y: Designing accessible touch experiences of visualizations with blind smartphone users. InProceedings of the 26th In- ternational ACM SIGACCESS Conference on Computers and Accessibility, pp. 1–15, 2024. 8
2024
-
[65]
Zhu-Tian, Y
C. Zhu-Tian, Y . Wang, Q. Wang, Y . Wang, and H. Qu. Towards automated infographic design: Deep learning-based auto-extraction of extensible timeline.IEEE transactions on visualization and computer graphics, 26(1):917–926, 2019. 2
2019
-
[66]
J. Zong, C. Lee, A. Lundgard, J. Jang, D. Hajas, and A. Satyanarayan. Rich screen reader experiences for accessible data visualization. InComputer Graphics Forum, vol. 41, pp. 15–27. Wiley Online Library, 2022. 1, 8
2022
-
[67]
J. Zong, I. P. Pineros, M. K. Chen, D. Hajas, and A. Satyanarayan. Seman- tic scaffolding: Augmenting textual structures with domain-specific group- ings for accessible data exploration.arXiv preprint arXiv:2506.15883,
discussion (0)
Sign in with ORCID, Apple, or X to comment. Anyone can read and Pith papers without signing in.