REVIEW 5 major objections 5 minor 40 references
Differential Reddening and Extinction Law Analyses of Galactic Open Clusters
T0 review · 5 major / 5 minor · reviewed 2026-08-14 · deepseek-v4-flash
Pith's one-line read This paper argues that per-star reddening corrections narrow the color–magnitude diagrams of 85% of open clusters and that the cluster color-excess ratio, while matching the standard R_V=3.1 extinction law on average, varies…
desk verdict A large, well-tested open-cluster reddening catalog with an interesting but not yet validated CER longitude trend. read the letter →
The pith
A machine-rendered reading of the paper's core claim, the machinery that carries it, and where it could break.
The reading
What carries the argument
The load-bearing object is the per-star color excess, $E = (\mathrm{observed\ color}) - (\mathrm{intrinsic\ color})$, where the intrinsic color is predicted by a blue-edge-trained XGBoost model from SHBoost stellar parameters ($T_{\mathrm{eff}}$, $\log g$, $[\mathrm{M/H}]$). Two excesses are used, $E(G_{BP}-G_{RP})$ and $E(G_{BP}-K_S)$. From them the cluster CER is the zero-intercept slope of $E(G_{BP}-K_S)$ versus $E(G_{BP}-G_{RP})$, a ratio that removes the absolute dust column and isolates the relative wavelength dependence of extinction; this is what lets the paper compare cluster photometry directly with bandpass-integrated extinction-curve predictions.
What would settle it
Randomly reassign the estimated color excesses among member stars within each cluster and repeat the CMD-width measurement: if the 85% narrowing fraction is reproduced under random assignment, the narrowing is an artifact of subtracting estimated color excesses, not a differential-reddening signal. A complementary check is to compare the per-star color excesses with independent sub-arcminute dust extinction maps: if the spatial pattern of the excesses does not track the map, the excesses are dominated by model or photometric noise rather than dust.
Extended reading notes
Core claim
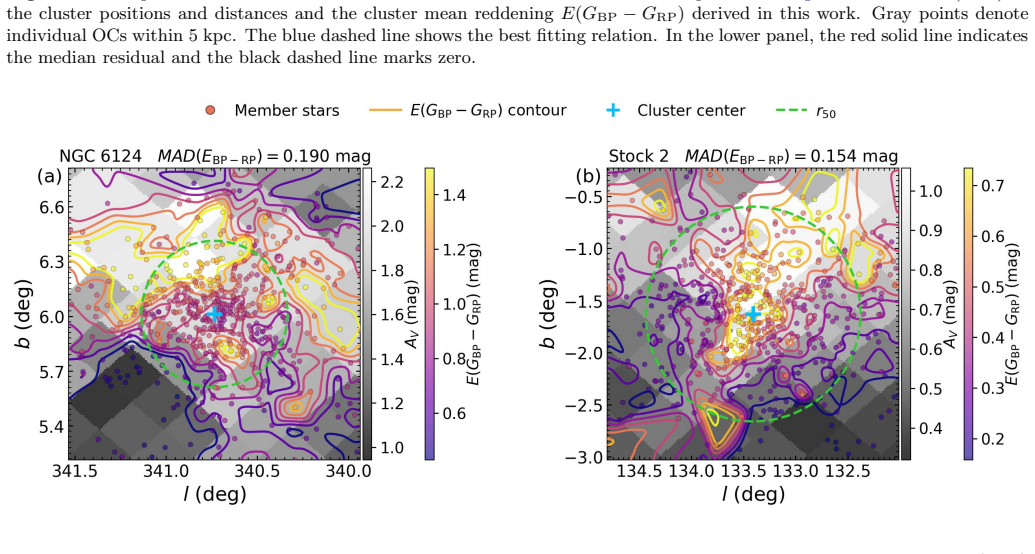
The central claim is that a homogeneous, member-based analysis of open clusters can characterize extinction at cluster scale and reveal its spatial behavior. Per-star color excesses are computed as observed minus model-predicted intrinsic colors; the cluster CER is the zero-intercept slope of $E(G_{BP}-K_S)$ versus $E(G_{BP}-G_{RP})$, and its value across 600 quality-selected near-plane clusters has a median of 2.22, exactly matching the median 2.22 obtained by integrating a standard $R_V=3.1$ extinction curve through the Gaia and 2MASS passbands (2.15–2.27 at the 16th–84th percentiles). Differential reddening, measured as the median absolute deviation of member color excesses, increases with mean reddening according to $\mathrm{MAD}(E_{BP-RP}) = 0.090\,E(G_{BP}-G_{RP}) + 0.034$ mag, and star-by-star dereddening narrows CMD sequences in 85% of the 435 clusters with reliable width measurements. The CER varies systematically with Galactic longitude—lower in the first and second quadrants, higher in the third and fourth—which the paper interprets as differences in the dust environments integrated along different sight lines, not as local extinction-law variations at the clusters.
Load-bearing premise
The central claim depends on the assumption that the star-to-star spread in the derived color excesses is real differential reddening, not scatter from photometric noise, intrinsic-color model errors, or the self-consistent correction that narrows color–magnitude diagrams by construction.
Editorial extensions
If this is right
- Star-by-star reddening maps can recover intrinsic color–magnitude diagram morphology in clusters with strong differential reddening, improving isochrone-based ages and distances for individual clusters.
- The increase of differential reddening with mean reddening implies that high-column sight lines near the Galactic plane are also the ones with the strongest small-scale extinction inhomogeneity.
- Because the median CER matches the standard $R_V=3.1$ value but cannot distinguish $R_V$ values between 2.9 and 3.2, a single average CER should not be converted into a precise local $R_V$.
- The longitude dependence of the CER means that extinction-law corrections for cluster and distance-scale work should be direction-dependent, and infrared-based measures are less affected than optical ones.
Reading between the lines
- If the longitude-dependent CER pattern reflects true dust-environment differences, independent tracers such as Cepheids or red clump stars should show correlated CER signatures along the same sight lines; this is testable with existing data.
- A natural check on the differential-reddening interpretation is to randomly permute the derived color excesses among member stars and re-measure the CMD-width narrowing fraction: if the 85% narrowing persists under random assignment, a large part of the signal comes from the self-consistent subtraction rather than from real dust variations.
- The same per-star color excess method could be extended to bands beyond Gaia and 2MASS, such as WISE or optical narrow-band surveys, to break the degeneracy between CER and $R_V$ and to map grain-size variations across the disk.
- Because the cluster CER is integrated over the full line of sight, splitting the sample into distance bins could reveal whether the quadrant contrast originates in nearby dust structures or is distributed along the Galactic disk.
Signed reviews
Editorial analysis
A structured set of objections, weighed in public.
Referee Report
Summary. The paper presents a homogeneous, member-based analysis of extinction properties for Galactic open clusters. Using Gaia DR3 and 2MASS photometry together with SHBoost stellar parameters, the authors derive per-star color excesses E(GBP-RP) and E(GBP-KS), then construct cluster-level mean reddening, differential reddening (MAD of the color excess distribution), and color excess ratios (CERs) defined as the zero-intercept slope of E(GBP-KS) versus E(GBP-RP). The catalog covers 729 clusters with at least ten members. The main results are that differential reddening increases with mean reddening, star-by-star dereddening narrows the CMD in 85% of 435 clusters with reliable CMD-width measurements, the median cluster CER is 2.22 in agreement with a standard R_V=3.1 extinction law, and the CER shows a large-scale variation with Galactic longitude, with lower values in the first and second quadrants and higher values in the third and fourth quadrants.
Significance. If the results are robust, this is a valuable contribution: it provides a uniform cluster-scale catalog of reddening, differential reddening, and CERs, with separate statistical and systematic uncertainties, and it connects cluster extinction measurements to large-scale extinction-law variations in the Galactic disk. The paper is notable for its large sample size, for cross-checking the mean reddening against several independent estimates (Wei et al. 2025; Cantat-Gaudin et al. 2020; Zhang and Green 2025), and for performing multiple robustness tests (quality-cut sensitivity, binary removal, Teff shifts, IR-excess removal). The central caveats are that the CMD-narrowing diagnostic is partly circular, and that the CER scale rests on color excesses derived from a single intrinsic-color model applied to Gaia-XP-based stellar parameters, so the claimed longitude dependence of the CER requires stronger validation before it can be regarded as a measurement of Galactic extinction-law variations.
major comments (5)
- [Section 4.3, Figure 7] The CMD-width diagnostic is not independent of the color excesses: the dereddened CMD is constructed by subtracting the very same per-star E(GBP-RP) values that were measured from those stars, so a reduction in scatter is partly guaranteed by construction even if the excesses were pure noise. The paper reports that 369 of 435 clusters (85%) show a decrease in CMD width, but it provides no null test showing that this fraction exceeds what would be obtained with random corrections of the same magnitude. Please add such a null test (for example, perturbing each star by random color excesses drawn from the measured distribution, or using a cross-validation in which the correction is estimated from an independent subset) and report the null fraction and its uncertainty. Without this, Figure 7 cannot support the claim that the measured reddening variations account for the observed CMD broadening.
- [Sections 3.1-3.3] The two color excesses E(GBP-RP) and E(GBP-KS) are both computed from the same XGBoost intrinsic-color model evaluated on the same SHBoost stellar parameters, so their errors are correlated through the shared Teff, logg, and [M/H] uncertainties and through the intrinsic-color-model residuals. The bootstrap in Section 3.3 perturbs the two color excesses independently and therefore does not capture this covariance; this can bias the reported CER uncertainty and provides no test of how model covariance propagates into k_oc. In addition, the G_BP photometric error enters both color excesses. Please propagate the joint covariance of the stellar parameters and, if possible, of the intrinsic-color predictions into the CER fit, or at minimum report how k_oc and its uncertainty change when the two color excesses are perturbed in a fully correlated manner.
- [Section 3.3 and Section 4.4, Figures 8-9] The systematic checks of the intrinsic-color scale compare SHBoost with GSP-Phot parameters and apply ±100 K Teff shifts, but both parameter sets are derived from Gaia DR3 XP spectra, so these tests share common systematics and do not validate the intrinsic-color scale against an independent source. Because CER is the ratio of two color excesses from the same model, a Teff-dependent scale error in one predicted intrinsic color relative to the other will bias k_oc by an amount that depends on the stellar-parameter distribution of each cluster. Since cluster age, distance, and hence stellar content vary with Galactic longitude, the claimed quadrant dependence of k_oc could in principle be produced by the intrinsic-color model rather than by true extinction-law variations. The median CER of 2.22 matching the bandpass-integrated R_V=3.1 value is a consistency check, not a validation, because a Teff-dependent bias could average to the correct median. Please validate the CER scale against independent reddening or stellar-parameter sources (e.g., spectroscopic Teff/logg from LAMOST or APOGEE, or independent color-excess measurements not based on Gaia XP), and test whether the longitude trend survives when the sample is matched or weighted by stellar-parameter distribution.
- [Section 4.4, Figure 9] The longitude dependence is the paper's main new physical claim, but it is currently supported only by a qualitative description and by a statement that the pattern is 'broadly consistent' with the Zhang and Green (2025) dust map. Please provide quantitative statistics: the significance of the difference between the first-second and third-fourth quadrant CER medians, the significance of the binned longitude trend, and a quantitative comparison with map-based R_V at cluster positions (e.g., a binned or per-cluster correlation). The weakening of the variation in the high-reddening subsample shown in Figure 9(b) should also be quantified, because it bears on whether part of the effect is a sample-selection effect.
- [Section 4.4, Figure 8] The observed CER distribution has a 16th-84th percentile width of about 0.23 mag, but each cluster's k_oc carries statistical and systematic uncertainties that broaden the observed distribution; the paper does not subtract them. Please report the intrinsic dispersion of the CER distribution after accounting for the measurement uncertainties. Otherwise the abstract's statement that the 'broad CER distribution' likely reflects differences in dust environments is not directly supported by Figure 8.
minor comments (5)
- [Section 3.3] Please specify the exact fitting procedure for the zero-intercept CER (e.g., whether it is an errors-in-variables likelihood and how weights are defined), since the current description does not make clear how uncertainties in both variables enter the fit.
- [Section 4.3] The 435 clusters with reliable CMD-width measurements are not defined; please state the selection criteria (e.g., minimum number of stars per magnitude bin, minimum total N) and how they differ from the 729-cluster color-excess sample.
- [Figure 1] The color scale in panel (b) is centered on the fiducial CER of 2.22; a diverging color map with explicit colorbar labels would make the spatial pattern easier to read.
- [Section 4.2] The discussion of Figure 2(b) should state explicitly why the fitted slope of 2.073 is not used in preference to the literature conversion factor 2.394, given that the paper adopts the latter for converting E(GBP-RP) to AV.
- [Figure 9] Please define the 'reddening gradient' E(GBP-KS)/d in the caption, including the adopted cluster distance source and the units.
Circularity Check
The CMD-narrowing result reduces to an in-sample projection: dereddened colors equal the predicted intrinsic colors, so the 85% narrowing is partly guaranteed by construction.
-
fitted input called prediction
[Section 3.1 (color-excess definition) and Section 4.3 (CMD-width diagnostic), with Abstract claim]
"For each OC member star, we calculated the color excesses as E(G_BP-G_RP) = (G_BP-G_RP) - (G_BP-G_RP)_0 ... Among the 435 clusters with reliable measurements, 369 (85%) show a decrease in CMD-width."
By the paper's own definition, the per-star color excess is observed color minus predicted intrinsic color. Subtracting that excess to construct the 'dereddened' CMD therefore forces the corrected color to equal the XGBoost-predicted intrinsic color for the same stars. The width of the dereddened sequence is thus the width of the model's intrinsic-color predictions, not an independent measurement of the true cluster sequence. Whenever the predicted intrinsic colors are correlated with the observed colors, removing the fitted excess must reduce the observed scatter, so a positive CMD-width reduction is a projection of the fit rather than an empirical confirmation of differential reddening.
full rationale
One main result, the claim that star-by-star reddening corrections narrow CMD sequences in 85% of clusters, is a fitted-input diagnostic: the dereddened color is obtained by removing the very per-star color excess that was fitted from the same observed color, so the corrected CMD is essentially the intrinsic-color-model prediction. The 85% narrowing and its relation to MAD(E) are therefore in-sample statistics, not independent evidence for real differential reddening. However, the paper's other central content has independent support: mean reddening is compared with external measurements (Wei et al. 2025; Cantat-Gaudin et al. 2020; Zhang & Green 2025), and the CER longitude trend is qualitatively checked against a dust-map R_V distribution. The intrinsic-color model from H. Zhao et al. (2024) was validated on independent low-reddening samples and against the Andrae catalog, so its use is not circular merely because one of the present authors co-authored it. The paper itself notes that the SHBoost and GSP-Phot parameter sets both derive from Gaia XP spectra, which is a real limitation of the systematic CER test but a correctness risk rather than an additional circular step. Score 6 reflects one prominent result that reduces by construction while the central CER/longitude claim retains independent empirical content.
Assumptions & free parameters
free parameters (7)
- Huber fit slope for MAD(E) vs E(GBP-RP) =
0.090 ± 0.021
- Huber fit intercept for MAD(E) vs E(GBP-RP) =
0.034 ± 0.011
- Membership probability threshold =
80%
- Photometric uncertainty cuts =
KS<0.05, GBP<0.03, GRP<0.02 mag
- Astrometric and magnitude cuts =
parallax fraction<20%, G<17, RUWE<1.4
- CER quality cuts =
sigma_k<0.2, SNR>10, R2>0.9
- Minimum member count =
Nused >= 10
assumptions (7)
- domain assumption The XGBoost intrinsic-color model of Zhao et al. (2024) accurately predicts intrinsic (GBP-GRP)0 and (GBP-KS)0 from SHBoost stellar parameters over Teff 4000-8000 K and logg 1-5.
- domain assumption The blue-edge method and the low-reddening training sample provide an unbiased zero point for intrinsic colors.
- domain assumption The per-star color excess scatter (MAD) is dominated by differential reddening after the quality cuts, not by residual photometric or parameter errors or binary contamination.
- domain assumption The zero-intercept constraint in the CER fit is physically valid.
- domain assumption The PHOENIX model atmospheres and the adopted Teff/logg/[M/H]/AV grid give a faithful conversion of an extinction curve into the reference CER in the Gaia and 2MASS bands.
- domain assumption The standard diffuse ISM extinction curve with R_V near 3.1 is an appropriate fiducial for comparison.
- domain assumption The UPMASK Gaia DR2 memberships from Cantat-Gaudin and Anders (2020) are sufficiently reliable after applying the 80% probability threshold.
Cite this review
Pith. "Pith review of Differential Reddening and Extinction Law Analyses of Galactic Open Clusters." pith.science (2026). https://pith.science/paper/BRM37XZG
@misc{pith2026260813313,
  author       = {Pith},
  title        = {Pith review of: Differential Reddening and Extinction Law Analyses of Galactic Open Clusters},
  year         = {2026},
  howpublished = {\url{https://pith.science/paper/BRM37XZG}},
  note         = {Machine review of arXiv:2608.13313}
}
read the original abstract
Extinction significantly affects open cluster parameters and their use in studies of Galactic structure, yet homogeneous large sample measurements of open cluster extinction properties remain limited. Using Gaia-era open cluster member samples combined with multi-band photometry and stellar parameters, we derive color excesses of member stars and provide the homogeneous characterization of the mean reddening, differential reddening, and color excess ratio (CER) at the cluster scale. Differential reddening increases systematically with mean reddening, with highly reddened clusters near the Galactic plane showing stronger extinction variations. Star-by-star reddening corrections narrow color--magnitude diagram (CMD) sequences in 369 of 435 clusters (85%) with reliable CMD-width measurements, and cluster color excess maps reveal small-scale extinction structures. The median CER is compatible with the standard diffuse interstellar medium extinction curve, while the broad CER distribution and its large-scale variations across the Galactic disk likely reflect differences in the dominant dust environments sampled along different Galactic sight lines.
Figures


Figures from the paper (6 more)


Reference graph
Works this paper leans on
-
[1]
2023, ApJS, 267, 8, doi: 10.3847/1538-4365/acd53e
Andrae, R., Rix, H.-W., & Chandra, V. 2023, ApJS, 267, 8, doi: 10.3847/1538-4365/acd53e
-
[2]
2020, A&A, 633, A99, doi: 10.1051/0004-6361/201936691
Cantat-Gaudin, T., & Anders, F. 2020, A&A, 633, A99, doi: 10.1051/0004-6361/201936691
-
[3]
2024, NewAR, 99, 101696, doi: 10.1016/j.newar.2024.101696
Cantat-Gaudin, T., & Casamiquela, L. 2024, NewAR, 99, 101696, doi: 10.1016/j.newar.2024.101696
arXiv 2024
-
[4]
2018, A&A, 618, A93, doi: 10.1051/0004-6361/201833476
Cantat-Gaudin, T., Jordi, C., Vallenari, A., et al. 2018, A&A, 618, A93, doi: 10.1051/0004-6361/201833476
-
[5]
2020, A&A, 640, A1, doi: 10.1051/0004-6361/202038192
Cantat-Gaudin, T., Anders, F., Castro-Ginard, A., et al. 2020, A&A, 640, A1, doi: 10.1051/0004-6361/202038192
-
[6]
2020, A&A, 635, A45, doi: 10.1051/0004-6361/201937386
Castro-Ginard, A., Jordi, C., Luri, X., et al. 2020, A&A, 635, A45, doi: 10.1051/0004-6361/201937386
-
[7]
2022, A&A, 661, A118, doi: 10.1051/0004-6361/202142568
Castro-Ginard, A., Jordi, C., Luri, X., et al. 2022, A&A, 661, A118, doi: 10.1051/0004-6361/202142568
-
[8]
2024, AJ, 167, 12, doi: 10.3847/1538-3881/ad07e5
Cavallo, L., Spina, L., Carraro, G., et al. 2024, AJ, 167, 12, doi: 10.3847/1538-3881/ad07e5
Show all 40 references
-
[9]
2025, ApJ, 982, 77, doi: 10.3847/1538-4357/adb431
Deng, J., Wang, S., Jiang, B., & Zhao, H. 2025, ApJ, 982, 77, doi: 10.3847/1538-4357/adb431
2025 doi
-
[10]
S., Monteiro, H., Moitinho, A., et al
Dias, W. S., Monteiro, H., Moitinho, A., et al. 2021, MNRAS, 504, 356, doi: 10.1093/mnras/stab770 Gaia Collaboration, Vallenari, A., Brown, A. G. A., et al. 2023, A&A, 674, A1, doi: 10.1051/0004-6361/202243940
2021 doi
-
[11]
J., Xu, Y., Hou, L
Hao, C. J., Xu, Y., Hou, L. G., et al. 2021, A&A, 652, A102, doi: 10.1051/0004-6361/202140608
2021 doi
-
[12]
L., & Reffert, S
Hunt, E. L., & Reffert, S. 2021, A&A, 646, A104, doi: 10.1051/0004-6361/202039341
2021 doi
-
[13]
L., & Reffert, S
Hunt, E. L., & Reffert, S. 2023, A&A, 673, A114, doi: 10.1051/0004-6361/202346285
2023 doi
-
[14]
L., & Reffert, S
Hunt, E. L., & Reffert, S. 2024, A&A, 686, A42, doi: 10.1051/0004-6361/202348662
2024 doi
-
[15]
2013, A&A, 553, A6, doi: 10.1051/0004-6361/201219058
Husser, T.-O., Wende-von Berg, S., Dreizler, S., et al. 2013, A&A, 553, A6, doi: 10.1051/0004-6361/201219058
2013 doi
-
[16]
2024, A&A, 691, A98, doi: 10.1051/0004-6361/202451427
Khalatyan, A., Anders, F., Chiappini, C., et al. 2024, A&A, 691, A98, doi: 10.1051/0004-6361/202451427
2024 doi
-
[17]
P., & Leisawitz, D
Koenig, X. P., & Leisawitz, D. T. 2014, ApJ, 791, 131, doi: 10.1088/0004-637X/791/2/131
2014 doi
-
[18]
2019, AJ, 158, 122, doi: 10.3847/1538-3881/ab339a
Kounkel, M., & Covey, K. 2019, AJ, 158, 122, doi: 10.3847/1538-3881/ab339a
2019 doi
-
[19]
2014, A&A, 561, A57, doi: 10.1051/0004-6361/201321143
Krone-Martins, A., & Moitinho, A. 2014, A&A, 561, A57, doi: 10.1051/0004-6361/201321143
2014 doi
-
[20]
2025, AJ, 170, 288, doi: 10.3847/1538-3881/ae0cb6
Li, L., Shao, Z., Li, Z., & Fu, X. 2025, AJ, 170, 288, doi: 10.3847/1538-3881/ae0cb6
2025 doi
-
[21]
2023, ApJ, 956, 26, doi: 10.3847/1538-4357/aced8a
Li, L., Wang, S., Chen, X., & Jiang, Q. 2023, ApJ, 956, 26, doi: 10.3847/1538-4357/aced8a
2023 doi
-
[22]
2018, SSRv, 214, 74, doi: 10.1007/s11214-018-0506-5
Matsunaga, N., Bono, G., Chen, X., et al. 2018, SSRv, 214, 74, doi: 10.1007/s11214-018-0506-5
2018 doi
-
[23]
S., Brown, A
Nizovkina, M., Larsen, S. S., Brown, A. G. A., & Helmi, A. 2025, A&A, 703, A100, doi: 10.1051/0004-6361/202555437
2025 doi
-
[24]
K., Upadhyay, K., Nakada, Y., & Ogura, K
Pandey, A. K., Upadhyay, K., Nakada, Y., & Ogura, K. 2003, A&A, 397, 191, doi: 10.1051/0004-6361:20021509
2003 doi
-
[25]
I., Pera, M
Perren, G. I., Pera, M. S., Navone, H. D., & V´ azquez, R. A. 2023, MNRAS, 526, 4107, doi: 10.1093/mnras/stad2826
2023 doi
-
[26]
Rangwal, G., Yadav, R. K. S., Durgapal, A. K., & Bisht, D. 2017, PASA, 34, e068, doi: 10.1017/pasa.2017.64
2017 doi
-
[27]
J., Menten, K
Reid, M. J., Menten, K. M., Brunthaler, A., et al. 2014, ApJ, 783, 130, doi: 10.1088/0004-637X/783/2/130
2014 doi
-
[28]
F., Meisner, A
Schlafly, E. F., Meisner, A. M., Stutz, A. M., et al. 2016, ApJ, 821, 78, doi: 10.3847/0004-637X/821/2/78
2016 doi
-
[29]
F., Cutri, R
Skrutskie, M. F., Cutri, R. M., Stiening, R., et al. 2006, AJ, 131, 1163, doi: 10.1086/498708
2006 doi
-
[30]
2026, ApJ, 1001, 114, doi: 10.3847/1538-4357/ae552d
Wang, H., Chen, X., & Wang, S. 2026, ApJ, 1001, 114, doi: 10.3847/1538-4357/ae552d
2026 doi
-
[31]
2019, ApJ, 877, 116, doi: 10.3847/1538-4357/ab1c61
Wang, S., & Chen, X. 2019, ApJ, 877, 116, doi: 10.3847/1538-4357/ab1c61
2019 doi
-
[32]
2023, ApJ, 946, 43, doi: 10.3847/1538-4357/acb647
Wang, S., & Chen, X. 2023, ApJ, 946, 43, doi: 10.3847/1538-4357/acb647
2023 doi
-
[33]
Wang, S., & Jiang, B. W. 2014, ApJL, 788, L12, doi: 10.1088/2041-8205/788/1/L12
2014 doi
-
[34]
2025, AJ, 169, 115, doi: 10.3847/1538-3881/ada4a0
Wei, X., Chen, J., Zhang, S., et al. 2025, AJ, 169, 115, doi: 10.3847/1538-3881/ada4a0
2025 doi
-
[35]
2018, Research in Astronomy and Astrophysics, 18, 146, doi: 10.1088/1674-4527/18/12/146
Xu, Y., Hou, L.-G., & Wu, Y.-W. 2018, Research in Astronomy and Astrophysics, 18, 146, doi: 10.1088/1674-4527/18/12/146
2018 doi
-
[36]
P., Koposov, S
Yao, Y., Ji, A. P., Koposov, S. E., & Limberg, G. 2024, MNRAS, 527, 10937, doi: 10.1093/mnras/stad3775
2024 doi
-
[37]
R., Indebetouw, R., et al
Zasowski, G., Majewski, S. R., Indebetouw, R., et al. 2009, ApJ, 707, 510, doi: 10.1088/0004-637X/707/1/510
2009 doi
-
[38]
Zhang, X., & Green, G. M. 2025, Science, 387, 1209, doi: 10.1126/science.ado9787
2025 doi
-
[39]
M., & Rix, H.-W
Zhang, X., Green, G. M., & Rix, H.-W. 2023, MNRAS, 524, 1855, doi: 10.1093/mnras/stad1941
2023 doi
-
[40]
2024, ApJ, 974, 138, doi: 10.3847/1538-4357/ad6d64
Zhao, H., Wang, S., Jiang, B., et al. 2024, ApJ, 974, 138, doi: 10.3847/1538-4357/ad6d64
2024 doi
Reviewed August 14, 2026 · model on record in the stance chip above.
Discussion (0). Continue with ORCID to comment.