Interpretable Factor Decomposition for Decision Intelligence in Large-Scale Financial Markets: Evidence from China's A-Share Market
Pith reviewed 2026-06-27 07:38 UTC · model grok-4.3
The pith
SHAP decomposition on XGBoost models shows behavioral signals account for 58.2 percent of predictive attribution in Chinese A-share returns while valuation ratios contribute 10.7 percent.
A machine-rendered reading of the paper's core claim, the machinery that carries it, and where it could break.
Core claim
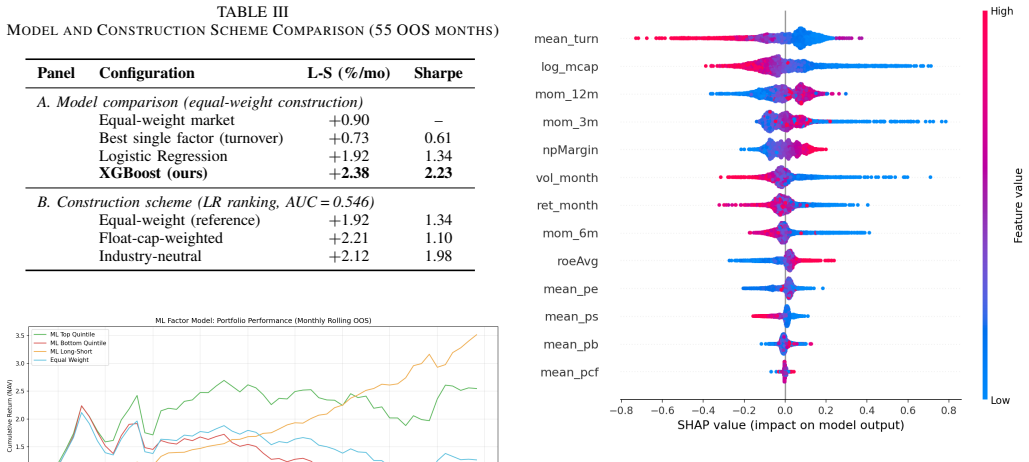
TreeSHAP attribution applied to the fitted XGBoost models indicates that behavioral signals (turnover and momentum) account for 58.2 percent of predictive attribution compared with 10.7 percent for valuation ratios, on average across the 55 industry groups; the model itself achieves a mean out-of-sample AUC of 0.547 and a Newey-West-adjusted long-short spread of +2.38 percent per month.
What carries the argument
TreeSHAP attribution applied to XGBoost classifiers trained inside 60-month rolling windows
If this is right
- The long-short spread remains positive and statistically significant after Carhart four-factor adjustment (+2.31 percent per month, t = 7.48).
- SHAP and ablation rankings agree on the relative importance of behavioral versus valuation features but diverge in ways that reveal feature substitutability.
- The dominance of behavioral signals holds on average across all 55 industry groups examined.
- The pipeline produces auditable factor contributions that can be inspected at the industry level.
Where Pith is reading between the lines
- The same pipeline could be applied to other emerging-market equity universes to test whether behavioral dominance is region-specific.
- If feature correlations evolve after 2019, periodic re-estimation of the attributions would be required to maintain stability.
- The observed substitutability structure suggests that removing one behavioral feature may allow others to compensate, an interaction visible only when both SHAP and ablation are examined together.
Load-bearing premise
The TreeSHAP values produced by the fitted XGBoost models capture stable, non-spurious contributions from each feature rather than artifacts of training-window choice, hyperparameter settings, or correlations among the features.
What would settle it
Retraining the identical pipeline on post-2019 data or with a different model class such as random forests and obtaining a reversal in which valuation ratios receive higher average SHAP values than behavioral signals.
Figures
read the original abstract
We present an interpretable machine learning pipeline to decompose Cross-Sectional Equity Return Predictability into auditable factor contribution. We apply an XGBoost model with TreeSHAP attribution and conduct stress testing on 3632 Chinese A-share stocks from 2009 until 2019. Using 60-month, rolling windows over 55 months of out-of-sample data, XGBoost obtains a mean AUC of 0.547 and +2.38%/month (Newey-West t = 5.94; Annualized Sharpe 2.23) long-short spread for the top vs bottom quintiles. This alpha is persistent after adjusting for the Carhart four-factor model (+2.31%/month; t = 7.48). SHAP Decomposition indicates that behavioral signals (turnover and momentum) account for 58.2% of predictive attribution compared to 10.7% for valuation ratios, on average, across 55 industry groups. Ablation analysis serves to cross-validate this ranking and provides evidence that SHAP and ablation diverge in a manner that highlights feature substitutability structure that is largely invisible to either method used in isolation.
Editorial analysis
A structured set of objections, weighed in public.
Referee Report
Summary. The manuscript proposes an interpretable machine learning pipeline applying XGBoost with TreeSHAP attribution to decompose cross-sectional equity return predictability. On 3632 Chinese A-share stocks from 2009-2019, using 60-month rolling windows and 55 months of out-of-sample evaluation, the model reports a mean AUC of 0.547 and a long-short top-vs-bottom quintile spread of +2.38%/month (Newey-West t=5.94, annualized Sharpe 2.23) that persists at +2.31%/month (t=7.48) after Carhart four-factor adjustment. The central result is that behavioral signals (turnover and momentum) account for 58.2% of average predictive attribution versus 10.7% for valuation ratios across 55 industry groups, with ablation analysis offered as cross-validation.
Significance. If the reported decomposition is robust, the work supplies concrete evidence on the relative contribution of behavioral versus valuation factors to return predictability in a major emerging market, alongside economically large and statistically persistent alpha. The rolling-window design, post-Carhart adjustment, and dual use of SHAP plus ablation are strengths that support empirical credibility and could inform both asset-pricing theory and practical factor construction.
major comments (2)
- [SHAP Decomposition paragraph] SHAP Decomposition paragraph: the headline attribution shares (58.2% behavioral vs. 10.7% valuation) are presented as stable averages across industry groups without reported cross-window standard deviation, range, or sensitivity to hyperparameter choices; because TreeSHAP attributions can shift with multicollinearity and window-specific fits, this omission is load-bearing for the claim that behavioral signals dominate.
- [Ablation analysis description] Ablation analysis description: the manuscript states that ablation cross-validates the SHAP ranking and reveals substitutability structure, yet provides no quantitative comparison (e.g., rank correlation, percentage of features whose importance ordering changes, or divergence metric) between the two methods, leaving the claim that the methods together highlight invisible structure unsupported in detail.
minor comments (2)
- [Methods section] Methods section: explicitly list or tabulate the precise features grouped under 'behavioral signals' and 'valuation ratios' so that the 58.2%/10.7% split can be reproduced.
- [Data section] Data section: clarify the exact construction of the 55 industry groups and any survivorship or delisting filters applied to the 3632 stocks.
Simulated Author's Rebuttal
We thank the referee for the constructive comments on robustness and quantitative validation. We address each major point below and will revise the manuscript accordingly.
read point-by-point responses
-
Referee: [SHAP Decomposition paragraph] SHAP Decomposition paragraph: the headline attribution shares (58.2% behavioral vs. 10.7% valuation) are presented as stable averages across industry groups without reported cross-window standard deviation, range, or sensitivity to hyperparameter choices; because TreeSHAP attributions can shift with multicollinearity and window-specific fits, this omission is load-bearing for the claim that behavioral signals dominate.
Authors: We agree that variability measures are needed to support stability claims. In the revision we will report the cross-window standard deviation and range of the behavioral/valuation attribution shares over the 55 out-of-sample windows. We will also add a sensitivity table showing how the headline shares change under alternative hyperparameter settings (learning rate, max depth, subsample ratio) chosen via the original cross-validation procedure. These additions directly address multicollinearity and window-specific fit concerns. revision: yes
-
Referee: [Ablation analysis description] Ablation analysis description: the manuscript states that ablation cross-validates the SHAP ranking and reveals substitutability structure, yet provides no quantitative comparison (e.g., rank correlation, percentage of features whose importance ordering changes, or divergence metric) between the two methods, leaving the claim that the methods together highlight invisible structure unsupported in detail.
Authors: We accept that explicit quantitative comparisons are required. The revised manuscript will include (i) average Spearman rank correlation between SHAP and ablation importance orderings across windows, (ii) the fraction of features whose top-10 ranking changes between the two methods, and (iii) mean absolute divergence in normalized importance scores. These metrics will be reported both overall and by industry group to substantiate the substitutability claim. revision: yes
Circularity Check
No significant circularity; standard ML interpretability applied to fitted model
full rationale
The paper trains XGBoost on 60-month rolling windows, evaluates out-of-sample performance (AUC 0.547, long-short alpha), and applies TreeSHAP to obtain feature attributions, averaging them across 55 industry groups to report shares such as 58.2% behavioral vs 10.7% valuation. This attribution is the direct, intended output of the chosen interpretability tool on the fitted model rather than a claimed first-principles derivation that reduces to its inputs by construction. Ablation analysis is presented for cross-validation, and no load-bearing steps rely on self-citations, imported uniqueness theorems, or smuggled ansatzes. The pipeline is self-contained as an empirical decomposition exercise with external performance benchmarks.
Axiom & Free-Parameter Ledger
free parameters (2)
- rolling_window_length
- quintile_thresholds
axioms (2)
- domain assumption TreeSHAP attributions on a fitted tree ensemble accurately decompose the model's predictive contribution without significant interaction or correlation bias.
- domain assumption The Carhart four-factor model fully captures systematic risk in the Chinese A-share market during 2009-2019.
Reference graph
Works this paper leans on
-
[1]
Empirical asset pricing via machine learning,
S. Gu, B. Kelly, and D. Xiu, “Empirical asset pricing via machine learning,”Rev. Financial Stud., vol. 33, no. 5, pp. 2223–2273, 2020
2020
-
[2]
A unified approach to interpreting model predictions,
S. M. Lundberg and S.-I. Lee, “A unified approach to interpreting model predictions,” inAdvances in Neural Information Processing Systems 30, Long Beach, CA, USA: Curran Associates, 2017, pp. 4765–4774
2017
-
[3]
Explainable AI for trees: From local explanations to global understanding,
S. M. Lundberget al., “Explainable AI for trees: From local explanations to global understanding,”Nature Mach. Intell., vol. 2, no. 1, pp. 56–67, 2020
2020
-
[4]
The trading behavior of institutions and individuals in Chinese equity markets,
L. Ng and F. Wu, “The trading behavior of institutions and individuals in Chinese equity markets,”J. Banking Finance, vol. 31, no. 9, pp. 2695– 2710, 2007
2007
-
[5]
Common risk factors in the returns on stocks and bonds,
E. F. Fama and K. R. French, “Common risk factors in the returns on stocks and bonds,”J. Financial Econ., vol. 33, no. 1, pp. 3–56, 1993
1993
-
[6]
and the cross-section of expected returns,
C. R. Harvey, Y . Liu, and H. Zhu, “. . . and the cross-section of expected returns,”Rev. Financial Stud., vol. 29, no. 1, pp. 5–68, 2016
2016
-
[7]
On persistence in mutual fund performance,
M. M. Carhart, “On persistence in mutual fund performance,”J. Finance, vol. 52, no. 1, pp. 57–82, 1997
1997
-
[8]
A five-factor asset pricing model,
E. F. Fama and K. R. French, “A five-factor asset pricing model,”J. Financial Econ., vol. 116, no. 1, pp. 1–22, 2015
2015
-
[9]
Returns to buying winners and selling losers: Implications for stock market efficiency,
N. Jegadeesh and S. Titman, “Returns to buying winners and selling losers: Implications for stock market efficiency,”J. Finance, vol. 48, no. 1, pp. 65–91, 1993
1993
-
[10]
Value and momentum everywhere,
C. S. Asness, T. J. Moskowitz, and L. H. Pedersen, “Value and momentum everywhere,”J. Finance, vol. 68, no. 3, pp. 929–985, 2013
2013
-
[11]
The real value of China’s stock market,
J. N. Carpenter, F. Lu, and R. F. Whitelaw, “The real value of China’s stock market,”J. Financial Econ., vol. 139, no. 3, pp. 679–696, 2021
2021
-
[12]
Size and value in China,
J. Liu, R. F. Stambaugh, and Y . Yuan, “Size and value in China,”J. Financial Econ., vol. 134, no. 1, pp. 48–69, 2019
2019
-
[13]
Does the turnover effect matter in emerging markets? Evidence from China,
T.-Y . Chen, C.-H. Chao, and Z.-X. Wu, “Does the turnover effect matter in emerging markets? Evidence from China,”Pacific-Basin Finance J., vol. 67, art. no. 101551, 2021
2021
-
[14]
Greedy function approximation: A gradient boosting machine,
J. H. Friedman, “Greedy function approximation: A gradient boosting machine,”Ann. Statist., vol. 29, no. 5, pp. 1189–1232, 2001
2001
-
[15]
Predicting corporate bond returns: Merton meets machine learning,
T. G. Bali, A. Goyal, D. Huang, F. Jiang, and Q. Wen, “Predicting corporate bond returns: Merton meets machine learning,”Rev. Financial Stud., vol. 36, no. 8, pp. 3235–3272, 2023
2023
-
[16]
Stop explaining black box machine learning models for high stakes decisions and use interpretable models instead,
C. Rudin, “Stop explaining black box machine learning models for high stakes decisions and use interpretable models instead,”Nature Mach. Intell., vol. 1, no. 5, pp. 206–215, 2019
2019
-
[17]
XGBoost: A scalable tree boosting system,
T. Chen and C. Guestrin, “XGBoost: A scalable tree boosting system,” inProc. 22nd ACM SIGKDD Int. Conf. Knowl. Discovery Data Mining, San Francisco, CA, USA: ACM, 2016, pp. 785–794
2016
-
[18]
All that glitters: The effect of attention and news on the buying behavior of individual and institutional investors,
B. M. Barber and T. Odean, “All that glitters: The effect of attention and news on the buying behavior of individual and institutional investors,” Rev. Financial Stud., vol. 21, no. 2, pp. 785–818, 2008
2008
-
[19]
Liquidity and stock returns: An alternative test,
V . T. Datar, N. Y . Naik, and R. Radcliffe, “Liquidity and stock returns: An alternative test,”J. Financial Markets, vol. 1, no. 2, pp. 203–219, 1998
1998
-
[20]
Illiquidity and stock returns: Cross-section and time-series effects,
Y . Amihud, “Illiquidity and stock returns: Cross-section and time-series effects,”J. Financial Markets, vol. 5, no. 1, pp. 31–56, 2002
2002
-
[21]
Alternative factor specifications, security characteristics, and the cross-section of expected stock returns,
M. J. Brennan, T. Chordia, and A. Subrahmanyam, “Alternative factor specifications, security characteristics, and the cross-section of expected stock returns,”J. Financial Econ., vol. 49, no. 3, pp. 345–373, 1998
1998
-
[22]
Price momentum and trading volume,
C. M. C. Lee and B. Swaminathan, “Price momentum and trading volume,”J. Finance, vol. 55, no. 5, pp. 2017–2069, 2000
2017
discussion (0)
Sign in with ORCID, Apple, or X to comment. Anyone can read and Pith papers without signing in.