NetCause: Counterfactual Learning for Root Cause Analysis in Large-Scale Networks
Pith reviewed 2026-06-27 05:11 UTC · model grok-4.3
The pith
NetCause ranks root causes in large networks by learning to simulate counterfactual fault propagations from graph-temporal incident data.
A machine-rendered reading of the paper's core claim, the machinery that carries it, and where it could break.
Core claim
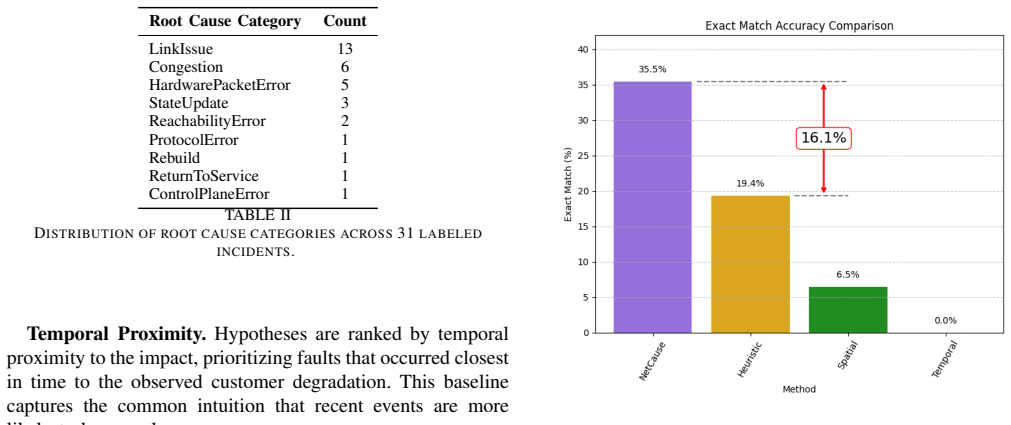
A self-supervised model that represents incidents as graph-temporal processes can learn enough about fault propagation to rank root-cause hypotheses via counterfactual simulation, yielding a 16.1 percent accuracy gain over static heuristics on expert-labeled production incidents while remaining fast enough for operational use.
What carries the argument
The self-supervised framework that models incidents as graph-temporal processes and ranks root causes by comparing observed impact against counterfactual simulations of each candidate cause.
If this is right
- Root-cause rankings become directly usable with operator-defined mitigation and remediation steps.
- Inference cost stays low enough to fit inside normal telemetry collection windows.
- The approach generalizes across dynamic environments where static rules fail to track changing dependencies.
Where Pith is reading between the lines
- The method could be tested on other large distributed systems whose faults also propagate across logical and physical layers.
- Collecting additional labeled incidents would allow direct measurement of how much the accuracy gain depends on the size or diversity of the validation set.
- If the learned simulations prove stable, they might serve as a lightweight surrogate for building explicit causal graphs in network monitoring tools.
Load-bearing premise
The 31 expert-labeled incidents are representative of the full distribution of production incidents and the counterfactual simulations correctly capture how faults actually propagate without access to ground-truth causal graphs.
What would settle it
Evaluation on a fresh collection of incidents drawn from the same or a different production network that shows the accuracy improvement over the rule-based baseline disappearing or reversing.
Figures


read the original abstract
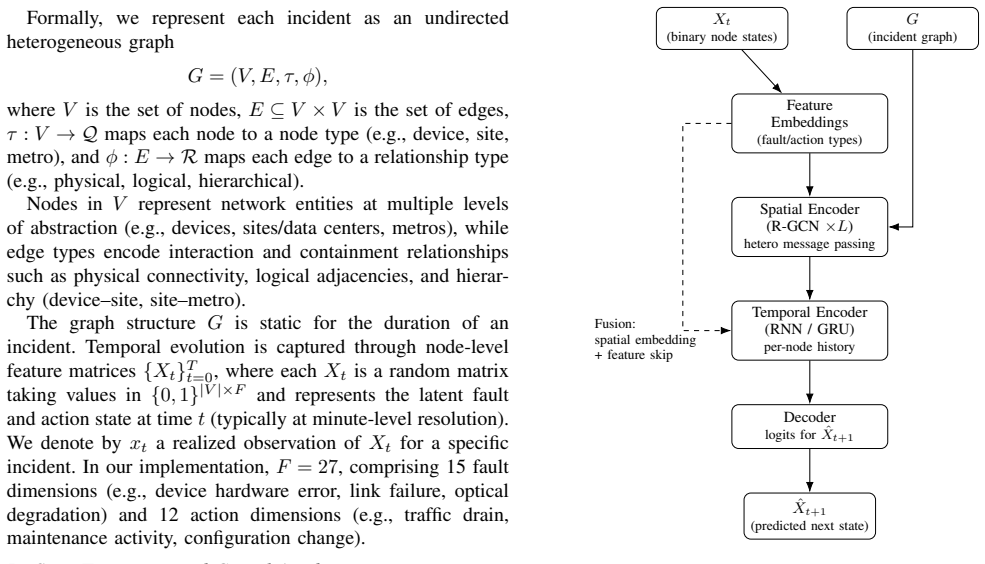
Can a learned model capture how faults propagate through a large-scale network and use this knowledge to causally attribute customer impact to its underlying root cause? Existing root cause analysis techniques often rely on static rules, correlation heuristics, or topology-local reasoning, which struggle to generalize in dynamic environments where faults propagate across complex physical and logical dependencies. We present NetCause, a self-supervised learning-based framework that models network incidents as graph-temporal processes and uses counterfactual simulation to rank candidate root causes. This approach produces an interpretable ranking of root cause hypotheses and integrates naturally with operator-defined mitigation and remediation actions. We train the model on over 1,500 incidents collected over six months from a leading cloud provider's production network and evaluate it on 31 expert-labeled incidents. NetCause consistently improves root cause ranking quality in the regime most relevant to operational decision-making, achieving a 16.1% accuracy improvement over a rule-based heuristic baseline. While training is computationally intensive, inference is lightweight, requiring only seconds of GPU runtime per incident (well below typical telemetry collection latencies).
Editorial analysis
A structured set of objections, weighed in public.
Referee Report
Summary. The paper proposes NetCause, a self-supervised framework for root cause analysis in large-scale networks. It models incidents as graph-temporal processes and uses counterfactual simulation to rank root causes. The model is trained on over 1,500 incidents from a production network and evaluated on 31 expert-labeled incidents, claiming a 16.1% accuracy improvement over a rule-based heuristic baseline.
Significance. If the counterfactual simulations accurately reflect real fault propagation, this approach could offer a more robust and generalizable method for RCA compared to static rules or local reasoning, particularly in dynamic environments. The self-supervised learning on a large set of unlabeled incidents and the lightweight inference (seconds per incident) are positive aspects that could make it practical for deployment.
major comments (2)
- [Evaluation] Evaluation section: the 16.1% accuracy improvement is reported on 31 expert-labeled incidents after training on 1,500 incidents, but the manuscript supplies no confirmation that the 31 incidents are fully disjoint from the training set, no definition of the ranking accuracy metric, and no statistical significance test; these omissions are load-bearing for the central performance claim.
- [Method] Method and Evaluation sections: without ground-truth causal graphs, known causal edges, or held-out post-mortems, there is no independent verification that the learned graph-temporal counterfactual simulator recovers actual fault propagation rather than correlations; this directly affects whether gains over the rule-based baseline can be attributed to causal reasoning.
minor comments (1)
- [Abstract] Abstract: the phrase 'accuracy improvement' is used for what is described as ranking quality; consistent terminology would improve clarity.
Simulated Author's Rebuttal
We thank the referee for the constructive comments on our manuscript. Below we respond point-by-point to the major comments and indicate the revisions we will make.
read point-by-point responses
-
Referee: [Evaluation] Evaluation section: the 16.1% accuracy improvement is reported on 31 expert-labeled incidents after training on 1,500 incidents, but the manuscript supplies no confirmation that the 31 incidents are fully disjoint from the training set, no definition of the ranking accuracy metric, and no statistical significance test; these omissions are load-bearing for the central performance claim.
Authors: The 31 expert-labeled incidents were collected and labeled independently after the training period and are fully disjoint from the 1,500 training incidents; we will add an explicit statement confirming this separation. The ranking accuracy metric is the fraction of incidents for which the ground-truth root cause appears among the top-3 ranked hypotheses (chosen to match the typical number of candidates an operator would inspect). We will insert a formal definition of this metric in Section 4.2. Given the modest sample size, we will also add a bootstrap resampling procedure with 1,000 iterations to report 95% confidence intervals around the 16.1% improvement. These clarifications and the statistical test will be incorporated in the revised Evaluation section. revision: yes
-
Referee: [Method] Method and Evaluation sections: without ground-truth causal graphs, known causal edges, or held-out post-mortems, there is no independent verification that the learned graph-temporal counterfactual simulator recovers actual fault propagation rather than correlations; this directly affects whether gains over the rule-based baseline can be attributed to causal reasoning.
Authors: We agree that the lack of ground-truth causal structures precludes direct verification that the simulator has recovered true causal edges rather than predictive correlations. Our defense of the approach rests on the self-supervised objective trained across 1,500 diverse incidents and the consistent lift over a rule-based baseline that itself encodes only local topology and static correlations. We will add a paragraph in the Discussion section that explicitly acknowledges this inferential nature of the causal claim and outlines future validation on synthetic networks with known causal graphs. No stronger empirical verification is possible with the current production dataset. revision: partial
- Independent verification that the counterfactual simulator recovers actual fault propagation (rather than correlations), due to the absence of ground-truth causal graphs or known causal edges in the production dataset.
Circularity Check
No significant circularity in derivation or evaluation chain
full rationale
The paper describes an empirical ML pipeline: self-supervised training of a graph-temporal model on 1,500 unlabeled incidents followed by evaluation of root-cause ranking quality on a distinct set of 31 expert-labeled incidents, with performance measured against an external rule-based baseline. No equations, uniqueness theorems, or ansatzes are presented that reduce any claimed prediction or ranking to the training inputs by construction. The central result is an observed 16.1% accuracy lift on held-out labeled data; this is a standard train/eval split and does not invoke self-citation chains or rename known results. The framework is therefore self-contained against external benchmarks.
Axiom & Free-Parameter Ledger
Reference graph
Works this paper leans on
-
[1]
Pearl and D
J. Pearl and D. Mackenzie,The book of why: the new science of cause and effect. Basic books, 2018
2018
-
[2]
Pearl,Causality: models, reasoning, and inference
J. Pearl,Causality: models, reasoning, and inference. Cambridge University Press, 2009
2009
-
[3]
Assumption violations in causal discovery and the robustness of score matching,
F. Montagna, A. A. Mastakouri, E. Eulig, N. Noceti, L. Rosasco, D. Janzing, B. Aragam, and F. Locatello, “Assumption violations in causal discovery and the robustness of score matching,” inThirty- seventh Conference on Neural Information Processing Systems, 2023. [Online]. Available: https://openreview.net/forum?id=IyTArtpuCK
2023
-
[4]
Neural relational inference for interacting systems,
T. Kipf, E. Fetaya, K.-C. Wang, M. Welling, and R. Zemel, “Neural relational inference for interacting systems,” inInternational conference on machine learning. Pmlr, 2018, pp. 2688–2697
2018
-
[5]
Estimating counterfactual treatment outcomes over time through adversarially bal- anced representations,
I. Bica, A. M. Alaa, J. Jordon, and M. Van Der Schaar, “Estimating counterfactual treatment outcomes over time through adversarially bal- anced representations,” 2020
2020
-
[6]
Neural message passing for quantum chemistry,
J. Gilmer, S. S. Schoenholz, P. F. Riley, O. Vinyals, and G. E. Dahl, “Neural message passing for quantum chemistry,” inInternational conference on machine learning. Pmlr, 2017, pp. 1263–1272
2017
-
[7]
Diffusion convolutional re- current neural network: Data-driven traffic forecasting,
Y . Li, R. Yu, C. Shahabi, and Y . Liu, “Diffusion convolutional re- current neural network: Data-driven traffic forecasting,”arXiv preprint arXiv:1707.01926, 2017
Pith/arXiv arXiv 2017
-
[8]
Spotting culprits in epi- demics: How many and which ones?
B. A. Prakash, J. Vreeken, and C. Faloutsos, “Spotting culprits in epi- demics: How many and which ones?” in2012 IEEE 12th international conference on data mining. IEEE, 2012, pp. 11–20
2012
-
[9]
A physical-information-flow-constrained temporal graph neural network-based simulator for granular materials,
S. Zhao, H. Chen, and J. Zhao, “A physical-information-flow-constrained temporal graph neural network-based simulator for granular materials,” Computer Methods in Applied Mechanics and Engineering, vol. 433, p. 117536, 2025
2025
-
[10]
World models,
D. Ha and J. Schmidhuber, “World models,” inNeurIPS, 2018
2018
-
[11]
A coding approach to event correlation,
S. Kliger, S. Yemini, Y . Yemini, D. Ohsie, and S. Stolfo, “A coding approach to event correlation,” inInternational Symposium on Integrated Network Management. Springer, 1995, pp. 266–277
1995
-
[12]
High speed and robust event correlation,
S. A. Yemini, S. Kliger, E. Mozes, Y . Yemini, and D. Ohsie, “High speed and robust event correlation,”IEEE communications Magazine, vol. 34, no. 5, pp. 82–90, 1996
1996
-
[13]
Causalrca: Causal inference based pre- cise fine-grained root cause localization for microservice applications,
R. Xin, P. Chen, and Z. Zhao, “Causalrca: Causal inference based pre- cise fine-grained root cause localization for microservice applications,” Journal of Systems and Software, vol. 203, p. 111724, 2023
2023
-
[14]
Causal structure-based root cause analysis of outliers,
K. Budhathoki, L. Minorics, P. Bloebaum, and D. Janzing, “Causal structure-based root cause analysis of outliers,” inProceedings of the 39th International Conference on Machine Learning, ser. Proceedings of Machine Learning Research, K. Chaudhuri, S. Jegelka, L. Song, C. Szepesvari, G. Niu, and S. Sabato, Eds., vol. 162. PMLR, 17–23 Jul 2022, pp. 2357–2369
2022
-
[15]
The petshop dataset – finding causes of performance issues across microservices,
M. Hardt, W. Orchard, P. Bl ¨obaum, S. Kasiviswanathan, and E. Kirschbaum, “The petshop dataset – finding causes of performance issues across microservices,” CLeaR, 2023
2023
-
[16]
Mulan: multi-modal causal structure learning and root cause analysis for microservice systems,
L. Zheng, Z. Chen, J. He, and H. Chen, “Mulan: multi-modal causal structure learning and root cause analysis for microservice systems,” in Proceedings of the ACM Web Conference 2024, 2024, pp. 4107–4116
2024
-
[17]
Root cause analysis of outliers with missing structural knowledge,
W. R. Orchard, N. Okati, S. H. G. Mejia, P. Bl ¨obaum, and D. Janzing, “Root cause analysis of outliers with missing structural knowledge,” inThe Thirty-ninth Annual Conference on Neural Information Processing Systems, 2025. [Online]. Available: https://openreview.net/forum?id=7Nxq4RQApu
2025
-
[18]
Graph neural network based root cause analysis using multivariate time-series kpis for wireless networks
C.-C. Yen, W. Sun, H. Purmehdi, W. Park, K. R. Deshmukh, N. Thakrar, O. Nassef, and A. Jacobs, “Graph neural network based root cause analysis using multivariate time-series kpis for wireless networks.” in NOMS, vol. 2022, 2022, pp. 1–7
2022
-
[19]
Graph attention network with granger causality map for fault detection and root cause diagnosis,
Y . Liu and B. Jafarpour, “Graph attention network with granger causality map for fault detection and root cause diagnosis,”Computers & Chem- ical Engineering, vol. 180, p. 108453, 2024
2024
-
[20]
Automatic root cause analysis via large language models for cloud incidents,
Y . Chen, H. Xie, M. Ma, Y . Kang, X. Gao, L. Shi, Y . Cao, X. Gao, H. Fan, M. Wenet al., “Automatic root cause analysis via large language models for cloud incidents,” inProceedings of the Nineteenth European Conference on Computer Systems, 2024, pp. 674–688
2024
-
[21]
Exploring llm-based agents for root cause analysis,
D. Roy, X. Zhang, R. Bhave, C. Bansal, P. Las-Casas, R. Fonseca, and S. Rajmohan, “Exploring llm-based agents for root cause analysis,” in Companion proceedings of the 32nd ACM international conference on the foundations of software engineering, 2024, pp. 208–219
2024
-
[22]
Large language models for networking: Workflow, advances and challenges,
C. Liu, X. Xie, X. Zhang, and Y . Cui, “Large language models for networking: Workflow, advances and challenges,”IEEE Network, 2024. APPENDIX A. Model Details: R-GCN Spatial Encoder For completeness, we provide the Relational Graph Convo- lutional Network (R-GCN) update used in the spatial encoder. Leth (l) v ∈R d denote the hidden representation of nodev...
2024
discussion (0)
Sign in with ORCID, Apple, or X to comment. Anyone can read and Pith papers without signing in.