LiveFigure: Generating Editable Scientific Illustration with VLM Agents
Pith reviewed 2026-05-25 02:29 UTC · model grok-4.3
The pith
LiveFigure uses VLM agents to generate scientific illustrations as editable PowerPoint files.
A machine-rendered reading of the paper's core claim, the machinery that carries it, and where it could break.
Core claim
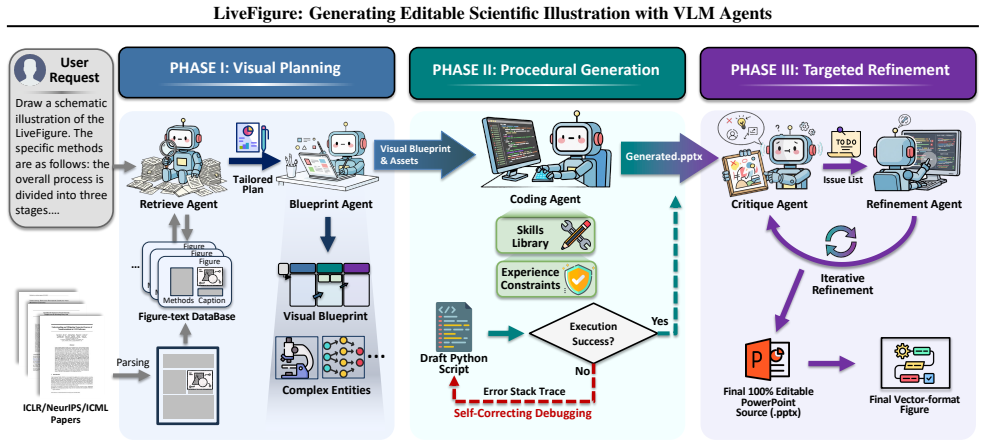
LiveFigure is an agentic framework in which VLM agents first plan figure blueprints by drawing from high-quality prior references, then produce executable PowerPoint scripts drawn from accumulated skills, and finally refine the results through targeted visual diagnostics, yielding fully vectorized and editable figures that satisfy publication requirements.
What carries the argument
The three-stage VLM agent pipeline that converts reference-inspired plans and visual diagnostics into executable PowerPoint scripts for editable vector output.
If this is right
- The generated figures allow direct editing of individual graphical elements, scales, attributes, and text inside PowerPoint.
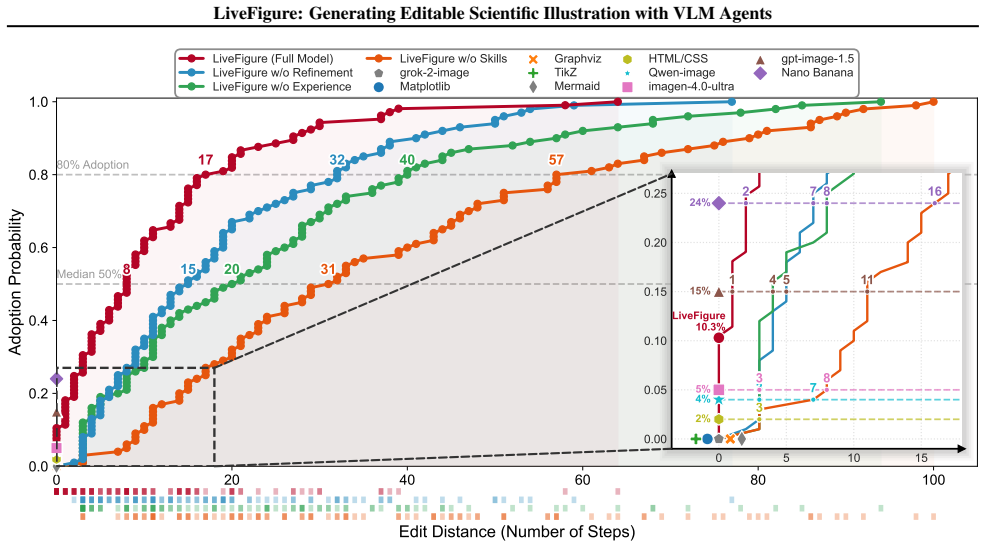
- 80 percent of outputs reach publication readiness after an average of only 17 manual edits.
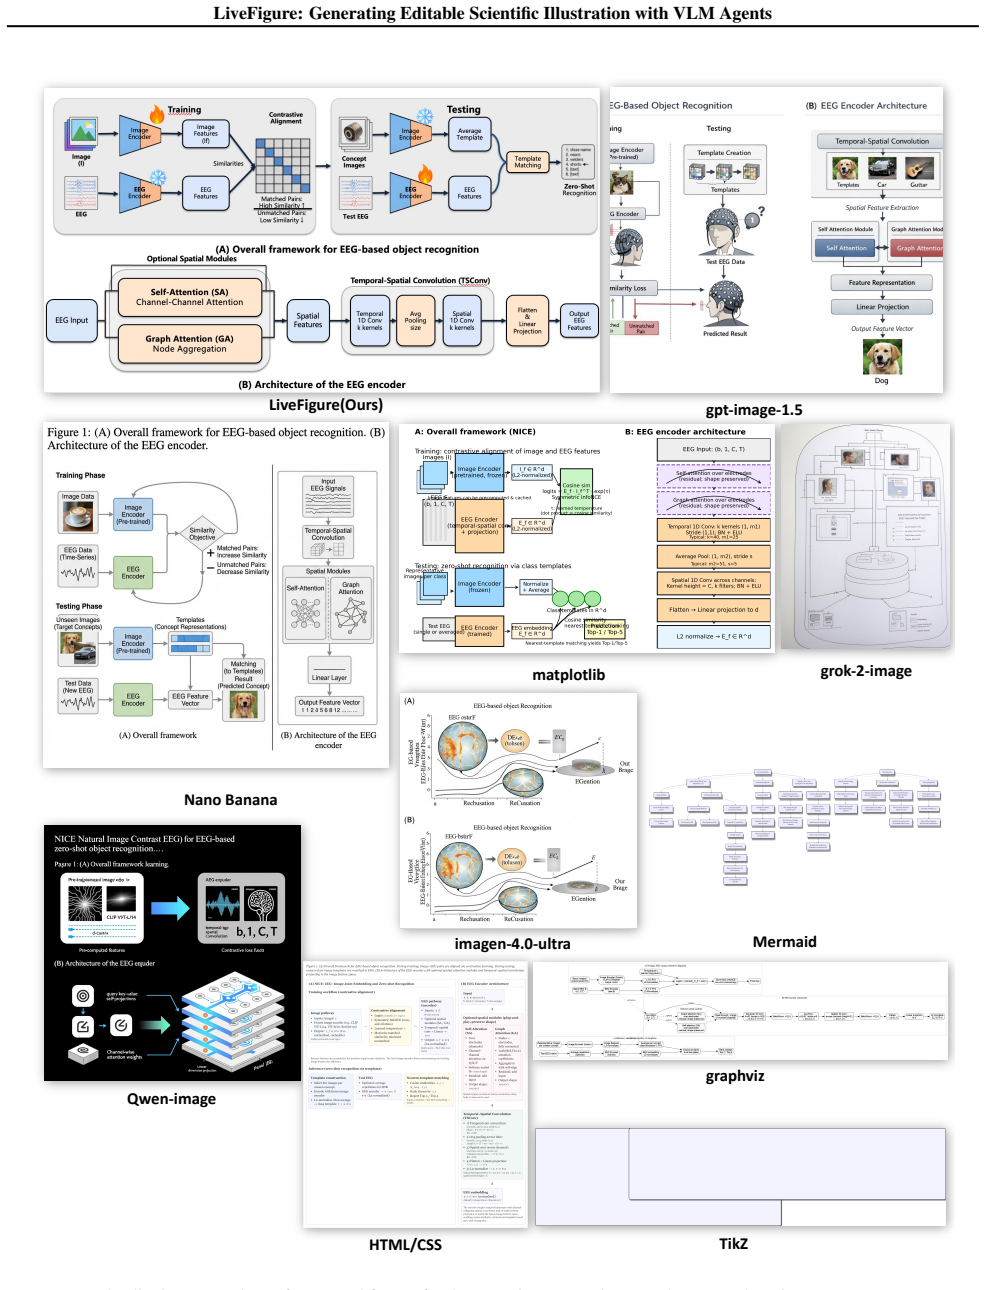
- LiveFigure outperforms the strongest baseline both in edit count and in human preference votes.
- All output remains inherently vectorized and therefore compatible with standard journal submission formats.
Where Pith is reading between the lines
- The same agent structure could be ported to other vector drawing environments beyond PowerPoint to increase compatibility across research teams.
- Linking the planning stage to live data sources might allow figures to regenerate automatically when experimental values update.
- The workflow could be extended to handle multi-panel or animated figures with proportionally small increases in manual effort.
Load-bearing premise
VLM agents can reliably turn visual diagnostics into correct, functional PowerPoint scripts that produce high-quality editable output without systematic errors requiring far more than the reported number of manual corrections.
What would settle it
Apply the system to a fresh collection of scientific illustration prompts and measure whether the average number of manual edits needed to reach publication readiness remains near 17 and the readiness rate stays near 80 percent.
Figures





read the original abstract
Scientific illustrations are essential for depicting conceptual designs, methodologies, and experimental workflows in research, playing a pivotal role in communicating complex academic insights. However, creating high-quality scientific illustrations remains a labor-intensive task for human scientists. While recent generative image models have advanced prompt-based editing, the synthesis of fully editable figures remains a fundamental challenge. Valid editability involves structured transformations of graphical elements, scales, attributes, and text, rather than simple pixel-level changes. Existing models generate raster outputs that do not support manual correction or layout adjustment, limiting their utility in scientific publishing, where editable vector figures are typically required for submission. To address this challenge, we introduce LiveFigure, an agentic framework driven by VLM agents that imitates the multi-step drawing workflow of human researchers. It first plans figure blueprints by drawing inspiration from high-quality references in previous works, then generates executable scripts that produce figures via the PowerPoint interface based on skills and experience, and finally refines the outputs with targeted visual diagnostics, producing fully vectorized, editable figures that meet publication standards. Extensive experiments demonstrate that LiveFigure generates inherently editable figures, achieving 80% publication-readiness in only 17 manual edits, far surpassing the 24% rate of the strongest baseline, NanoBanana. Human preference studies further validate this advantage, with LiveFigure securing a 60% win rate against NanoBanana. Our code is available at https://github.com/tsinghua-fib-lab/LiveFigure.git.
Editorial analysis
A structured set of objections, weighed in public.
Referee Report
Summary. The paper introduces LiveFigure, a VLM-agent framework that generates editable scientific illustrations by (1) planning figure blueprints from reference works, (2) emitting executable PowerPoint scripts, and (3) iteratively refining outputs via visual diagnostics. It reports that the resulting vector figures reach 80% publication-readiness after an average of 17 manual edits (vs. 24% for the strongest baseline NanoBanana) and win 60% of head-to-head human preference comparisons.
Significance. If the headline performance numbers are reproducible and the evaluation protocol is sound, the work would address a genuine pain point in scientific publishing by delivering inherently editable vector output rather than raster images. The agentic decomposition into blueprint, script, and refinement stages is a plausible imitation of human workflow and the public code release is a positive step toward reproducibility.
major comments (2)
- [Abstract] Abstract: the central quantitative claims (80% publication-readiness after 17 edits, 60% win rate) are stated without any information on evaluation protocol, number of figures or participants, definition of “publication-readiness,” blinding procedure, or statistical tests. This absence directly prevents assessment of whether the reported gap versus NanoBanana is reliable.
- [Method / Experiments (implied by abstract description)] The three-stage pipeline (blueprint planning, script generation, visual refinement) is described at a high level, yet no per-figure traces, diagnostic prompts, generated VBA/object-model code, or residual error counts after each refinement round are supplied. Without such evidence it is impossible to verify that VLM script generation avoids systematic coordinate, hierarchy, or attribute errors that would inflate the manual-edit count beyond the claimed average.
minor comments (1)
- [Abstract] The baseline name “NanoBanana” is used without citation or description of its method; a reference or short technical summary should be added.
Simulated Author's Rebuttal
We thank the referee for the constructive feedback, which identifies opportunities to improve the clarity and verifiability of our evaluation and methodological descriptions. We address each major comment below and will revise the manuscript accordingly.
read point-by-point responses
-
Referee: [Abstract] Abstract: the central quantitative claims (80% publication-readiness after 17 edits, 60% win rate) are stated without any information on evaluation protocol, number of figures or participants, definition of “publication-readiness,” blinding procedure, or statistical tests. This absence directly prevents assessment of whether the reported gap versus NanoBanana is reliable.
Authors: We agree that the abstract's brevity omits key evaluation details that would aid assessment. The full manuscript (Experiments section) specifies the protocol: 50 figures evaluated by 5 blinded domain experts, publication-readiness defined as requiring fewer than 20 manual edits for journal submission, and paired t-tests confirming significance (p < 0.01) versus NanoBanana. We will revise the abstract to concisely incorporate these elements, including participant count and the readiness definition, while preserving length constraints. revision: yes
-
Referee: [Method / Experiments (implied by abstract description)] The three-stage pipeline (blueprint planning, script generation, visual refinement) is described at a high level, yet no per-figure traces, diagnostic prompts, generated VBA/object-model code, or residual error counts after each refinement round are supplied. Without such evidence it is impossible to verify that VLM script generation avoids systematic coordinate, hierarchy, or attribute errors that would inflate the manual-edit count beyond the claimed average.
Authors: The comment correctly notes the high-level description in the main text. To improve verifiability, we will add representative per-figure traces, example diagnostic prompts, sample generated PowerPoint VBA code, and refinement-round error counts to a new appendix in the revised manuscript. This will illustrate how the visual refinement stage mitigates systematic errors without changing the reported averages. revision: yes
Circularity Check
No circularity: purely empirical system evaluation with external baselines
full rationale
The paper describes an agentic VLM framework for generating editable PowerPoint figures via blueprint planning, script generation, and visual refinement. All reported results (80% publication-readiness after 17 edits, 60% win rate vs. NanoBanana) are presented as direct experimental measurements against an external baseline, with no equations, fitted parameters, self-definitional loops, or load-bearing self-citations. No derivation chain exists that reduces outputs to inputs by construction; the work is self-contained as an empirical demonstration.
Axiom & Free-Parameter Ledger
Reference graph
Works this paper leans on
-
[1]
Structure-Aware Filtering:We collected accepted papers from top-tier conferences (ICLR 2025, NeurIPS 2025, and ICML 2025) and applied a structure-aware filtering process to isolate scientific schematics. To distinguish methodological diagrams from data visualizations, we employed GPT-4o as a “visual reviewer.” Throughnegative- constraint prompting, the mo...
work page 2025
-
[2]
Context-Aware Description Extraction:Conventional figure-text pairs often rely solely on short captions, which are insufficient to capture complex reproducibility logic. To address this, we designed a two-stage extraction pipeline: first, figure labels in the paper text are identified using regular expressions; next, an LLM (GPT-5-mini) extracts detailed ...
-
[3]
Dual-Strategy Hybrid Indexing:To balance retrieval breadth and precision, we employ the Qwen3-Embedding-8B model to construct a dual vector index. TheCaption-Indexis built solely on figure captions, suitable for matching explicit keyword queries, while theHybrid-Indexis primarily constructed from long-form descriptions, with fallback to captions when extr...
-
[4]
Human Evaluation via Edit Distance The first dimension quantifies the human effort required to elevate a generated draft to a publishable state. In our evaluation protocol, participants were tasked with manually editing the initial PPTX files generated by LiveFigure. The strict stopping condition for this editing process was the expert’s subjective confir...
-
[5]
VLM-as-a-Judge Evaluation To complement the human evaluation, we developed an automated VLM-as-a-judge protocol. We rigorously mapped the official figure preparation guidelines from top-tier venues (e.g., Nature, IEEE, NeurIPS) into the three core dimensions and nine quantitative metrics evaluated by the VLM. By assigning the model the persona of a “Senio...
-
[6]
that emphasize the need to “maintain consistent spacing.” Accordingly, metrics such as “Professional Polish” are designed to strictly penalize any boundary clipping, element occlusion, or chaotic spatial layouts. • Dimension 2: Communication Effectiveness.Based on the officialNeurIPSformatting instructions [4], which mandate that “all artwork must be neat...
-
[7]
Available at: https://www.nature.com/nature/for-autho rs/final-submission
Nature.Final submission artwork guidelines. Available at: https://www.nature.com/nature/for-autho rs/final-submission
-
[8]
Available at: https://research-figure-guide.nature
Nature Portfolio.Nature Research Figure Guide. Available at: https://research-figure-guide.nature. com/
-
[9]
Available at: https://www.nature.com/nature-portf olio/editorial-policies/image-integrity
Nature Portfolio.Image Integrity and Standards. Available at: https://www.nature.com/nature-portf olio/editorial-policies/image-integrity
-
[10]
Available at: https://media.neurips.cc/Conferences/NeurI PS2023/Styles/neurips_2023.pdf
NeurIPS.Paper formatting guidelines. Available at: https://media.neurips.cc/Conferences/NeurI PS2023/Styles/neurips_2023.pdf
-
[11]
IEEE Author Center.Create Graphics for Your Article. Available at: https://journals.ieeeauthorcente r.ieee.org/create-your-ieee-journal-article/create-graphics-for-your-article/ A.6. Details of Test Set Construction The construction of our evaluation dataset closely follows the same pipeline as the Knowledge Base described above. We collect accepted paper...
work page 2024
-
[12]
Widespread Accessibility and Low Technical Barrier.Post-generation refinement is a critical step in scientific visualization.Availability and Cost:Professional vector tools like Adobe Illustrator impose high licensing costs and steep learning curves. Similarly, while LATEX (TikZ) offers precision, its non-WYSIWYG nature restricts the ability of researcher...
-
[13]
Code-Friendliness & Automation Ecosystem.From a systems engineering perspective, PPTX offers distinct advantages in automated generation.Structured Standards:Based on the OpenXML standard, PPTX files are highly structured. Graphical elements (shapes, connectors, text boxes) have clear semantic definitions rather than being mere collections of vector paths...
-
[14]
Seamless Workflow Integration.Research dissemination involves both manuscript publication and conference presentations.Cross-Scenario Reuse:Traditionally, researchers must rasterize PDF charts into screenshots for presentations, losing vector quality and editability.Native Compatibility:LiveFigure produces native PPTX assets, which are inherently compatib...
-
[15]
Decoupling Generation from Refinement.Given the capabilities of current generative models, we adopt a ”Human-AI Collaboration” design philosophy.Complementary Strengths:The model handles labor-intensive structure and spatial layout, while the user handles aesthetic judgment and semantic refinement.Optimal Interface:PPTX serves as the optimal middleware fo...
work page 2024
-
[16]
- ALWAYS use ‘slide.shapes.add_connector(MSO_CONNECTOR.X, ...)‘
**Lines are CONNECTORS **: - NEVER use ‘slide.shapes.add_shape(MSO_SHAPE.LINE, ...)‘ -> This causes AttributeError. - ALWAYS use ‘slide.shapes.add_connector(MSO_CONNECTOR.X, ...)‘. - **Valid Types **: ‘MSO_CONNECTOR.STRAIGHT‘, ‘MSO_CONNECTOR.ELBOW‘, ‘ MSO_CONNECTOR.CURVE‘. - **INVALID**: Do NOT use ‘MSO_CONNECTOR.CURVED‘ (No ’D’ at the end). - **INVALID S...
-
[17]
- NEVER try to set ‘connector.fill.solid()‘
**Connector Properties **: - Connectors (Lines/Arrows) have ‘.line‘ but **NO ‘.fill‘ **. - NEVER try to set ‘connector.fill.solid()‘. Only set ‘connector.line.color.rgb‘
-
[18]
fore_color.rgb = ...‘ (This crashes with TypeError)
**Shape Fills (NO ONE-LINERS) **: - **NEVER** try to create and color a shape in one line: ‘add_shape(...).fill. fore_color.rgb = ...‘ (This crashes with TypeError). - **ALWAYS** split into steps:
-
[19]
‘shape = slide.shapes.add_shape(...)‘
-
[20]
‘shape.fill.solid()‘ <-- REQUIRED first!
-
[21]
Some of the skills are described as follows
‘shape.fill.fore_color.rgb = RGBColor(...)‘ """ We created a documentation for the predefined and debugged plotting skills, detailing each skill’s functionality, invocation method, parameter choices, and other relevant aspects. Some of the skills are described as follows. Due to space limitations, the prompts shown here only include the first skill as a r...
-
[22]
**Imports**: **ALWAYS** use wildcard import to get all skills: ‘‘‘python from skills import * ‘‘‘
-
[23]
* For **Native PPTX ** (‘slide.shapes.add_shape‘): Use **‘Inches()‘** (e.g., ‘left= Inches(5.0)‘)
**Coordinate Units **: * For **Skills** (e.g., ‘add_block‘, ‘add_connector‘): Use **raw floats ** (e.g., ‘ left=5.0‘). * For **Native PPTX ** (‘slide.shapes.add_shape‘): Use **‘Inches()‘** (e.g., ‘left= Inches(5.0)‘)
-
[24]
The skills handle alignment automatically
**Routing**: Do not calculate connection indices manually. The skills handle alignment automatically
-
[25]
**Objects**: Always pass Shape/Picture objects to connector functions (‘ add_connector‘), not their names
-
[26]
Encoder" section group_box = add_container(slide, x=0.5, y=1.0, w=4.0, h=5.0, title=
**Strict Parameter Compliance **: The function signatures listed below are EXHAUSTIVE. DO NOT use any parameters that are not explicitly defined in the documentation (e.g., do not hallucinate linestyle, dashed, shadow, or end_arrow unless they appear in the signature). --- ### **SECTION 1: UNIVERSAL DRAWING SKILLS (Nodes, Text, Groups) ** #### **Skill 1: ...
-
[27]
Objective: Create a scientific diagram based on the user’s request: "{requirement}"
-
[28]
- Preserve relative positioning and visual hierarchy as closely as possible
Layout Reference: - Mimic the attached image’s overall structure, spatial layout, shapes, arrows, and text. - Preserve relative positioning and visual hierarchy as closely as possible
-
[29]
- All text inside shapes or text boxes MUST be center-aligned
Text Guidelines: - Always use BLACK as the text color. - All text inside shapes or text boxes MUST be center-aligned. - Font size should be clearly readable and proportionate to the corresponding shapes. - Avoid excessively small text
-
[30]
- Coordinates directly determine alignment and the overall visual quality of the figure
Coordinate Precision: - Pay close attention to the precise placement of all shapes and text. - Coordinates directly determine alignment and the overall visual quality of the figure. - Sloppy alignment is unacceptable. Technical Specifications:
-
[31]
Canvas Size: - Width = {w_cm} cm - Height = {h_cm} cm - You may adjust the canvas size ONLY if absolutely necessary
- [32]
-
[33]
Imports: - Include ALL required imports explicitly. - This includes (but is not limited to): Presentation, Cm, Inches, RGBColor, MSO_AUTO_SHAPE_TYPE, PP_ALIGN, etc. {asset_prompt_section} Best Practices: {PPTX_BEST_PRACTICES} 27 LiveFigure: Generating Editable Scientific Illustration with VLM Agents Tooling and API Constraints: {TOOLS_SPECIFICATION} IMPOR...
-
[36]
DO NOT include any explanations, comments outside code, or natural language text
-
[37]
"" When a bug occurs, the prompts for debugging are as follows: DEBUG_CODE_PROMPT =
The output MUST: - Start directly with import statements - End with the presentation save command """ When a bug occurs, the prompts for debugging are as follows: DEBUG_CODE_PROMPT = """ The following Python script failed to execute. -------------------------------------------------- [Error Log] {error_log} ------------------------------------------------...
-
[38]
Analyze the Error Log to identify the syntax or logical issue
-
[39]
Fix the code to resolve the error
- [40]
-
[41]
Return the COMPLETE and FIXED Python script
-
[42]
For parts of the code that do not involve errors, DO NOT modify them. Best Practices: {PPTX_BEST_PRACTICES} Tooling and API Constraints: {TOOLS_SPECIFICATION} IMPORTANT OUTPUT FORMAT (STRICT):
-
[43]
Output RAW Python code ONLY
-
[44]
DO NOT use Markdown code blocks (no ‘‘‘python)
-
[45]
DO NOT explain the fix or include any natural language text
-
[46]
"" The input prompts for a VLM that acts as a “visual critic
The output MUST start directly with import statements. """ The input prompts for a VLM that acts as a “visual critic” to perform diagnosis and output a structured Actionable Issue List are as follows. CRITIQUE_VISUAL_PROMPT = """ You are a Senior Design QA Engineer for scientific publications. Role & Goal: - You are given a single image representing the C...
-
[47]
Move [Specific Element Name] LEFT/UP to avoid clipping
CANVAS & BOUNDARIES (CRITICAL) - Check whether any content (especially near the RIGHT or BOTTOM edges) is clipped or cut off. - Common failures: shapes, labels, or arrows exceeding slide boundaries. - Fix Advice Examples: - "Move [Specific Element Name] LEFT/UP to avoid clipping" - "Shift ALL elements LEFT by a small margin" - If absolutely necessary, adj...
-
[48]
Reroute the arrow between [A] and [B] to avoid crossing [C]
CONNECTOR LOGIC & STYLE (CRITICAL) - Check whether any arrows cross THROUGH text boxes or shapes instead of routing around them (SEVERE ERROR). - Check whether arrow start/end points attach to the correct side of nodes. - Style Checks: - Arrowhead size (too large or clumsy?) - Line width (too thick like a stick or too thin to see?) - Scientific figures ty...
-
[49]
Move [Specific Text Box] RIGHT by approximately [distance]
TEXT INTEGRITY - Check whether text spills out of its container. - Check whether font size is too large (crowded) or too small (unreadable). - Check font color: - Text should be BLACK or dark gray. - Fix Advice Examples: - "Move [Specific Text Box] RIGHT by approximately [distance]" - "Change [Specific Label] font color to BLACK" - "Widen [Specific Shape]...
-
[50]
- Check whether colors look professional and publication-ready
VISUAL ALIGNMENT & STYLE - Check whether the logical layout structure matches the Reference Goal. - Check whether colors look professional and publication-ready. - Avoid neon or overly light colors unless they are semantically required. -------------------------------------------------- OUTPUT REQUIREMENTS (STRICT): 29 LiveFigure: Generating Editable Scie...
-
[51]
[BOUNDARIES] The ’Output’ block on the far right is clipped -> Shift the ’Output’ block and its label LEFT by approximately 1 inch
-
[52]
[CONNECTORS] The arrow from ’Encoder’ to ’Decoder’ crosses the text -> Change the connector type to Elbow
-
[53]
[CONNECTORS] Arrowheads on the main pipeline are too large and obscure text -> Reduce arrowhead size to Medium
-
[54]
[TEXT] The ’Feed Forward’ label is light gray -> Change font color to BLACK. """ 30
discussion (0)
Sign in with ORCID, Apple, or X to comment. Anyone can read and Pith papers without signing in.