REVIEW 3 major objections 5 minor 2 cited by
Photometric Determination of Unresolved Main-sequence Binaries in the Pleiades: Binary Fraction and Mass Ratio Distribution
T0 review · 3 major / 5 minor · reviewed 2026-08-10 · deepseek-v4-flash
Pith's one-line read A complete photometric census of unresolved binaries in the Pleiades gives a binary fraction of 0.34 and a mass-ratio distribution that rises, falls, and rises again across three power-law segments.
desk verdict A genuinely useful photometric binary census of the Pleiades, but the three-segment mass-ratio distribution needs a forward-model completeness test before being trusted. read the letter →
The pith
A machine-rendered reading of the paper's core claim, the machinery that carries it, and where it could break.
The reading
What carries the argument
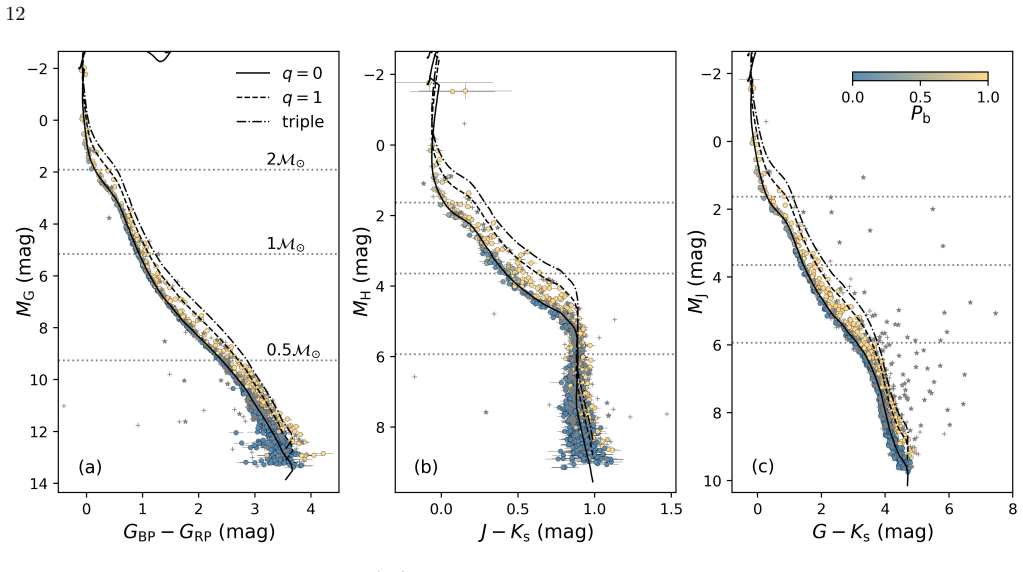
The carrying mechanism is an empirical photometric model, $M_{\rm emp}(M_s)=M_{\rm model}(M_s)+\Delta m(M_s)$, built for each band by fitting the ridgeline of the $\delta m$--$M_s$ plane with a robust regression that discards outliers; this calibrates the theoretical isochrone to the actual single-star main sequence. A binary's combined magnitude is then $-2.5\log_{10}(10^{-0.4M_{\rm emp}(M_1)}+10^{-0.4M_{\rm emp}(qM_1)})$, leaving only the primary mass $M_1$ and mass ratio $q$ as free parameters for each member. Individual Bayesian posterior densities $p_i(M_1,q)$ are stacked into a cluster-wide density $P(M_1,q)$, and all binary statistics, including $f_{\rm b}$, the mass-ratio distribution, and their primary-mass dependence, are computed by integrating this stacked density rather than by thresholding best-fit values.
What would settle it
Measure radial velocities or take high-resolution images of the Pleiades stars classified as low-mass single stars, especially those with inferred masses near the bottom of the main sequence where the near-infrared corrections are about 0.5 mag; if a significant fraction show companions with $q\simeq0.2$--$0.4$, then the empirical ridgeline is biased and the claimed low-$q$ shape of the mass-ratio distribution is not physical.
Extended reading notes
Core claim
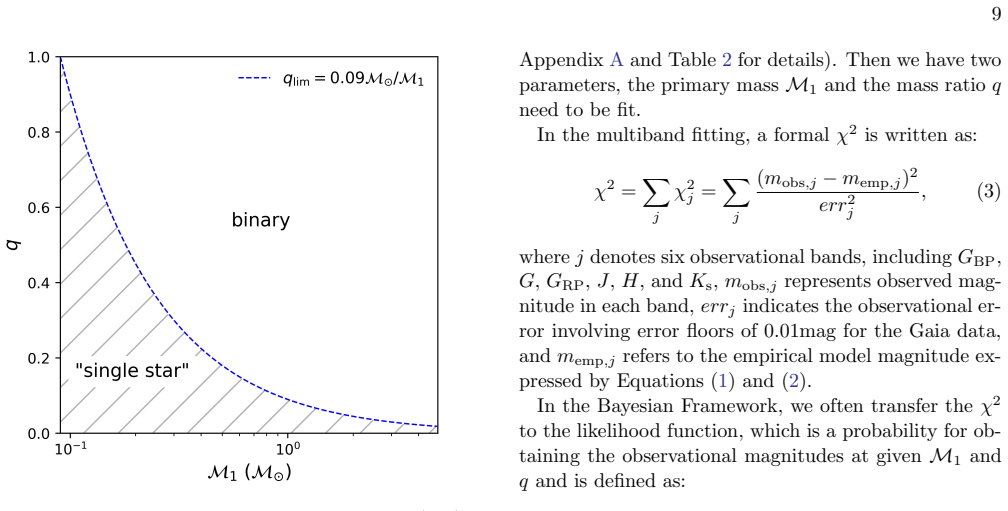
The central claim is that unresolved main-sequence binaries in the Pleiades can be detected photometrically down to the theoretical lower mass limit, defined by a companion mass of $0.09\,M_\odot$, if optical and near-infrared magnitudes are fitted together against an empirical model calibrated on the cluster's own main sequence. For the 1154 main-sequence members, the paper reports a binary fraction $f_{\rm b}=0.34\pm0.02$ for all mass ratios above $q_{\rm lim}(M_1)=0.09\,M_\odot/M_1$. Stacking the per-star posterior probability densities gives a mass-ratio distribution that rises as $q^{0.8\pm0.2}$ below $q\approx0.32$, falls as $q^{-1.0\pm0.3}$ between $q\approx0.32$ and $q\approx0.79$, and rises again as $q^{3.1\pm1.0}$ above $q\approx0.79$: a deficiency of low-$q$ binaries and an excess of high-$q$ binaries relative to a single $q^{-1}$ power law. The paper also claims that binary fraction increases from about 0.18 to 0.94 with primary mass, that high-$q$ binaries are mostly low-mass primaries, and that using the Gaia RUWE value as a binary indicator catches only about one-third of photometric binaries.
Load-bearing premise
The load-bearing premise is that the ridgeline used to define single-star magnitudes is a true picture of single stars at every mass, including the low-mass range where the near-infrared corrections reach about 0.5 mag; if that ridgeline is pulled by unresolved binaries or model errors, the binary fraction and the low-mass-ratio rise would be biased without an independent check in that range.
Editorial extensions
If this is right
- Optical-plus-infrared photometry pushes the detectable mass ratio to the theoretical stellar-mass limit, roughly doubling the low-$q$ reach of optical-only color-magnitude analyses.
- Within the same $q>0.6$ selection used by optical-only studies, the paper reproduces previously published binary fractions, so earlier discrepancies are largely a mass-ratio coverage effect rather than a contradiction.
- The mass-ratio distribution requires a three-segment power law rather than a single exponent, described as a fiducial $q^{-1}$ law with a low-$q$ deficit and a high-$q$ excess.
- Binary fraction rises monotonically with primary mass, and the rise sits mainly in low- and intermediate-mass-ratio binaries, consistent with dynamical disruption of weakly bound systems plus the $q_{\rm lim}$ selection effect.
- The Gaia RUWE value flags only about one-third of the photometric binaries in this sample, so RUWE-based binary censuses are strongly incomplete.
Reading between the lines
- Editorial inference: rebuilding the empirical model using only spectroscopically confirmed single stars would provide an independent check of whether the low-$q$ upturn and the $0.34$ fraction are robust; this is a test the paper does not perform.
- Editorial inference: because the empirical corrections are calibrated on the Pleiades itself, applying the same six-band procedure to other clusters requires re-deriving each cluster's ridgeline, so the method's conclusions should be read as cluster-specific until recalibrated.
- Editorial inference: if the excess of high-$q$ binaries is dominated by low-mass primaries, as the paper's stacked densities indicate, deeper surveys of very-low-mass companions in the Pleiades should find a higher companion frequency around low-mass stars than around solar-mass stars.
Editorial analysis
A structured set of objections, weighed in public.
Referee Report
Summary. The paper presents a multiband photometric fitting method for unresolved main-sequence binaries in the Pleiades, combining Gaia DR3 and 2MASS photometry with an empirical correction to the PARSEC model. The authors derive a Bayesian PDF for primary mass and mass ratio for each of 1154 members, stack the PDFs, and report a binary fraction fb = 0.34 ± 0.02, a rising binary fraction with primary mass, and a three-segment power-law mass-ratio distribution with exponents γ1 = 0.8 ± 0.2, γ2 = −1.0 ± 0.3, γ3 = 3.1 ± 1.0 and breakpoints at q = 0.32 ± 0.04 and q = 0.79 ± 0.05. The method is validated against 17 radial-velocity binaries from Torres et al. (2021) and is compared with several earlier determinations of the Pleiades binary fraction.
Significance. If the central claims hold, the paper would provide the broadest photometric census of unresolved Pleiades binaries to date, reaching mass ratios close to the theoretical hydrogen-burning limit, and would furnish a clear empirical target for models of binary formation and dynamical evolution. The Bayesian stacking approach is a genuine methodological step beyond point-estimate analyses, and the external comparison with the Torres et al. (2021) dynamical mass ratios is a useful validation for moderate- and high-q binaries. However, the headline fb uncertainty is only Poisson, the empirical model is calibrated on the same cluster it is used to analyze, and the claimed three-segment mass-ratio distribution is not tested against a forward model of the smooth completeness or against simpler distributions. These issues are load-bearing for the main conclusions, so the paper needs major revision before the claims can be accepted.
major comments (3)
- [Section 3.1, Fig. 3, Table 3] The empirical photometric model is calibrated on the same cluster it is then used to analyze, and the first calibration step assumes all members are single stars. At low masses the NIR corrections are large, up to about 0.5 mag (Table 3, low-Ms rows; Section 3.1.2), so if unresolved binaries or model errors bias the ITGP ridgeline, the derived M1 and q posteriors and hence the low-q part of the stacked PDFs are systematically biased. The external check against Torres et al. (2021) covers only 17 binaries and does not validate the q<0.3 regime in which the claimed low-q rise and the qb1 break occur. I request a simulation test: inject synthetic binaries with a known intrinsic q distribution into the sample and verify that the ITGP procedure recovers the true single-star ridgeline, or provide an independent low-mass NIR calibration from another cluster or from theoretical models.
- [Section 4.4, Fig. 12] The three-segment power-law claim is not tested against a single power law convolved with the actual, smooth completeness function. Equation (1) and the hard cutoff qlim(M1) = 0.09/M1 in Section 3.2.1 define a detectability boundary, but a secondary near qlim contributes only about 1–2% of the flux in the 2MASS bands for a 0.5 Msun primary, which is comparable to the adopted photometric error floors in Section 2.2; detectability is therefore a smooth, mass-dependent function of q. Because the number of primaries massive enough to probe q<0.3 is small and weighted by the steep mass function, a single intrinsic power law combined with this completeness can plausibly produce the apparent low-q rise and the qb1 break. The paper should forward-model the selection by simulating the full fitting and stacking procedure with a single power-law intrinsic q distribution, and should compare the three-segment fit against one- and two-segment models using an information criterion. Without this test, the existence of the three-segment distribution is not established.
- [Section 4.1–4.2, Eq. (7)] The reported uncertainty fb = 0.34 ± 0.02 is only the Poisson counting term nb^1/2 / n from Equation (7). It does not propagate the uncertainties from the empirical model corrections (Section 3.1), the adopted priors (log-uniform M1 and uniform q; Section 3.2.2), the membership probability cut Pk ≥ 0.5, the exclusion criterion χj^2 > 25 (Section 3.2.3), the Gaia error floors, or the assumed cluster parameters (age, AV, [Fe/H]) and individual distance moduli. Each of these can shift fb by several percent, and the large spread of previous measurements in Table 5 suggests that such systematics are non-negligible. I recommend a bootstrap over the sample and a marginalization over the calibration and nuisance parameters to produce a realistic systematic uncertainty alongside the Poisson term.
minor comments (5)
- [Title/Abstract] The title contains an obvious typo: 'Binary F raction' should be 'Binary Fraction'.
- [Abstract, Section 4.4] The phrase 'complete mass-ratio distribution' overstates the scope: the sample is limited to G<19, excludes MS+WD and higher-order multiples, and is restricted to q > qlim(M1). Suggest wording such as 'photometric mass-ratio distribution of unresolved MS+MS binaries with M1 > 0.11 Msun.'
- [Section 2.3] The MiMO fit for age and extinction assumes a flat mass-ratio distribution (γq = 0), which is later contradicted by the measured three-segment q distribution; the text should state explicitly why this prior choice does not feed back into the empirical model and the final results.
- [Figure 12] The gray histogram of nb(q) does not specify the bin width or the error prescription. Please state the binning and whether the error bars are Poisson errors on the integrated counts.
- [Section 4.5] The interpretive statement that 'the mass ratio of real binary systems, whether or not having an illuminated companion, might be monotonically decreasing' is speculative and is not directly tested by the data; it should be clearly labeled as an interpretation rather than a measurement, or supported by a quantitative model.
Circularity Check
No significant circularity: the empirical calibration targets the single-star ridgeline, the binary analysis is externally checked against Torres et al. (2021) RV binaries, and the qlim selection effect on the low-q break is explicitly stated as a limitation, not a circular input.
full rationale
The derivation chain is self-contained rather than circular. The empirical photometric model is constructed by fitting a ridgeline on the delta_m-M_s plane after assuming all members are single and using iterative trimming to exclude outliers (Section 3.1.1); binaries are therefore not built into the calibration by construction. The multiband Bayesian fit then uses this empirical model to derive posterior PDFs, and the binary fraction and mass-ratio distribution are measured by integrating the stacked posteriors (Sections 3.2 and 4.1). The method is externally checked: 17 objects in common with Torres et al. (2021) all have Pb near 1 and show correlated q values (Section 3.2.3, Figure 8), giving independent grounding for the central binary-detection claim. The main caveat is the low-mass-ratio regime: the paper explicitly states that the observed low-q break qb1 is attributed to the detection limit qlim(M1) (Section 4.5), and it does not forward-model the smooth completeness function in that regime. That is a statistical-modeling limitation, not a circular step, because qlim is defined from the PARSEC lower mass limit (0.09 Msun) and is not fitted to the target distribution. The self-citations (Li & Shao 2022; Li et al. 2020, 2021; Shao et al. 2024) are method citations for membership, cluster-parameter fitting, and robust regression; none imports an unverified uniqueness theorem or defines the target result into the input. The overstatement in the conclusion calling the three-segment profile a 'complete mass ratio distribution' should be read with the stated selection-effect caveat, but it does not make the derivation circular.
Assumptions & free parameters
free parameters (6)
- Cluster age =
log(Age/yr) = 8.026
- Visual extinction A_V =
0.135 mag
- Metallicity [Fe/H] =
0.1
- Empirical magnitude corrections delta_m(M_s) =
Tabulated for six bands in Table 3
- Gaia photometric error floor =
0.01 mag
- Intrinsic parallax dispersion sigma_varc =
0.17 mas
assumptions (6)
- domain assumption The PARSEC1.2s theoretical model, after empirical correction, accurately represents single-star photometry in the Pleiades.
- domain assumption The ridgeline of the delta_m-M_s plane traced by ITGP corresponds to single stars, with binaries and contaminants as outliers.
- domain assumption Companions with mass below 0.09 solar masses contribute negligible flux, so qlim = 0.09/M1 defines photometric binaries.
- domain assumption All Pleiades members share the cluster age, metallicity, and extinction.
- ad hoc to paper Uniform prior on q and log-uniform prior on M1 are appropriate for the Bayesian stacking.
- standard math Photometric errors are independent and Gaussian after applying error floors.
Cite this review
Pith. "Pith review of Photometric Determination of Unresolved Main-sequence Binaries in the Pleiades: Binary Fraction and Mass Ratio Distribution." pith.science (2026). https://pith.science/paper/FLWUYPNX
@misc{pith2026250101617,
  author       = {Pith},
  title        = {Pith review of: Photometric Determination of Unresolved Main-sequence Binaries in the Pleiades: Binary Fraction and Mass Ratio Distribution},
  year         = {2026},
  howpublished = {\url{https://pith.science/paper/FLWUYPNX}},
  note         = {Machine review of arXiv:2501.01617}
}
abstract
Accurate determination of binary fractions ($f_{\rm b}$) and mass ratio ($q$) distributions is crucial for understanding the dynamical evolution of open clusters. We present an improved multiband fitting technique to enhance the analysis of binary properties. This approach enables an accurate photometric determination of $f_{\rm b}$ and $q$ distribution in a cluster. The detectable mass ratio can be down to the $q_{\rm lim}$, limited by the minimum stellar mass in theoretical models. First, we derived an empirical model for magnitudes of Gaia DR3 and 2MASS bands that match the photometry of single stars in the Pleiades. We then performed a multiband fitting for each cluster member, deriving the probability density function (PDF) of its primary mass ($\mathcal{M}_1$) and $q$ in the Bayesian framework. 1154 main-sequence (MS) single stars or unresolved MS+MS binaries are identified as members of the Pleiades. By stacking their PDFs, we conducted a detailed analysis of binary properties of the cluster. We found the $f_{\rm b}$ of this sample is $0.34 \pm 0.02$. The $q$ distribution exhibits a three-segment power-law profile: an initial increase, followed by a decrease, and then another increase. This distribution can be interpreted as a fiducial power-law profile with an exponent of -1.0 that is determined in the range of $0.3 < q < 0.8$, but with a deficiency of binaries at lower $q$ and an excess at higher $q$. The variations of $f_{\rm b}$ and $q$ with $\mathcal{M}_1$ reveal a complex binary distribution within the Pleiades, which might be attributed to a combination of primordial binary formation mechanisms, dynamical interactions, and the observational limit of photometric binaries imposed by $q_{\rm lim} (\mathcal{M}_1)$.
Figures


Figures from the paper (11 more)




Forward citations
Cited by 2 Pith papers
-
The initial conditions and initial mass functions of Alpha Persei, Pleiades and Praesepe
For Alpha Persei, the Pleiades, and Praesepe, the initial mass function is top-light (α_high ≈ 2.98 ± 0.22) and shows possible cluster-to-cluster scatter, based on Gaia DR3 plus N-body emulator inference.
-
Analysis of Newly Catalogued Open Star Cluster UPK~220 with Gaia DR3 and TESS: Discovering Member Variable Stars
The paper reports eight variable member stars in the open cluster UPK 220 and derives its age (140 Myr), distance (0.83 to 0.97 kpc), and sub-solar metallicity, though the internal consistency of these results is weak.
Reference graph
Works this paper leans on
-
[1]
Almeida, A., Monteiro, H., & Dias, W. S. 2023, MNRAS, 525, 2315, doi: 10.1093/mnras/stad2291 Astropy Collaboration, Robitaille, T. P., Tollerud, E. J., et al. 2013, A&A, 558, A33, doi: 10.1051/0004-6361/201322068 Astropy Collaboration, Price-Whelan, A. M., Sip˝ ocz, B. M., et al. 2018, AJ, 156, 123, doi: 10.3847/1538-3881/aabc4f
-
[2]
2023, A&A, 674, A32, doi: 10.1051/0004-6361/202243790
Babusiaux, C., Fabricius, C., Khanna, S., et al. 2023, A&A, 674, A32, doi: 10.1051/0004-6361/202243790
-
[3]
Bate, M. R. 2000, MNRAS, 314, 33, doi: 10.1046/j.1365-8711.2000.03333.x
arXiv 2000
- [4]
-
[5]
2012, MNRAS, 427, 127, doi: 10.1111/j.1365-2966.2012.21948.x
Bressan, A., Marigo, P., Girardi, L., et al. 2012, MNRAS, 427, 127, doi: 10.1111/j.1365-2966.2012.21948.x
arXiv 2012
-
[6]
2020, A&A, 633, A99, doi: 10.1051/0004-6361/201936691
Cantat-Gaudin, T., & Anders, F. 2020, A&A, 633, A99, doi: 10.1051/0004-6361/201936691
-
[7]
2015, MNRAS, 452, 1068, doi: 10.1093/mnras/stv1281
Chen, Y., Bressan, A., Girardi, L., et al. 2015, MNRAS, 452, 1068, doi: 10.1093/mnras/stv1281
-
[8]
2014, MNRAS, 444, 2525, doi: 10.1093/mnras/stu1605
Chen, Y., Girardi, L., Bressan, A., et al. 2014, MNRAS, 444, 2525, doi: 10.1093/mnras/stu1605
Show all 55 references
-
[9]
2019, A&A, 632, A105, doi: 10.1051/0004-6361/201936612
Chen, Y., Girardi, L., Fu, X., et al. 2019, A&A, 632, A105, doi: 10.1051/0004-6361/201936612
2019 doi
-
[10]
C., Geller, A
Childs, A. C., Geller, A. M., von Hippel, T., Motherway, E., & Zwicker, C. 2024, ApJ, 962, 41, doi: 10.3847/1538-4357/ad18c0
2024 doi
-
[11]
2024, AJ, 168, 156, doi: 10.3847/1538-3881/ad7025
Chulkov, D. 2024, AJ, 168, 156, doi: 10.3847/1538-3881/ad7025
2024 doi
-
[12]
E., Geller, A
Cohen, R. E., Geller, A. M., & von Hippel, T. 2020, AJ, 159, 11, doi: 10.3847/1538-3881/ab59d7
2020 doi
-
[13]
P., Marino, A
Cordoni, G., Milone, A. P., Marino, A. F., et al. 2023, A&A, 672, A29, doi: 10.1051/0004-6361/202245457 De Angeli, F., Weiler, M., Montegriffo, P., et al. 2023, A&A, 674, A2, doi: 10.1051/0004-6361/202243680
2023 doi
-
[14]
2023, A&A, 675, A89, doi: 10.1051/0004-6361/202245219
Donada, J., Anders, F., Jordi, C., et al. 2023, A&A, 675, A89, doi: 10.1051/0004-6361/202245219
2023 doi
-
[15]
W., Riello, M., De Angeli, F., et al
Evans, D. W., Riello, M., De Angeli, F., et al. 2018, A&A, 616, A4, doi: 10.1051/0004-6361/201832756
2018 doi
-
[16]
D., Duffell, P., MacFadyen, A
Farris, B. D., Duffell, P., MacFadyen, A. I., & Haiman, Z. 2014, ApJ, 783, 134, doi: 10.1088/0004-637X/783/2/134
2014 doi
-
[17]
J., Barnes, S
Fritzewski, D. J., Barnes, S. A., James, D. J., et al. 2019, A&A, 622, A110, doi: 10.1051/0004-6361/201833587
2019 doi
-
[18]
2018, MNRAS, 476, 496, doi: 10.1093/mnras/sty235 —
Fu, X., Bressan, A., Marigo, P., et al. 2018, MNRAS, 476, 496, doi: 10.1093/mnras/sty235 —. 2016, IAU Focus Meeting, 29B, 144, doi: 10.1017/S1743921316004634
2018 doi
-
[19]
2022, A&A, 668, A4, doi: 10.1051/0004-6361/202243590 Gaia Collaboration, Prusti, T., de Bruijne, J
Fu, X., Bragaglia, A., Liu, C., et al. 2022, A&A, 668, A4, doi: 10.1051/0004-6361/202243590 Gaia Collaboration, Prusti, T., de Bruijne, J. H. J., et al. 2016, A&A, 595, A1, doi: 10.1051/0004-6361/201629272 Gaia Collaboration, Vallenari, A., Brown, A. G. A., et al. 2023, A&A, 6...
2022 doi
-
[20]
M., de Grijs, R., Li, C., & Hurley, J
Geller, A. M., de Grijs, R., Li, C., & Hurley, J. R. 2013a, ApJ, 779, 30, doi: 10.1088/0004-637X/779/1/30 —. 2015, ApJ, 805, 11, doi: 10.1088/0004-637X/805/1/11
2015 doi
-
[21]
M., Hurley, J
Geller, A. M., Hurley, J. R., & Mathieu, R. D. 2013b, AJ, 145, 8, doi: 10.1088/0004-6256/145/1/8
-
[22]
Heggie, D. C. 1975, MNRAS, 173, 729, doi: 10.1093/mnras/173.3.729 20
1975 doi
-
[23]
L., & Reffert, S
Hunt, E. L., & Reffert, S. 2023, A&A, 673, A114, doi: 10.1051/0004-6361/202346285
2023 doi
-
[24]
V., Roy, K., Joshi, N., & Subramaniam, A
Jadhav, V. V., Roy, K., Joshi, N., & Subramaniam, A. 2021, AJ, 162, 264, doi: 10.3847/1538-3881/ac2571
2021 doi
-
[25]
J., & Lada, E
Lada, C. J., & Lada, E. A. 2003, ARA&A, 41, 57, doi: 10.1146/annurev.astro.41.011802.094844
2003 arXiv
-
[26]
Lange, J. U. 2023, Monthly Notices of the Royal Astronomical Society, 525, 3181, doi: 10.1093/mnras/stad2441
2023 doi
-
[27]
2022, ApJ, 930, 44, doi: 10.3847/1538-4357/ac5f4f
Li, L., & Shao, Z. 2022, ApJ, 930, 44, doi: 10.3847/1538-4357/ac5f4f
2022 doi
-
[28]
2020, ApJ, 901, 49, doi: 10.3847/1538-4357/abaef3
Li, L., Shao, Z., Li, Z.-Z., et al. 2020, ApJ, 901, 49, doi: 10.3847/1538-4357/abaef3
2020 doi
-
[29]
2021, Astronomy and Computing, 36, 100483, doi: 10.1016/j.ascom.2021.100483
Li, Z.-Z., Li, L., & Shao, Z. 2021, Astronomy and Computing, 36, 100483, doi: 10.1016/j.ascom.2021.100483
2021
-
[30]
D., Deacon, N
Lodieu, N., Dobbie, P. D., Deacon, N. R., et al. 2007, MNRAS, 380, 712, doi: 10.1111/j.1365-2966.2007.12106.x
2007
-
[31]
L., & Silvotti, R
Lodieu, N., P´ erez-Garrido, A., Smart, R. L., & Silvotti, R. 2019, A&A, 628, A66, doi: 10.1051/0004-6361/201935533
2019 doi
-
[32]
Seleznev, A. F. 2023, AJ, 165, 45, doi: 10.3847/1538-3881/aca666
2023 doi
-
[33]
A., Seleznev, A
Malofeeva, A. A., Seleznev, A. F., & Carraro, G. 2022, AJ, 163, 113, doi: 10.3847/1538-3881/ac47a3
2022 doi
-
[34]
2011, MNRAS, 417, 1684, doi: 10.1111/j.1365-2966.2011.19257.x Mart ´ ın, E
Marks, M., Kroupa, P., & Oh, S. 2011, MNRAS, 417, 1684, doi: 10.1111/j.1365-2966.2011.19257.x Mart ´ ın, E. L., Barrado y Navascu´ es, D., Baraffe, I., Bouy, H., & Dahm, S. 2003, ApJ, 594, 525, doi: 10.1086/376938
2011
-
[35]
2019, ApJ, 871, 36, doi: 10.3847/1538-4357/aaf6ab
Matsumoto, T., Saigo, K., & Takakuwa, S. 2019, ApJ, 871, 36, doi: 10.3847/1538-4357/aaf6ab
2019 doi
-
[36]
J., Mioduszewski, A
Melis, C., Reid, M. J., Mioduszewski, A. J., Stauffer, J. R., & Bower, G. C. 2014, Science, 345, 1029, doi: 10.1126/science.1256101
2014 doi
-
[37]
P., Piotto, G., Bedin, L
Milone, A. P., Piotto, G., Bedin, L. R., et al. 2012, A&A, 540, A16, doi: 10.1051/0004-6361/201016384
2012 doi
-
[38]
2017, ApJS, 230, 15, doi: 10.3847/1538-4365/aa6fb6
Moe, M., & Di Stefano, R. 2017, ApJS, 230, 15, doi: 10.3847/1538-4365/aa6fb6
2017 doi
-
[39]
2023, A&A, 674, A3, doi: 10.1051/0004-6361/202243880
Montegriffo, P., De Angeli, F., Andrae, R., et al. 2023, A&A, 674, A3, doi: 10.1051/0004-6361/202243880
2023 doi
-
[40]
2020, ApJ, 903, 93, doi: 10.3847/1538-4357/abb8d6
Niu, H., Wang, J., & Fu, J. 2020, ApJ, 903, 93, doi: 10.3847/1538-4357/abb8d6
2020 doi
- [41]
-
[42]
J., Dobbie, P
Pinfield, D. J., Dobbie, P. D., Jameson, R. F., et al. 2003, MNRAS, 342, 1241, doi: 10.1046/j.1365-8711.2003.06630.x
2003
-
[43]
W., et al
Riello, M., De Angeli, F., Evans, D. W., et al. 2021, A&A, 649, A3, doi: 10.1051/0004-6361/202039587
2021 doi
-
[44]
2019, MNRAS, 489, 3093, doi: 10.1093/mnras/stz2317
Shao, Z., & Li, L. 2019, MNRAS, 489, 3093, doi: 10.1093/mnras/stz2317
2019 doi
-
[45]
1996, Acta Astronomica Sinica, 37, 377
Shao, Z., & Zhao, J. 1996, Acta Astronomica Sinica, 37, 377
1996
-
[46]
F., Cutri, R
Skrutskie, M. F., Cutri, R. M., Stiening, R., et al. 2006, AJ, 131, 1163, doi: 10.1086/498708
2006 doi
-
[47]
1944, ApJ, 100, 360, doi: 10.1086/144677
Smith, B., & Struve, O. 1944, ApJ, 100, 360, doi: 10.1086/144677
1944 doi
-
[48]
Southworth, J., Maxted, P. F. L., & Smalley, B. 2005, A&A, 429, 645, doi: 10.1051/0004-6361:20041867
2005 doi
-
[49]
Stauffer, J. R. 1982, AJ, 87, 1507, doi: 10.1086/113241
1982 doi
-
[50]
A., & Jameson, R
Steele, I. A., & Jameson, R. F. 1995, MNRAS, 272, 630, doi: 10.1093/mnras/272.3.630
1995 doi
-
[51]
2014, MNRAS, 445, 4287, doi: 10.1093/mnras/stu2029
Tang, J., Bressan, A., Rosenfield, P., et al. 2014, MNRAS, 445, 4287, doi: 10.1093/mnras/stu2029
2014 doi
-
[52]
A., Frinchaboy, P
Thompson, B. A., Frinchaboy, P. M., Spoo, T., & Donor, J. 2021, AJ, 161, 160, doi: 10.3847/1538-3881/abde4c
2021 doi
-
[53]
2020, ApJ, 901, 91, doi: 10.3847/1538-4357/abb136
Torres, G. 2020, ApJ, 901, 91, doi: 10.3847/1538-4357/abb136
2020 doi
-
[54]
W., & Quinn, S
Torres, G., Latham, D. W., & Quinn, S. N. 2021, ApJ, 921, 117, doi: 10.3847/1538-4357/ac1585
2021 doi
-
[55]
Weiler, M., Jordi, C., Fabricius, C., & Carrasco, J. M. 2018, A&A, 615, A24, doi: 10.1051/0004-6361/201732489 21 APPENDIX A. BAYESIAN INFERENCE OF PARALLAX FOR NEARBY CLUSTER MEMBERS For nearby star clusters, both the scale of the line-of-sight distribution and the parallax me...
2018 doi
Reviewed August 10, 2026 · model on record in the stance chip above.
Discussion (0). Continue with ORCID to comment.