On the limiting geometry of unsteady breaking waves subject to co-flowing wind: spectrally-informed versus locally-measured steepness
Pith reviewed 2026-06-29 09:36 UTC · model grok-4.3
The pith
Crest-front steepness at incipient breaking holds a lower threshold near 0.2 that decreases with wind speed as crests lean less forward.
A machine-rendered reading of the paper's core claim, the machinery that carries it, and where it could break.
Core claim
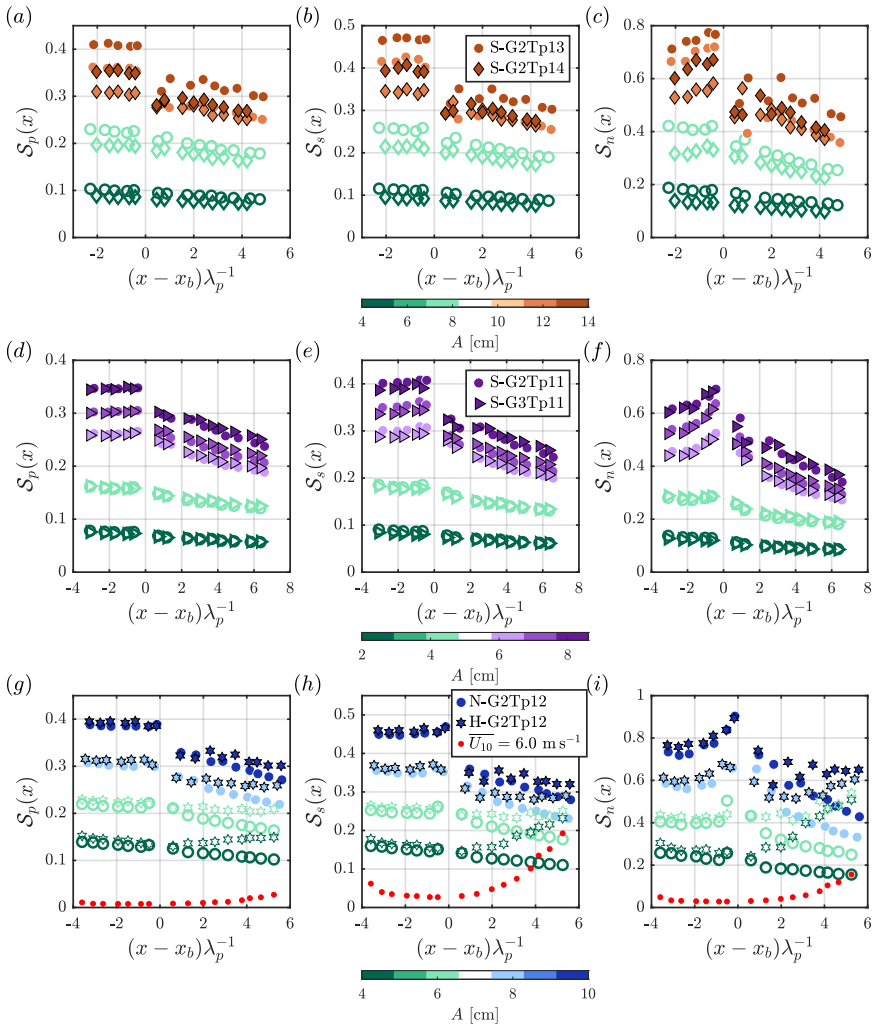
The crest-front steepness S_front(tb), which measures the front-face slope at the instant of incipient breaking, exhibits a consistent breaking-onset lower-bound threshold of S_front(tb)≈0.2. Values above this threshold decrease with wind speed as crests become less forward leaning. This behavior is attributed to wind-modified dispersion, enhanced high-frequency spectral content, and aerodynamic sheltering, indicating that wind-wave and wave-wave interactions act as competing mechanisms in triggering breaking through processes beyond what geometry alone can explain. Even so, S_front(tb) retains strong potential as a controlling variable for studies of breaking energetics and crest-scale dyna
What carries the argument
Crest-front steepness S_front(tb) at incipient breaking time tb, extracted from local spatial surface profiles to give the slope of the front face of the crest.
Load-bearing premise
The image-processing method used to extract local surface profiles captures unbiased geometry exactly at the instant of incipient breaking, and the laboratory campaigns cover the relevant spectral and wind conditions without selection bias.
What would settle it
Observing breaking events with crest-front steepness below 0.2 or sustained non-breaking waves with crest-front steepness well above 0.2 under comparable wind and spectral conditions would falsify the reported threshold.
Figures


read the original abstract
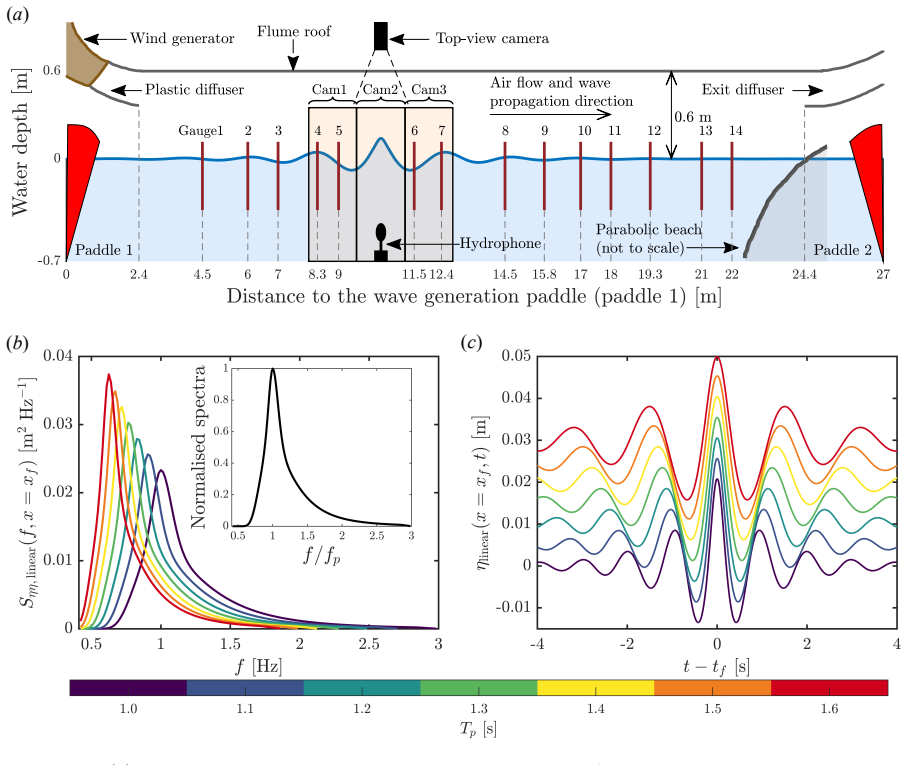
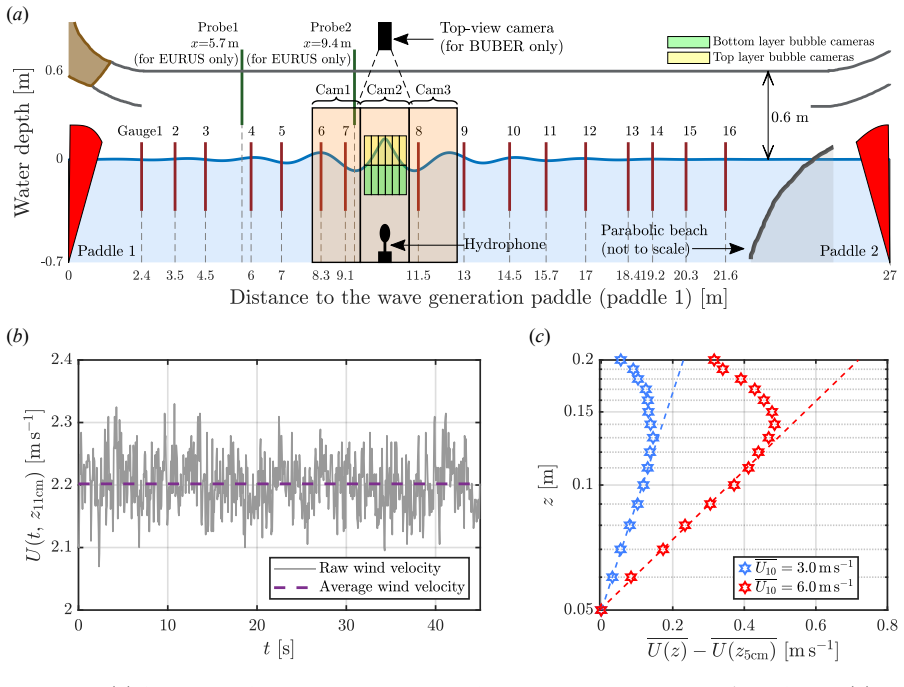
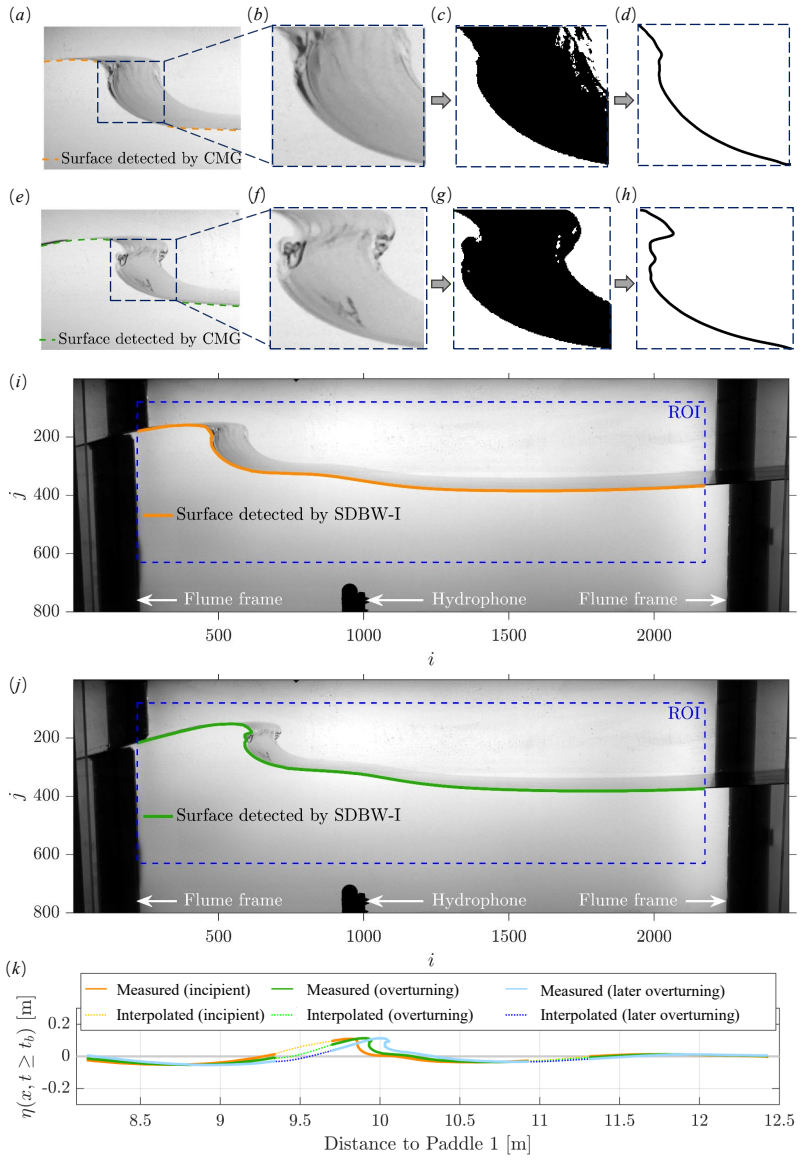
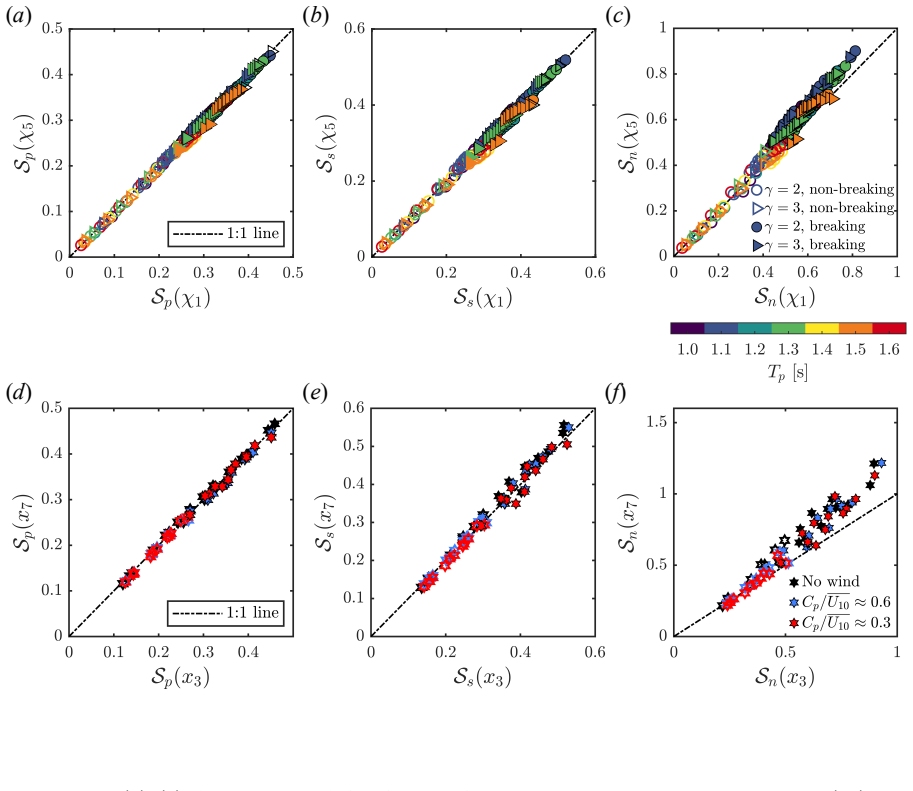
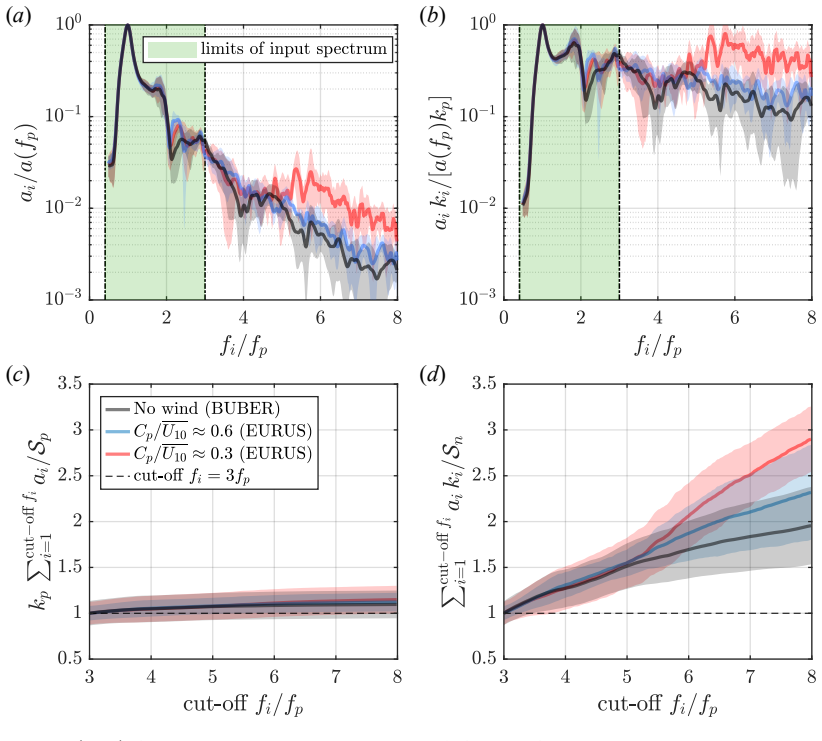
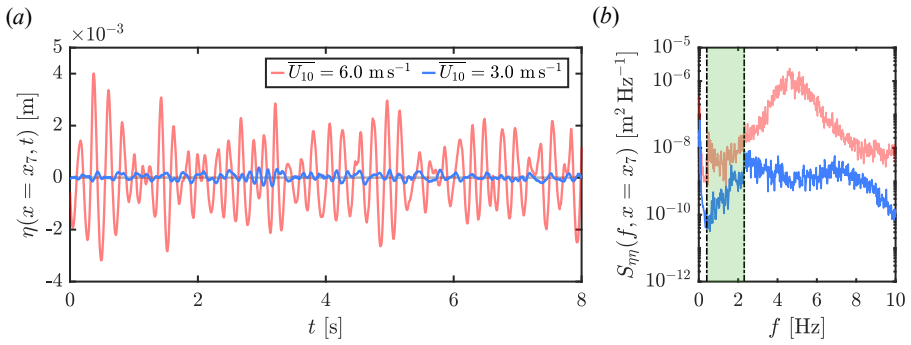
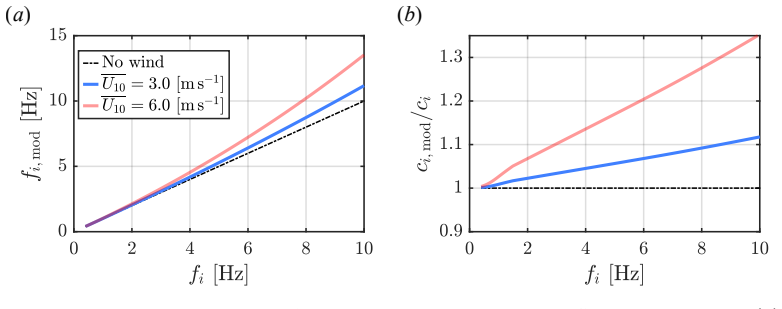
Wave steepness is a key geometric variable for describing breaking occurrence and its consequences, including energy dissipation and air entrainment. Using three laboratory campaigns under varying spectral conditions and co-flowing wind forcing, we contrast two types of steepness commonly used for unsteady breaking waves: spectrally-informed wave-group steepness (prognostic), obtained from fixed-point surface-elevation records, and locally-measured crest steepness (diagnostic), obtained from spatial surface profiles extracted using the SDBW-I image-processing method developed herein. For the former, the long-adopted $\mathcal{S}_n$ (linear sum of Fourier-component steepness) increases appreciably within about two dominant wavelengths upstream of breaking because of its sensitivity to evolving high-frequency content. When measured sufficiently far upstream, however, wave-group steepness remains approximately linearly related to the local zero-crossing steepness $\mathcal{S}_b$ across bulk unforced conditions. Notwithstanding this, we argue that the crest-front steepness, $\mathcal{S}_{\mathrm{front}}(t_b)$, which delineates the front-face slope at incipient breaking, is the most physically meaningful metric examined here. It exhibits a consistent breaking-onset lower-bound threshold of $\mathcal{S}_{\mathrm{front}}(t_b)\approx0.2$, while values above this threshold decrease with wind speed as crests become less forward leaning. This may be attributed to wind-modified dispersion, enhanced high-frequency spectral content and aerodynamic sheltering, suggesting that wind--wave and wave--wave interactions act as competing mechanisms in triggering breaking through kinematic and energetic processes beyond what geometry alone can explain. Even so, $\mathcal{S}_{\mathrm{front}}(t_b)$ has strong potential as a controlling variable for future studies of breaking energetics and crest-scale dynamics.
Editorial analysis
A structured set of objections, weighed in public.
Referee Report
Summary. The paper reports laboratory results from three campaigns on unsteady breaking waves with co-flowing wind. It contrasts spectrally-informed steepness (e.g., S_n from Fourier components, which grows near breaking due to high-frequency content) with locally measured crest steepness extracted via the new SDBW-I image-processing method. The central claim is that crest-front steepness S_front(t_b) at incipient breaking provides the most physically meaningful metric, exhibiting a consistent lower-bound threshold of approximately 0.2 that decreases with wind speed as crests become less forward-leaning, attributed to competing wind-wave and wave-wave interactions.
Significance. If substantiated, the result supplies a diagnostic geometric criterion for breaking onset that incorporates wind effects, offering a potential improvement over purely spectral or upstream steepness measures for modeling energy dissipation and crest dynamics. The multi-campaign design and explicit contrast between prognostic and diagnostic steepness metrics constitute a clear methodological strength.
major comments (2)
- [Abstract] Abstract: the headline threshold S_front(t_b)≈0.2 is stated without reported sample sizes, error bars, or quantitative validation of the SDBW-I pipeline (e.g., cross-checks against wave probes or sensitivity to thresholding/temporal interpolation), which directly bears on whether the lower-bound claim and its wind-speed trend can be considered robust.
- [Abstract] Abstract and methods description: the assertion that SDBW-I returns unbiased local surface profiles exactly at incipient breaking t_b lacks explicit criteria for breaking detection or tests for systematic offsets in t_b identification or perspective-corrected slope reconstruction; any such offset would shift the reported 0.2 threshold and undermine the claim that it is the most physically meaningful metric.
Simulated Author's Rebuttal
We thank the referee for their constructive comments, which help clarify the presentation of our results on crest-front steepness as a breaking-onset metric. We respond point-by-point below and indicate revisions to the manuscript.
read point-by-point responses
-
Referee: [Abstract] Abstract: the headline threshold S_front(t_b)≈0.2 is stated without reported sample sizes, error bars, or quantitative validation of the SDBW-I pipeline (e.g., cross-checks against wave probes or sensitivity to thresholding/temporal interpolation), which directly bears on whether the lower-bound claim and its wind-speed trend can be considered robust.
Authors: The abstract is space-limited, but the full manuscript reports data from three laboratory campaigns. We will revise the abstract to state the total number of breaking events analyzed and to reference the validation of SDBW-I (cross-checks with wave probes and sensitivity tests) that appears in the methods and results sections. These additions will make the robustness of the ≈0.2 threshold and its wind-speed dependence more immediately apparent without altering the central claim. revision: yes
-
Referee: [Abstract] Abstract and methods description: the assertion that SDBW-I returns unbiased local surface profiles exactly at incipient breaking t_b lacks explicit criteria for breaking detection or tests for systematic offsets in t_b identification or perspective-corrected slope reconstruction; any such offset would shift the reported 0.2 threshold and undermine the claim that it is the most physically meaningful metric.
Authors: We agree that the criteria used to identify t_b and any associated sensitivity tests should be stated explicitly. The manuscript already describes the SDBW-I pipeline and its application at incipient breaking, but we will expand the methods section to include the precise operational definition of t_b, the procedure for perspective correction, and the results of sensitivity analyses to thresholding and temporal interpolation. These additions will directly address concerns about possible systematic offsets while preserving the argument that S_front(t_b) is the most physically meaningful metric among those examined. revision: yes
Circularity Check
No circularity; threshold is direct empirical observation from lab data
full rationale
The paper reports laboratory measurements of crest-front steepness S_front(tb) at incipient breaking across three campaigns, identifying an observed lower-bound threshold ≈0.2 that decreases with wind speed. No derivation chain, equations, or predictions are presented that reduce this threshold to a fitted parameter, self-referential definition, or self-citation load-bearing premise. The SDBW-I method is described as the extraction tool, but the threshold itself emerges from the data rather than any construction that equates output to input by definition. This matches the default expectation of no significant circularity for measurement-based results.
Axiom & Free-Parameter Ledger
axioms (1)
- standard math Incompressible, irrotational flow assumptions standard in water-wave theory
Reference graph
Works this paper leans on
-
[1]
V., Chalikov, D., Young, I
Babanin, A. V., Chalikov, D., Young, I. R., and Savelyev, I. (2010). Numerical and laboratory investigation of breaking of steep two-dimensional waves in deep water.Journal of Fluid Mechanics, 644:433–463. Babanin, A. V., McConochie, J., and Chalikov, D. (2018). Winds near the Surface of Waves, Observations and Modelling.Journal of Physical Oceanography, ...
2010
-
[2]
Buckley, M. P. and Veron, F. (2016). Structure of the Airflow above Surface Waves.Journal of Physical Oceanography, 46(5):1377–1397. Callaghan, A. H., Deane, G. B., and Stokes, M. D. (2013). Two Regimes of Laboratory White- cap Foam Decay: Bubble-Plume Controlled and Surfactant Stabilized.Journal of Physical Oceanography, 43(6):1114–1126. Cao, R. (2024).T...
2016
-
[3]
Feddersen, F., Fincham, A
Analysis of an ensemble of wave profiles.Journal of Fluid Mechanics, 967:A35. Feddersen, F., Fincham, A. M., Brodie, K. L., Young, A. P., Spydell, M., Grimes, D. J., Pieszka, M., and Hanson, K. (2023). Cross-shore wind-induced changes to field-scale overturning wave shape.Journal of Fluid Mechanics, 958:A4. Fedele, F., Banner, M. L., and Barthelemy, X. (2...
2023
-
[4]
(2020).Extreme waves under significant wind stress
Gray, A. (2020).Extreme waves under significant wind stress. PhD thesis, Imperial College London, London, UK. 34 Hanson, J. L. and Phillips, O. M. (1999). Wind Sea Growth and Dissipation in the Open Ocean. Journal of Physical Oceanography, 29(8):1633–1648. Hara, T. and Mei, C. C. (1991). Frequency downshift in narrowbanded surface waves under the influenc...
2020
-
[5]
Hulin, F., Prevosto, M., Tassin, A., françois Filipot, J., Jacques, N., and Grilli, S. (2025). Breaking onset and breaking strength of focused wave packets: Linear prediction model and nonlinear numerical simulations.Coastal Engineering, 197:104660. Iafrati, A., DeVita, F., andVerzicco, R.(2019). Effectsofthewindonthebreakingofmodulated wave trains.Europe...
2025
-
[6]
C., Bredmose, H., Georgakis, C
Kristoffersen, J. C., Bredmose, H., Georgakis, C. T., Branger, H., and Luneau, C. (2021). Experimental study of the effect of wind above irregular waves on the wave-induced load statistics.Coastal Engineering, 168(June). Kumar, K. and Shemer, L. (2024). Laboratory study of the effect of mean water current on the evolution of young wind waves.Journal of Fl...
2021
-
[7]
H., Monty, J
Lee, J. H., Monty, J. P., Elsnab, J., Toffoli, A., Babanin, A. V., and Alberello, A. (2017). Estimation of Kinetic Energy Dissipation from Breaking Waves in the Wave Crest Region. Journal of Physical Oceanography, 47(5):1145–1150. Maleewong, M. and Grimshaw, R. (2024). Evolution of wind-induced wave groups in water of finite depth.Journal of Fluid Mechanics,
2017
-
[8]
T., Chapron, B., and Deike, L
35 Martin-Blanco, C., Scapin, N., Wu, J., Popinet, S., Farrar, J. T., Chapron, B., and Deike, L. (2026). Kinematics of gravity–capillary waves above an evolving underwater current.Journal of Fluid Mechanics, 1035:A5. McAllister, M. L., Draycott, S., Calvert, R., Davey, T., Dias, F., and van den Bremer, T. S. (2024). Three-dimensional wave breaking.Nature,...
2026
-
[9]
A., and Easson, W
36 She, K., Greated, C. A., and Easson, W. J. (1994). Experimental Study of Three-Dimensional Wave Breaking.Journal of Waterway, Port, Coastal, and Ocean Engineering, 120(1):20–36. Shemer, L. and Singh, S. K. (2021). Spatially evolving regular water wave under the action of steady wind forcing.Physical Review Fluids, 6(3):34802. Shemer, L., Singh, S. K., ...
1994
discussion (0)
Sign in with ORCID, Apple, or X to comment. Anyone can read and Pith papers without signing in.