First Light and Reionization Epoch Simulations (FLARES) XXII: UV-dust spatial offsets at the Epoch of Reionisation
Pith reviewed 2026-06-29 17:08 UTC · model grok-4.3
The pith
Simulations find that roughly 16 percent of massive galaxies at redshifts 5 to 10 have ultraviolet and far-infrared emission peaks separated by 2.5 kiloparsecs or more.
A machine-rendered reading of the paper's core claim, the machinery that carries it, and where it could break.
Core claim
Using the FLARES simulations post-processed with the SKIRT radiative transfer code to generate surface brightness profiles, approximately 16.23 percent of galaxies above 10^9 solar masses at redshifts 5 to 10 exhibit spatial offsets of 2.5 kpc or greater between the peaks of their rest-frame 1500 Angstrom UV emission and 158 micron FIR emission. These offset galaxies preferentially show UV slopes between -2.5 and -1.5, form half their z=5 stellar mass about 0.1 Gyr earlier, and display higher stellar metallicities, indicating earlier enrichment and a shift toward outward growth at z greater than or equal to 6.
What carries the argument
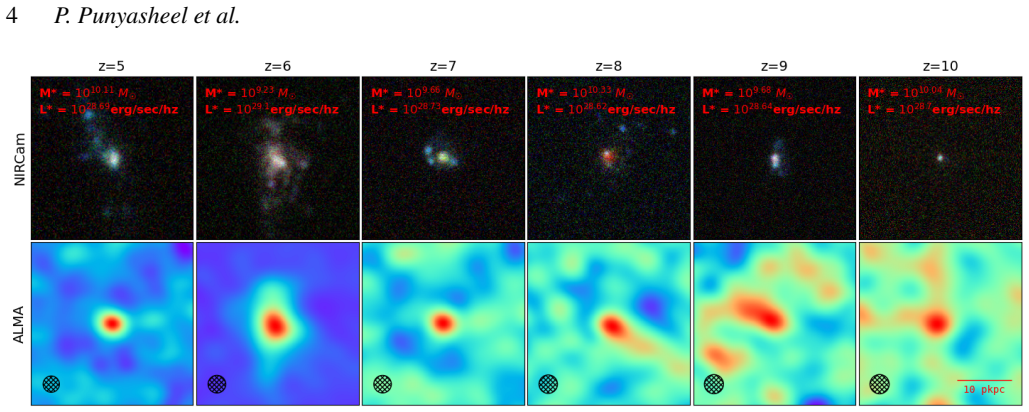
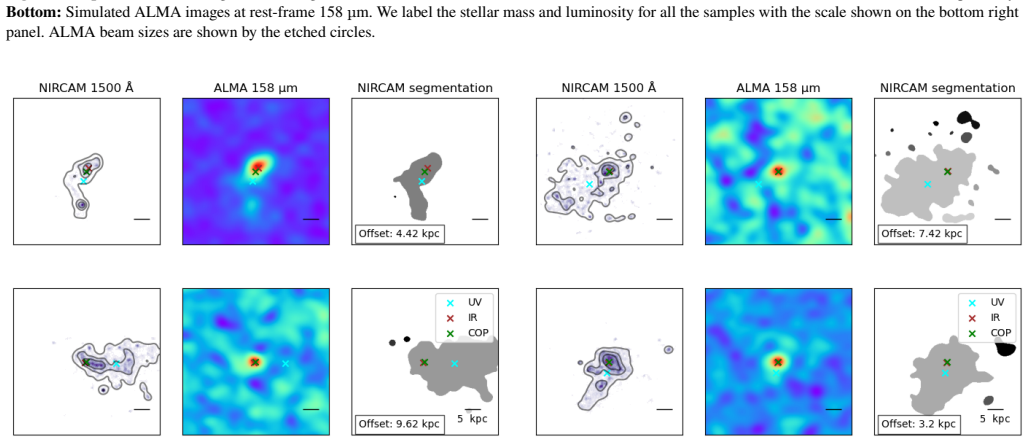
The measured distance between the peaks of simulated JWST NIRCam UV surface brightness at rest-frame 1500 Angstrom and ALMA FIR surface brightness at rest-frame 158 micron, derived from SKIRT post-processing of FLARES galaxies.
If this is right
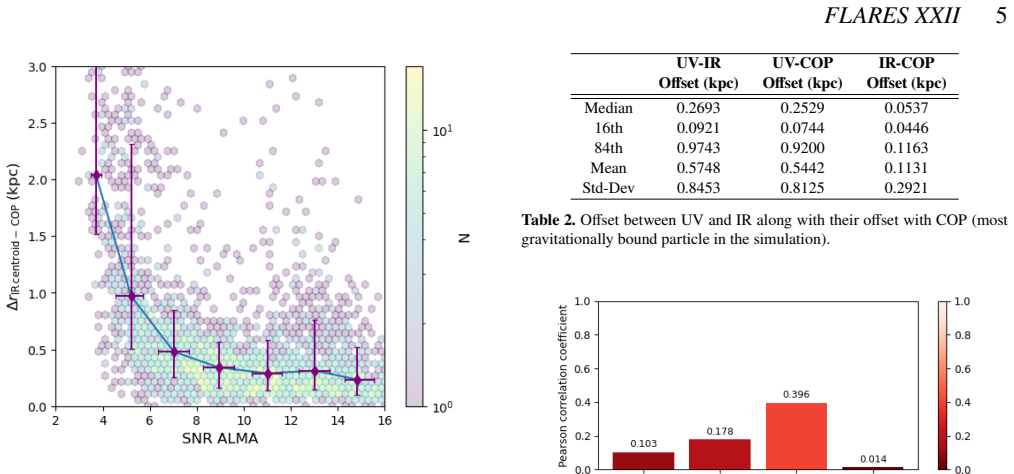
- The offsets show no correlation with stellar mass, UV or FIR luminosity, galaxy size, AGN feedback, large-scale environment, or merger history.
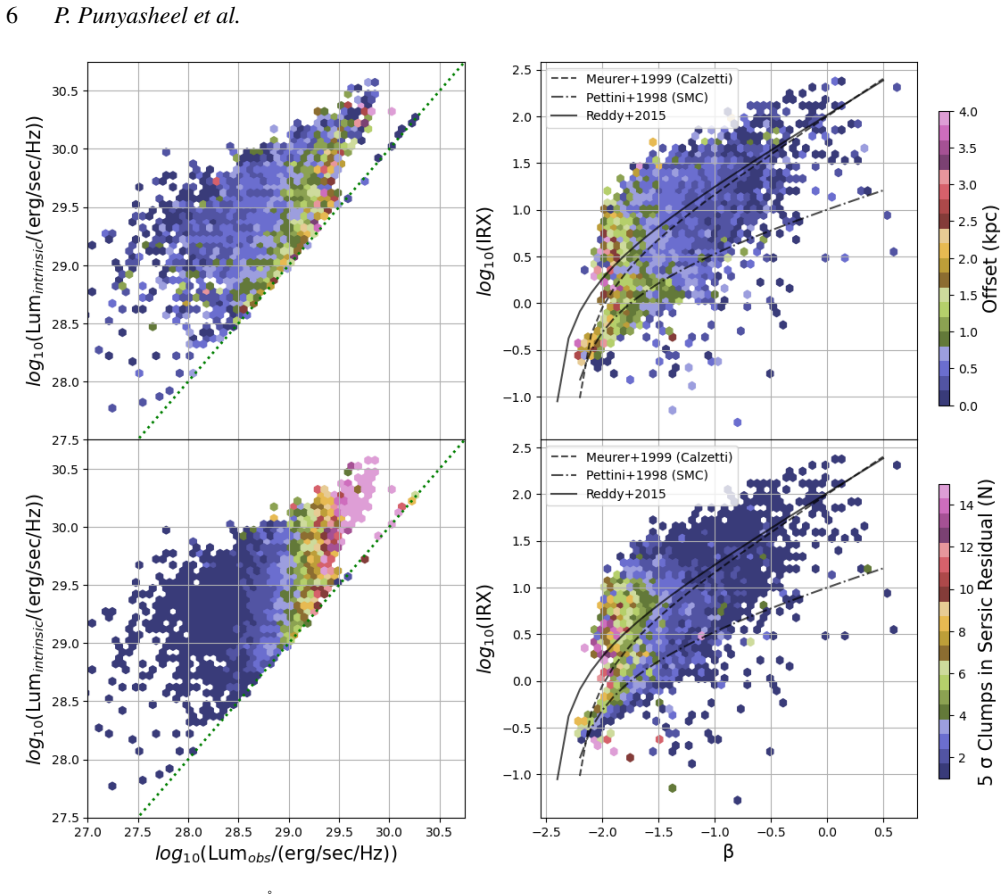
- Galaxies with offsets have bluer UV slopes linked to recent star formation and dust-obscured cores that shift the observed UV centroid outward.
- Offset galaxies follow an accelerated star formation history and reach higher metallicities earlier than non-offset galaxies.
- The combination of properties supports a transition to outward growth in these systems at redshifts of 6 and above.
Where Pith is reading between the lines
- If the simulated fraction holds in observations, targeted ALMA follow-up of blue UV-selected galaxies at high redshift could efficiently locate offset systems.
- The absence of links to mergers or environment implies that internal feedback and star-formation timing control the offsets more than external events.
- Confirmation would strengthen models in which early massive galaxies build central stellar mass first, then extend outward as dust and metals redistribute.
Load-bearing premise
The SKIRT radiative transfer calculations on the FLARES galaxies produce surface brightness profiles that correctly locate the true peaks of UV and FIR emission at the simulated resolutions and dust properties.
What would settle it
Deep JWST NIRCam and ALMA observations of a large sample of real galaxies at z=5-10 that find a fraction of UV-FIR offsets above 2.5 kpc significantly different from 16 percent would challenge the result.
Figures


read the original abstract
Recent observations have revealed intriguing offsets between the UV and FIR emission in high redshift galaxies. In this study, we use the First Light And Reionisation Epoch Simulations (\textsc{Flares}) to compute the spatial offset of ultraviolet (UV) and far-infrared (FIR) centres for a statistical sample (6890) of massive (M$_{\star}\, \gtrsim10^{9} \,{\rm M_{\odot}}$) high redshift galaxies ($z \in [5,10]$). The galaxies are post-processed with the \textsc{skirt} radiative transfer code, to obtain the full spectral energy distribution and surface brightness profile. We simulate \textit{James Webb Space Telescope (JWST)} Near Infrared Camera (NIRCam; rest-frame 1500 \AA , $ \approx 0.031 ''$ resolution) and ALMA rest-frame 158 \um\ ($\approx$ $0.3''$ angular resolution) observations of the galaxies and then calculate the distance between the UV-FIR centres to analyse which physical processes drive the observed UV - FIR spatial offset. We find that $\sim16.23\%$ of galaxies exhibit spatial offsets of $\geq 2.5$ kpc between their UV and FIR emission peaks. We establish that the spatial offsets do not correlate with stellar mass, UV/FIR luminosity, and size. Offsets also do not correlate with AGN feedback or with large-scale environment or merger history. Galaxies with significant offsets preferentially have bluer UV slopes ($-2.5<\beta<-1.5$), consistent with recent star formation and dust-attenuated cores displacing the observed UV centroid. They show an accelerated star formation history, forming half their $z=5$ stellar mass $\sim$0.1 Gyr earlier than galaxies without offsets. These galaxies are enriched earlier than galaxies without an offset and show enhanced stellar metallicities, indicating a transition to an outward growth at higher redshifts ($z \geq 6$).
Editorial analysis
A structured set of objections, weighed in public.
Referee Report
Summary. The manuscript analyzes 6890 massive (M⋆ ≳ 10^9 M⊙) galaxies at z ∈ [5,10] from the FLARES simulations, post-processed with SKIRT to produce mock JWST NIRCam (rest-UV, ~0.031″) and ALMA (rest-FIR 158 μm, ~0.3″) surface-brightness maps. It reports that ~16.23% of the sample shows UV-FIR peak offsets ≥2.5 kpc and that these offset galaxies preferentially exhibit bluer UV slopes (−2.5 < β < −1.5), accelerated star-formation histories, and earlier enrichment, while showing no correlation with stellar mass, UV/FIR luminosity, size, AGN feedback, environment, or merger history.
Significance. If robust, the result supplies a statistically large theoretical sample that links observed high-z UV-FIR offsets to concrete physical processes (recent star formation displacing the UV centroid relative to a dust-attenuated core). The absence of correlations with mass, luminosity, or environment is a useful negative finding that narrows the plausible drivers.
major comments (1)
- [Methods (SKIRT post-processing and surface-brightness analysis)] The central 16.23% offset fraction and all reported correlations rest on the fidelity of the SKIRT-generated UV and FIR surface-brightness profiles. The manuscript provides no resolution-convergence tests, no direct comparison of SKIRT peaks to the underlying FLARES dust-particle distribution, and no sensitivity analysis to dust-to-metal ratio or grain properties. Given the factor-of-ten difference in angular resolution between the NIRCam and ALMA mocks, even modest mismatches in dust geometry can displace the FIR peak by amounts comparable to the 2.5 kpc threshold.
minor comments (1)
- [Abstract and Results] The quoted offset fraction is given to two decimal places (16.23%); the text should state how the 2.5 kpc threshold and peak-centroiding algorithm were chosen and whether the fraction changes under reasonable variations of those choices.
Simulated Author's Rebuttal
We thank the referee for their constructive and detailed review. We address the single major comment below and will revise the manuscript to incorporate the requested robustness checks.
read point-by-point responses
-
Referee: [Methods (SKIRT post-processing and surface-brightness analysis)] The central 16.23% offset fraction and all reported correlations rest on the fidelity of the SKIRT-generated UV and FIR surface-brightness profiles. The manuscript provides no resolution-convergence tests, no direct comparison of SKIRT peaks to the underlying FLARES dust-particle distribution, and no sensitivity analysis to dust-to-metal ratio or grain properties. Given the factor-of-ten difference in angular resolution between the NIRCam and ALMA mocks, even modest mismatches in dust geometry can displace the FIR peak by amounts comparable to the 2.5 kpc threshold.
Authors: We agree that explicit validation of the SKIRT post-processing is necessary to support the robustness of the reported offset statistics. In the revised manuscript we will add a dedicated subsection to the Methods that includes: (i) resolution-convergence tests performed by re-running SKIRT at multiple grid resolutions and confirming that the UV-FIR peak offsets remain stable above the 2.5 kpc threshold; (ii) a direct comparison between the SKIRT-derived surface-brightness peaks and the underlying FLARES dust-particle and stellar distributions; and (iii) a sensitivity analysis in which the dust-to-metal ratio and grain-size distribution are varied within observationally motivated ranges, demonstrating that the 16.23 % offset fraction and the reported correlations with UV slope and star-formation history are insensitive to these choices. We will also clarify that the 2.5 kpc threshold was selected to exceed the ALMA beam size at the redshifts of interest. These additions will be presented without altering the scientific conclusions of the original analysis. revision: yes
Circularity Check
No significant circularity; results are direct simulation outputs
full rationale
The paper computes UV-FIR spatial offsets by post-processing FLARES galaxies with SKIRT to generate surface brightness profiles at NIRCam and ALMA resolutions, then measures peak separations and correlations directly from the resulting maps for the 6890-galaxy sample. No equation or quantity is defined in terms of the reported 16.23% fraction or the β/SFH correlations; those statistics are downstream measurements, not inputs. Prior FLARES self-citations supply the hydrodynamical initial conditions and are not invoked as uniqueness theorems or ansatzes that force the offset results. The derivation chain therefore remains self-contained against external benchmarks.
Axiom & Free-Parameter Ledger
Reference graph
Works this paper leans on
-
[1]
Algera H. S. B., et al., 2023, MNRAS, 518, 6142 Astropy Collaboration et al., 2013, A&A, 558, A33 Astropy Collaboration et al., 2018, AJ, 156, 123 Astropy Collaboration et al., 2022, ApJ, 935, 167 Bakx T. J. L. C., et al., 2025, MNRAS, 544, 1502 Barnes D. J., et al., 2017, MNRAS, 471, 1088 Béthermin M., et al., 2020, A&A, 643, A2 Bing L., et al., 2025, ar...
work page internal anchor Pith review Pith/arXiv arXiv doi:10.5281/zenodo.7946442 2023
discussion (0)
Sign in with ORCID, Apple, or X to comment. Anyone can read and Pith papers without signing in.