Thermodynamic stability and structural transitions in virus-host networks
Pith reviewed 2026-06-26 10:55 UTC · model grok-4.3
The pith
Thermodynamic quantities from adjacency spectra show transition-like behavior in virus-host networks under node removal.
A machine-rendered reading of the paper's core claim, the machinery that carries it, and where it could break.
Core claim
The study computes topological characteristics and thermodynamic quantities from the adjacency spectra of directed and weighted virus-host networks for Homo sapiens, Mus musculus, and Gallus gallus. Under targeted elimination of the most influential nodes and under random removal, the networks display transition-like behavior in the spectral thermodynamic functions accompanied by characteristic changes in structural measures. These observations are presented as evidence that a thermodynamic framework can be used to assess structural robustness and dynamic behavior in virus-host networks.
What carries the argument
Spectral thermodynamic functions obtained from the eigenvalues of the adjacency matrices of the virus-host networks, which track stability changes during node removal.
If this is right
- Targeted removal of high-influence nodes produces more pronounced transition-like changes than random removal.
- The networks possess identifiable thresholds at which thermodynamic measures shift abruptly.
- Spectral thermodynamics and conventional topological statistics together give a more complete description of network response to attack.
- The same quantities can be compared across host species to reveal organism-specific stability patterns.
Where Pith is reading between the lines
- The method could be applied to other directed biological networks such as gene-regulation or metabolic graphs to test for analogous transition points.
- If the observed transitions align with real biological outcomes, they might mark critical points where virus spread accelerates or host defenses collapse.
- Time-dependent versions of the same spectral analysis might track how virus-host networks evolve during an actual infection.
Load-bearing premise
Thermodynamic quantities derived from the adjacency spectra of virus-host networks can be used to assess their structural robustness and dynamic behavior under node removal.
What would settle it
Explicit computation on the same networks showing smooth, non-transition behavior in all spectral thermodynamic functions across the full range of targeted and random node removals would falsify the reported observation.
Figures


read the original abstract
Understanding virus-host interactions is crucial for predicting the stability of networks under various perturbations. In this study, we present an analysis of virus-related networks for several organisms (Homo sapiens, Mus musculus, Gallus gallus), encompassing directed and weighted connections. We compute a range of network parameters, including topological characteristics and thermodynamic quantities derived from adjacency spectra, to gain insights into the structural robustness and dynamic behavior of the networks. To assess stability, we model two distinct node removal scenarios: targeted elimination of the most influential nodes and random removal. Our findings reveal transition-like behavior in spectral thermodynamic functions and characteristic changes in structural measures, contributing to evaluating the potential of a thermodynamic framework for studying virus-host networks and advancing a deeper understanding of their dynamics.
Editorial analysis
A structured set of objections, weighed in public.
Referee Report
Summary. The manuscript analyzes directed and weighted virus-host interaction networks for Homo sapiens, Mus musculus, and Gallus gallus. It computes standard topological measures together with thermodynamic quantities (free energy, entropy, specific heat) derived from the adjacency spectra, then examines their behavior under targeted removal of high-influence nodes versus random removal, reporting transition-like features in the spectral thermodynamic functions.
Significance. If the spectral-to-thermodynamic mapping can be placed on a mathematically consistent footing for non-symmetric matrices, the approach would supply a compact, eigenvalue-based diagnostic for robustness in biological bipartite networks. The work is exploratory rather than definitive; its main value lies in the concrete application to three real virus-host datasets and the side-by-side comparison of targeted versus random attack.
major comments (1)
- [Abstract and §3] Abstract and §3 (method): the networks are explicitly described as directed and weighted, yet the thermodynamic functions are stated to be obtained directly from the adjacency spectra. Standard derivations of partition functions and specific heat presuppose a real symmetric matrix with real eigenvalues; for directed graphs the spectrum is complex. No regularization (Hermitian symmetrization, real-part projection, or absolute-value weighting) is indicated, rendering the reported transition-like behavior dependent on an unstated technical step that is load-bearing for the central claim.
minor comments (2)
- Figure captions and axis labels should explicitly state whether the plotted thermodynamic quantities are computed from the full complex spectrum or from a symmetrized version.
- The manuscript would benefit from a short table listing the precise definitions (partition function Z, free energy F, entropy S, specific heat C) together with the numerical procedure used to extract them from the eigenvalue list.
Simulated Author's Rebuttal
We thank the referee for the careful reading and for identifying a methodological detail that requires explicit clarification. The point concerning the treatment of complex spectra from directed adjacency matrices is substantive and we address it directly below.
read point-by-point responses
-
Referee: [Abstract and §3] Abstract and §3 (method): the networks are explicitly described as directed and weighted, yet the thermodynamic functions are stated to be obtained directly from the adjacency spectra. Standard derivations of partition functions and specific heat presuppose a real symmetric matrix with real eigenvalues; for directed graphs the spectrum is complex. No regularization (Hermitian symmetrization, real-part projection, or absolute-value weighting) is indicated, rendering the reported transition-like behavior dependent on an unstated technical step that is load-bearing for the central claim.
Authors: We agree that the manuscript does not currently indicate the regularization step applied to the complex eigenvalues. In the underlying computations the partition function and the derived thermodynamic quantities (entropy, specific heat) were obtained after projecting onto the real parts of the eigenvalues; this produces real-valued thermodynamic functions while retaining the spectral information contributed by the directed edges. The choice is standard for non-Hermitian network spectra when a thermodynamic analogy is sought, yet it was omitted from the description in §3. We will revise the methods section to state the real-part projection explicitly, supply a short justification, and note that the same procedure was used uniformly for all three host networks. The reported transition-like features remain unchanged by this clarification. revision: yes
Circularity Check
No circularity: spectral thermodynamics applied independently to given adjacency matrices
full rationale
The derivation computes standard network measures plus thermodynamic functions from the eigenvalues of the supplied directed weighted adjacency matrices, then tracks their evolution under two explicit node-removal protocols. No equation reduces to a prior fit or self-citation by construction; the spectra are taken as input data and the thermodynamic mapping is a fixed functional of those eigenvalues. The reported transition-like behavior is therefore an empirical observation on the given networks rather than a definitional tautology.
Axiom & Free-Parameter Ledger
Reference graph
Works this paper leans on
-
[1]
Fu F., Rosenbloom D. I., Wang L., Nowak M. A., Proc. R. Soc. B, 2011,278, No. 1702, 42–49, doi:10.1098/rspb.2010.1107
-
[2]
Damas J., Hughes G. M., Keough K. C., Painter C. A., Persky N. S., Corbo M., Hiller M., Koepfli K., PfenningA.R.,ZhaoH.,GenereuxD.P.,SwoffordR.,PollardK.S.,RyderO.A.,NweeiaM.T.,Lindblad-TohK., Teeling E. C., Karlsson E. K., Lewin H. A., Proc. Natl. Acad. Sci. U.S.A., 2020,117, No. 36, 22311–22322, doi:10.1073/pnas.2010146117
-
[3]
Gulbahce N., Yan H., Dricot A., Padi M., Byrdsong D., Franchi R., Lee D.-S., Rozenblatt-Rosen O., Mar J. C., Calderwood M. A., et al., PLoS Comput. Biol., 2012,8, No. 6, e1002531, doi:10.1371/journal.pcbi.1002531
-
[4]
E., Barabási A.-L., Cell, 2011,144, No
Vidal M., Cusick M. E., Barabási A.-L., Cell, 2011,144, No. 6, 986–998, doi:10.1016/j.cell.2011.02.016
-
[5]
D1, D583–D587, doi:10.1093/nar/gku1121
Guirimand T., Delmotte S., Navratil V., Nucleic Acids Res., 2015,43, No. D1, D583–D587, doi:10.1093/nar/gku1121
-
[6]
Krishna S. A. V. S., Sinha S., Donakonda S., Comput. Struct. Biotechnol. J., 2022,20, 4025–4039, doi:10.1016/j.csbj.2022.07.040
-
[7]
Bösl K., Ianevski A., Than T. T., Andersen P. I., Kuivanen S., Teppor M., Zusinaite E., Dumpis U., Vitkauskiene A., Cox R. J., et al., Front. Immunol., 2019,10, 2186, doi:10.3389/fimmu.2019.02186
-
[8]
Fendt S.-M., Ralser M., Curr. Opin. Syst. Biol., 2022,31, 100432, doi:10.1016/j.coisb.2022.100432. 23801-17 A. Rovenchak, M. Husiev
-
[9]
LassoG.,MayerS.V.,WinkelmannE.R.,ChuT.,ElliotO.,Patino-GalindoJ.A.,ParkK.,RabadanR.,HonigB., Shapira S. D., Cell, 2019,178, No. 6, 1526–1541, doi:10.1016/j.cell.2019.08.005
-
[10]
ZhouY.,HouY.,ShenJ.,HuangY.,MartinW.,ChengF.,CellDiscovery,2020,6,No.1,14,doi:10.1038/s41421- 020-0153-3
-
[11]
Sarkanych P., Sevinchan Yu., Krasnytska M., Romanczuk P., Holovatch Yu., Condens. Matter Phys., 2024,27, No. 3, 33801, doi:10.5488/cmp.27.33801
-
[12]
Sarkanych P., Holovatch Yu., Kenna R., Mac Carron P., J. Phys. Stud., 2016,20, No. 4, 4801, doi:10.30970/jps.20.4801
-
[13]
Holovatch Yu., Dudka M., Blavatska V., Palchykov V., Krasnytska M., Mryglod O., J. Phys. Stud., 2018,22, No. 2, 2801, doi:10.30970/jps.22.2801
-
[14]
ViRBase v3.0, ViRBase v3.0: Virus-Host ncRNA Interaction Database, 2021, [Online; accessed 22-Jun-2025], URL https://www.rna-society.org/virbase/
2021
-
[15]
D1, D578–D582, doi:10.1093/nar/gku903
LiY.,WangC.,MiaoZ.,BiX.,WuD.,JinN.,WangL.,WuH.,QianK.,LiC.,etal.,NucleicAcidsRes.,2015, 43, No. D1, D578–D582, doi:10.1093/nar/gku903
-
[16]
D1, D928–D933, doi:10.1093/nar/gkab1029
Cheng J., Lin Y., Xu L., Chen K., Li Q., Xu K., Ning L., Kang J., Cui T., Huang Y., Zhao X., Wang D., Li Y., Su X., Yang B., Nucleic Acids Res., 2022,50, No. D1, D928–D933, doi:10.1093/nar/gkab1029
-
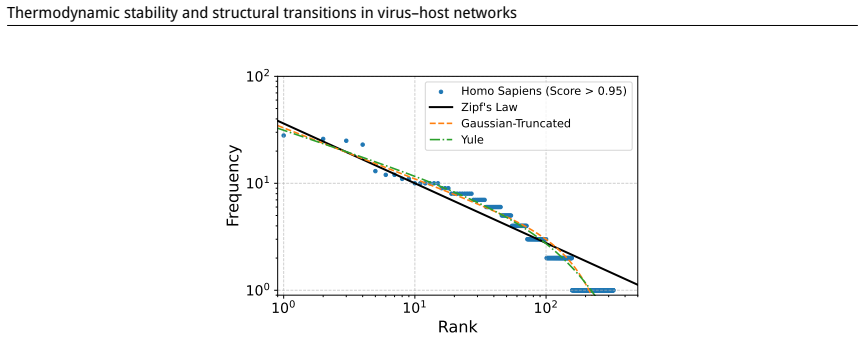
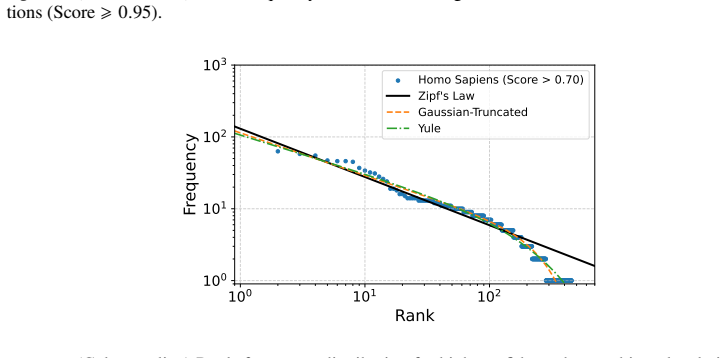
[17]
Zipf G. K., The Psycho-Biology of Language: An Introduction to Dynamic Philology, Routledge, 2013, doi:10.4324/9781315009421
-
[18]
R., Stevens R., Brass A., BMC Bioinf., 2012,13, 127, doi:10.1186/1471-2105-13-127
Kalankesh L. R., Stevens R., Brass A., BMC Bioinf., 2012,13, 127, doi:10.1186/1471-2105-13-127
-
[19]
Rovenchak A., Mod. Phys. Lett. B, 2018,32, No. 05, 1850057, doi:10.1142/S0217984918500574
-
[20]
Semple S., Ferrer-i-Cancho R., Gustison M. L., Trends Ecol. Evol., 2022,37, No. 1, 53–66, doi:10.1016/j.tree.2021.08.012
-
[21]
Laherrère J., Sornette D., Eur. Phys. J. B, 1998,2, No. 4, 525–539, doi:10.1007/s100510050276
-
[22]
Rovenchak A., Riley C., Sherman T., J. Quant. Linguist., 2017,25, No. 3, 271–287, doi:10.1080/09296174.2017.1373510
-
[23]
Ferrer-i-Cancho R., Solé R. V., J. Quant. Linguist., 2001,8, No. 3, 165–173, doi:10.1076/jqul.8.3.165.4101
-
[24]
BukS.N.,RovenchakA.A.,J.Quant.Linguist.,2004,11,No.3,161–171,doi:10.1080/0929617042000314912
-
[25]
Piantadosi S. T., Psychon. Bull. Rev., 2014,21, No. 5, 1112–1130, doi:10.3758/s13423-014-0585-6
-
[26]
HolovatchYu.,PalchykovV.,In:MathsMeetsMyths:QuantitativeApproachestoAncientNarratives,KennaR., MacCarronM.,MacCarronP.(Eds.),SpringerInternationalPublishing,Cham,2016,159–175,doi:10.1007/978- 3-319-39445-9_9
-
[27]
Rovenchak A., Buk S., J. Quant. Linguist., 2018,25, No. 1, 1–21, doi:10.1080/09296174.2017.1324601
-
[28]
Simon H. A., Biometrika, 1955,42, No. 3/4, 425–440, doi:10.2307/2333389
-
[29]
Newman M. E. J., Contemp. Phys., 2005,46, No. 5, 323–351, doi:10.1080/00107510500052444
-
[30]
miRBase, miRBase: the microRNA database, [Online; accessed 22-Jun-2025], URL https://mirbase.org/
2025
-
[31]
Pettersen E. F., Goddard T. D., Huang C. C., Couch G. S., Greenblatt D. M., Meng E. C., Ferrin T. E., J. Comput. Chem., 2004,25, No. 13, 1605–1612, doi:10.1002/jcc.20084
-
[32]
Estrada E., The Structure of Complex Networks: Theory and Applications, Oxford Academic Press, 2011, doi:10.1093/acprof:oso/9780199591756.001.0001
work page doi:10.1093/acprof:oso/9780199591756.001.0001 2011
-
[33]
Bianconi G., Phys. Rev. E, 2009,79, No. 3, 036114, doi:10.1103/physreve.79.036114
-
[34]
Callaway D. S., Newman M. E. J., Strogatz S. H., Watts D. J., Phys. Rev. Lett., 2000,85, No. 25, 5468, doi:10.1103/PhysRevLett.85.5468
-
[35]
6794, 378–382, doi:10.1038/35019019
Albert R., Jeong H., Barabási A.-L., Nature, 2000,406, No. 6794, 378–382, doi:10.1038/35019019
-
[36]
Barrat A., Barthelemy M., Vespignani A., Dynamical Processes on Complex Networks, Cambridge University Press, 2008, doi:10.1017/CBO9780511791383
-
[37]
Castellano C., Fortunato S., Loreto V., Rev. Mod. Phys., 2009,81, No. 2, 591–646, doi:10.1103/RevModPhys.81.591
-
[38]
Estrada E., Hatano N., Chem. Phys. Lett., 2007,439, No. 1–3, 247–251, doi:10.1016/j.cplett.2007.03.098
-
[39]
Estrada E., Hatano N., Benzi M., Phys. Rep., 2012,514, No. 3, 89–119, doi:10.1016/j.physrep.2012.01.006
-
[40]
Jurčišinová E., Jurčišin M., Phys. Rev. E, 2018,97, No. 5, 052129, doi:10.1103/PhysRevE.97.052129
-
[41]
Luo Q., Hu S., Kee H.-Y., Phys. Rev. Res., 2021,3, 033048, doi:10.1103/PhysRevResearch.3.033048
-
[42]
Karlova K., Rufino A., Verkholyak T., Caci N., Wessel S., Strečka J., Mila F., Honecker A., Preprint arXiv:2601.14382, 2026. 23801-18 Thermodynamic stability and structural transitions in virus–host networks Термодинамiчна стабiльнiсть та структурнi переходи в мережах вiрус–господар А. Ровенчак1,2, М. Гусєв1 1 Кафедра теоретичної фiзики iменi професора Iв...
arXiv 2026
discussion (0)
Sign in with ORCID, Apple, or X to comment. Anyone can read and Pith papers without signing in.