Adapting CCDF Plots for Visualizing Ordinal Regression Results
Pith reviewed 2026-07-03 07:06 UTC · model grok-4.3
The pith
Modified CCDF plots let researchers visualize cumulative-link ordinal regression results while showing the same takeaways as metric analyses of ordinal data.
A machine-rendered reading of the paper's core claim, the machinery that carries it, and where it could break.
Core claim
Cumulative-link ordinal regression models provide an alternative to linear models for ordinal data with less stringent assumptions, yet their limited adoption stems from challenges in visually representing results. Modified CCDF plots solve this by enabling visualization of model outputs that communicate equivalent key takeaways to those from analyses treating ordinal data as metric.
What carries the argument
The modified Complementary Cumulative Distribution Function (mCCDF) plot, which adapts standard CCDFs to display cumulative probabilities from cumulative-link ordinal regression models.
If this is right
- Researchers gain a visual method to report ordinal regression results that respects the ordered categories.
- The same substantive conclusions presented from metric treatments of Likert data can be shown using ordinal models.
- Adoption of cumulative-link models becomes feasible in visualization and HCI without specialized plotting expertise.
- Visual communication of model results no longer requires treating ordinal data as continuous.
Where Pith is reading between the lines
- The approach could be tested on ordinal outcomes beyond Likert scales, such as ranked preferences or severity ratings.
- Direct user studies comparing interpretation accuracy of mCCDFs versus traditional plots would clarify practical advantages.
- Similar plot adaptations might apply to other regression families where visualization currently lags behind model sophistication.
Load-bearing premise
That mCCDF plots will accurately and intuitively convey the model outputs without introducing visual misinterpretations or losing critical information from the ordinal regression.
What would settle it
A controlled viewing study in which participants draw different or incorrect conclusions about effect sizes and group differences from mCCDF plots compared with standard metric visualizations of the same data.
Figures
read the original abstract
Cumulative-link ordinal regression models are an alternative approach for analysing ordinal data such as Likert items, which are widely used in Visualization (and other related fields like HCI, psychology etc.). There are many researchers who are strong proponents of this approach, as it makes less stringent assumptions about the data, compared to the more commonly used linear model or ANOVA. Yet, ordinal regression models have seen limited adoption. I posit that one possible reason for this might be due to the difficulty in visually representing the results from such models, and in communicating the key takeaways in an intuitive manner. I propose the use of (modified) Complementary Cumulative Distribution Function (mCCDF) plots to visualize the results of ordinal regression models, and demonstrate how the same takeaways that researchers present from analyses which treat ordinal data as metric can be easily communicated using mCCDFs.
Editorial analysis
A structured set of objections, weighed in public.
Referee Report
Summary. The manuscript proposes the use of modified Complementary Cumulative Distribution Function (mCCDF) plots to visualize results from cumulative-link ordinal regression models applied to ordinal data such as Likert items. It posits that visualization difficulty has limited adoption of these models despite their less stringent assumptions compared to linear models or ANOVA, and claims that mCCDF plots enable communication of the same key interpretive takeaways as analyses treating ordinal data as metric.
Significance. If validated, the proposal could meaningfully support wider use of ordinal regression in HCI, visualization, and psychology by providing an intuitive visual bridge to existing metric-style interpretations. The approach aligns with prior uses of cumulative distributions for ordinal data and avoids internal inconsistencies in the stated motivation.
major comments (2)
- [Abstract] Abstract: the claim that mCCDF plots 'can easily communicate' the same takeaways as metric analyses is presented without any empirical demonstration, example output, validation data, or comparison to existing visualizations, leaving the central effectiveness claim untested.
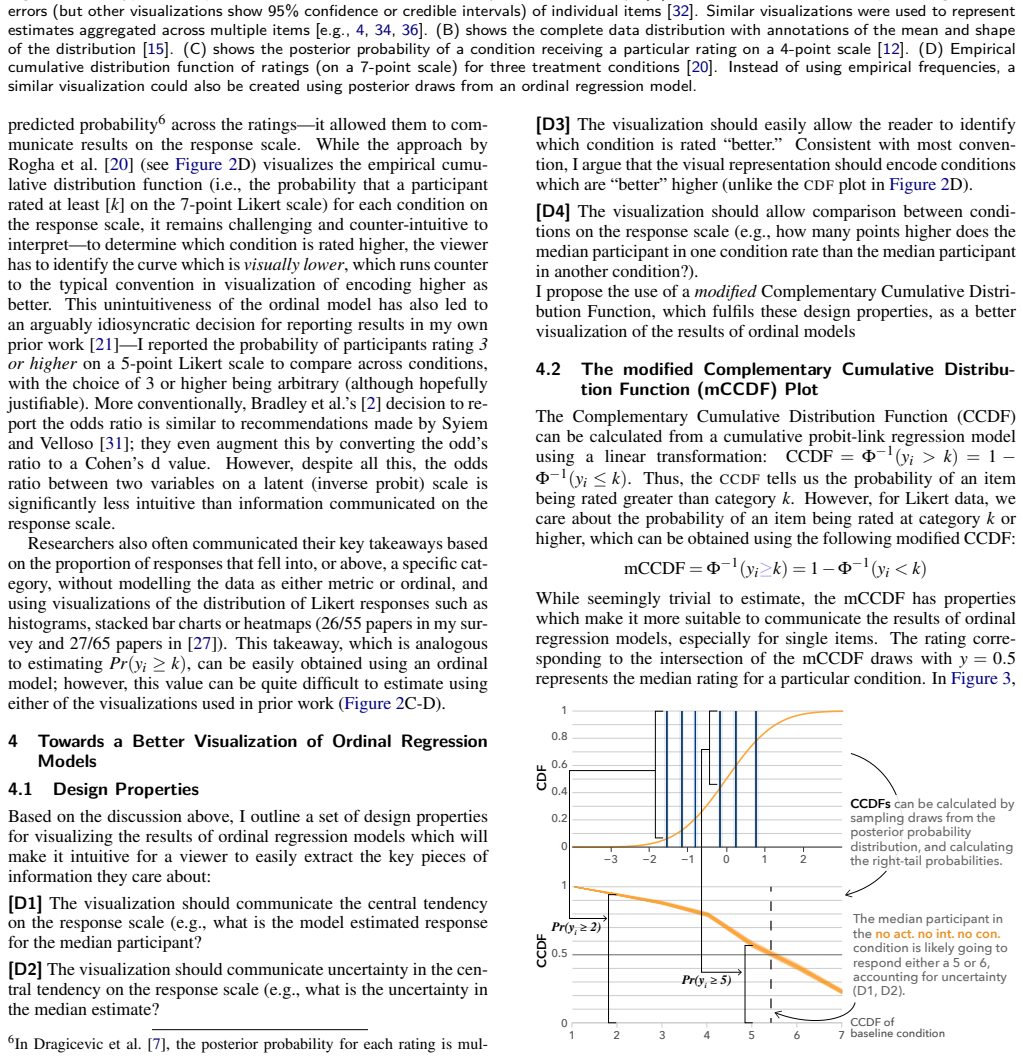
- [Abstract] Abstract: no construction details, equations, or parameter mappings are supplied for how mCCDF plots are derived from cumulative-link model outputs (e.g., thresholds or link-function probabilities), preventing assessment of whether the visualization preserves ordinal information or risks misinterpretation.
minor comments (1)
- The manuscript would benefit from explicit examples or pseudocode showing mCCDF construction from model coefficients.
Simulated Author's Rebuttal
We thank the referee for their review and for identifying areas where the abstract could more clearly signal the manuscript's content. We respond to each major comment below.
read point-by-point responses
-
Referee: [Abstract] Abstract: the claim that mCCDF plots 'can easily communicate' the same takeaways as metric analyses is presented without any empirical demonstration, example output, validation data, or comparison to existing visualizations, leaving the central effectiveness claim untested.
Authors: The abstract summarizes the contribution concisely. The full manuscript contains multiple worked examples applying mCCDF plots to cumulative-link model outputs on Likert data, directly showing how the same takeaways (e.g., group differences, effect directions) are conveyed as in metric analyses. These examples constitute the demonstration referenced in the abstract. The paper does not include a formal user study or quantitative validation of interpretability, as its scope is the proposal and illustration of the method rather than an empirical evaluation of visualization effectiveness. We can revise the abstract to explicitly reference the examples provided in the body. revision: partial
-
Referee: [Abstract] Abstract: no construction details, equations, or parameter mappings are supplied for how mCCDF plots are derived from cumulative-link model outputs (e.g., thresholds or link-function probabilities), preventing assessment of whether the visualization preserves ordinal information or risks misinterpretation.
Authors: Abstracts are space-constrained and focus on motivation and contribution. The manuscript body supplies the construction details, including the mapping from cumulative-link model thresholds and link-function probabilities to the mCCDF curves, with explicit equations that ensure the plots are derived directly from the ordinal model's cumulative probabilities. This derivation is designed to preserve ordinal information. We can add a short clause to the abstract noting that the plots are constructed from the model's cumulative probabilities. revision: partial
Circularity Check
No significant circularity; proposal is self-contained
full rationale
The paper is a methodological proposal for adapting mCCDF plots to visualize cumulative-link ordinal regression outputs. No derivation chain, equations, parameter fitting, or predictions are present that could reduce to inputs by construction. No self-citations, uniqueness theorems, or ansatzes are invoked to support the central claim. The suggestion that mCCDF plots communicate the same takeaways as metric analyses is presented directly as a visualization technique without any load-bearing reductions to fitted quantities or prior author work.
Axiom & Free-Parameter Ledger
Reference graph
Works this paper leans on
-
[1]
D. Bates, M. Mächler, B. Bolker, and S. Walker. Fitting Linear Mixed- Effects Models Using lme4. Journal of Statistical Software , 67:1–48, Oct. 2015. doi: 10.18637/jss.v067.i01 6
-
[2]
D. Bradley, G. Strain, C. Jay, and A. J. Stewart. Magnitude Judge- ments are Influenced by the Relative Positions of Data Points Within Axis Limits. IEEE Transactions on Visualization and Computer Graphics, 31(2):1414–1421, Feb. 2025. doi: 10.1109/TVCG.2024. 3364069 2, 3
-
[3]
P .-C. Bürkner and M. Vuorre. Ordinal Regression Models in Psychol- ogy: A Tutorial. Advances in Methods and Practices in Psychological Science, 2(1):77–101, Mar. 2019. doi: 10.1177/2515245918823199 2
-
[4]
A.-F. Cabouat, T. He, P . Isenberg, and T. Isenberg. PREVis: Perceived Readability Evaluation for Visualizations. IEEE Transactions on Visu- alization and Computer Graphics , 31(1):1083–1093, Jan. 2025. doi: 10.1109/TVCG.2024.3456318 2, 3, 4
-
[5]
J. Carifio and R. J. Perla. Ten Common Misunderstandings, Miscon- ceptions, Persistent Myths and Urban Legends about Likert Scales and Likert Response Formats and their Antidotes. Journal of Social Sci- ences, 3(3):106–116, Mar. 2007. doi: 10.3844/jssp.2007.106.116 2
-
[6]
F. Cushman, L. Y oung, and M. Hauser. The Role of Conscious Rea- soning and Intuition in Moral Judgment: Testing Three Principles of Harm. Psychological Science, 17(12):1082–1089, Dec. 2006. doi: 10 .1111/j.1467-9280.2006.01834.x 1, 6
-
[7]
P . Dragicevic, Y . Jansen, A. Sarma, M. Kay, and F. Chevalier. Increas- ing the Transparency of Research Papers with Explorable Multiverse Analyses. In Proceedings of the 2019 CHI Conference on Human Factors in Computing Systems , pp. 1–15. ACM, Glasgow Scotland Uk, May 2019. doi: 10.1145/3290605.3300295 2, 3, 4
-
[8]
Gabry, R
J. Gabry, R. ˇCešnovar, A. Johnson, and S. Bronder. Cmdstanr: R Interface to ’CmdStan’, 2025. 6
2025
-
[9]
L. W. Ge, Y . Cui, and M. Kay. Calvi: Critical thinking assessment for literacy in visualizations. In Proceedings of the 2023 CHI Confer- ence on Human Factors in Computing Systems , CHI ’23. Association for Computing Machinery, New Y ork, NY , USA, 2023. doi: 10.1145/ 3544548.3581406 4
-
[10]
G. Gigerenzer. Mindless statistics. The Journal of Socio-Economics , 33(5):587–606, Nov. 2004. doi: 10.1016/j.socec.2004.09.033 2
-
[11]
G. Gigerenzer. Statistical Rituals: The Replication Delusion and How We Got There. Advances in Methods and Practices in Psychological Science, 1(2):198–218, June 2018. doi: 10.1177/2515245918771329 2
-
[12]
J. Helske, S. Helske, M. Cooper, A. Ynnerman, and L. Besançon. Can Visualization Alleviate Dichotomous Thinking? Effects of Visual Representations on the Cliff Effect. IEEE Transactions on Visualiza- tion and Computer Graphics , 27(8):3397–3409, Aug. 2021. doi: 10. 1109/TVCG.2021.3073466 2, 3
-
[13]
T. M. Liddell and J. K. Kruschke. Analyzing ordinal data with metric models: What could possibly go wrong? Journal of Experimental Social Psychology, 79:328–348, Nov. 2018. doi: 10.1016/j.jesp.2018 .08.009 1, 4
-
[14]
R. Likert. A technique for the measurement of attitudes. Archives of Psychology, 22 140:55–55, 1932. 2
1932
-
[15]
M. Lisnic, Z. Cutler, M. Kogan, and A. Lex. Visualization Guardrails: Designing Interventions Against Cherry-Picking in Interactive Data Explorers. In Proceedings of the 2025 CHI Conference on Human Factors in Computing Systems , pp. 1–19. ACM, Y okohama Japan, Apr. 2025. doi: 10.1145/3706598.3713385 2, 3
-
[16]
McElreath
R. McElreath. Statistical Rethinking: A Bayesian Course with Exam- ples in R and STAN . Chapman and Hall/CRC, New Y ork, 2 ed., Mar
-
[17]
doi: 10.1201/9780429029608 1, 6
-
[18]
K. A. Nadib, M. Kogan, A. Lex, and M. Lisnic. Guardrail Selection in Line Charts to Contextualize Persuasive Visualizations. Computer Graphics F orum, 2026. 2
2026
-
[19]
K. Nakano and T. Narumi. Avatars, Should We Look at Them Di- rectly or Through a Mirror?: Effects of Avatar Display Method on Sense of Embodiment and Gaze. IEEE Transactions on Visualization and Computer Graphics , 31(5):2912–2922, May 2025. doi: 10.1109/ TVCG.2025.3549545 2
-
[20]
Pinheiro, D
J. Pinheiro, D. Bates, S. DebRoy, D. Sarkar, S. Heisterkamp, B. V an Willigen, and R. Maintainer. nlme : Linear and nonlinear mixed effects models. r package version 3.1-103. http://cran.r- project.org/web/packages/nlme/index.html, 2017. 6
2017
-
[21]
M. Rogha, S. Sah, A. Karduni, D. Markant, and W. Dou. The Im- pact of Elicitation and Contrasting Narratives on Engagement, Recall and Attitude Change With News Articles Containing Data Visualiza- tion. IEEE Transactions on Visualization and Computer Graphics , 30(7):4375–4389, July 2024. doi: 10.1109/TVCG.2024.3355884 2, 3
-
[22]
A. Sarma, S. Guo, J. Hoffswell, R. Rossi, F. Du, E. Koh, and M. Kay. Evaluating the Use of Uncertainty Visualisations for Imputations of Data Missing At Random in Scatterplots. IEEE Transactions on Visu- alization and Computer Graphics , 29(1):602–612, Jan. 2023. doi: 10. 1109/TVCG.2022.3209348 2, 3
-
[23]
A. Sarma, M. Hedayati, and M. Kay. More Forecasts, More (Decision) Problems: How Uncertainty Representations for Multiple Forecasts Impact Decision Making. In Proceedings of the 2025 CHI Conference on Human Factors in Computing Systems, CHI ’25, pp. 1–14. Associ- ation for Computing Machinery, New Y ork, NY , USA, Apr. 2025. doi: 10.1145/3706598.3713725 4
-
[24]
A. Sarma, K. Hwang, J. Hullman, and M. Kay. Milliways: Taming multiverses through principled evaluation of data analysis paths. In Proceedings of the 2024 CHI Conference on Human Factors in Com- puting Systems, CHI ’24. Association for Computing Machinery, New Y ork, NY , USA, 2024. doi: 10.1145/3613904.3642375 4
-
[25]
A. Saske, L. Koesten, T. Möller, J. Staudner, and S. Kritzinger. A Multidimensional Assessment Method for Visualization Understand- ing (MdamV). IEEE Transactions on Visualization and Computer Graphics, 32(3):2695–2708, Mar. 2026. doi: 10.1109/TVCG.2026. 3653265 2
-
[26]
L. J. Savage. The F oundations of Statistics. Dover Publications, New Y ork, 2d rev. ed ed., 1972. 4
1972
-
[27]
H. Song, A. Cho, C. X. Bearfield, and J. Stasko. Visualizing Trust: How Chart Embellishments Influence Perceptions of Credi- bility. IEEE Transactions on Visualization and Computer Graphics , 32(1):1306–1316, Jan. 2026. doi: 10.1109/TVCG.2025.3634785 2
-
[28]
South, D
L. South, D. Saffo, O. Vitek, C. Dunne, and M. A. Borkin. Effec- tive use of likert scales in visualization evaluations: A systematic review. Computer Graphics F orum, 41(3):43–55, 2022. doi: 10.1111/ cgf.14521 2, 3
2022
-
[29]
Spiegelhalter
D. Spiegelhalter. Risk and Uncertainty Communication. Annual Re- view of Statistics and Its Application , 4(V olume 4, 2017):31–60, Mar
2017
-
[30]
doi: 10.1146/annurev-statistics-010814-020148 4
-
[31]
S. S. Stevens. On the Theory of Scales of Measurement. Science, 103(2684):677–680, June 1946. doi: 10.1126/science.103.2684.677 1
-
[32]
R. C. Team. R: A Language and Environment for Statistical Comput- ing. R Foundation for Statistical Computing, 2024. 6
2024
-
[33]
B. Victor Syiem and E. V elloso. Better Assumptions, Stronger Con- clusions: The Case for Ordinal Regression in HCI. In Proceedings of the 2026 CHI Conference on Human Factors in Computing Systems , pp. 1–21. ACM, Barcelona Spain, Apr. 2026. doi: 10.1145/3772318. 3790821 1, 2, 3
-
[34]
H. W. Wang, K. Lin, A. Cohen, R. Kennedy, Z. Zwald, C. Nobre, and C. X. Bearfield. Do Y ou “Trust” This Visualization? An Inventory to Measure Trust in Visualizations. IEEE Transactions on Visualization and Computer Graphics , 32(3):2515–2528, Mar. 2026. doi: 10.1109/ TVCG.2025.3646847 2, 3
-
[35]
Wilkinson and C
G. Wilkinson and C. Rogers. Symbolic description of factorial mod- els for analysis of variance. Journal of the Royal Statistical Society: Series C (Applied Statistics) , 22(3):392–399, 1973. doi: 10.2307/ 2346786 6
1973
-
[36]
Y ang, M
F. Y ang, M. Cai, C. Mortenson, H. Fakhari, A. D. Lokmanoglu, J. Hullman, S. Franconeri, N. Diakopoulos, E. C. Nisbet, and M. Kay. Swaying the Public? Impacts of Election Forecast Visualizations on Emotion, Trust, and Intention in the 2022 U.S. Midterms. IEEE Trans- actions on Visualization and Computer Graphics , 30(1):23–33, Jan
2022
-
[37]
doi: 10.1109/TVCG.2023.3327356 2, 3, 4
-
[38]
F. Y ang, M. Hedayati, and M. Kay. Subjective Probability Correc- tion for Uncertainty Representations. In Proceedings of the 2023 CHI Conference on Human Factors in Computing Systems , CHI ’23, pp. 1–17. Association for Computing Machinery, New Y ork, NY , USA, Apr. 2023. doi: 10.1145/3544548.3580998 2
-
[39]
F. Y ang, C. R. Mortenson, E. Nisbet, N. Diakopoulos, and M. Kay. In Dice We Trust: Uncertainty Displays for Maintaining Trust in Elec- tion Forecasts Over Time. In Proceedings of the CHI Conference on Human Factors in Computing Systems , pp. 1–24. ACM, Honolulu HI USA, May 2024. doi: 10.1145/3613904.3642371 2, 3, 4 A Supplementary Materials All supplemen...
-
[40]
The action principle : Harm caused by action is morally worse than equivalent harm caused by omission
-
[41]
The contact principle: Using physical contact to cause harm to a victim is morally worse than causing equivalent harm to a victim without using physical contact
-
[42]
The above scenario applies the action principle as the actor has to perform an action to create the outcome (as opposed to being passive and letting events unfold)
The intention principle : Harm intended as the means to a goal is morally worse than equivalent harm foreseen as the side effect of a goal. The above scenario applies the action principle as the actor has to perform an action to create the outcome (as opposed to being passive and letting events unfold). However, the other two princi- ples do not apply as ...
-
[43]
For more details on the dataset, please refer to [ 6, 16]
Each block included 15 test scenarios and 1 control scenario.” The dataset contains responses from 331 participants, and includes details on participants’ age, gender, and level of education. For more details on the dataset, please refer to [ 6, 16]. B.2 Analysis The mCCDF visualizations described in this paper are based on the results of the analysis out...
discussion (0)
Sign in with ORCID, Apple, or X to comment. Anyone can read and Pith papers without signing in.