REVIEW 4 major objections 6 minor 62 references
BCDDM: Branch-Corrected Denoising Diffusion Model for Black Hole Image Generation
T0 review · 4 major / 6 minor · reviewed 2026-08-08 · deepseek-v4-flash
Pith's one-line read This paper proposes BCDDM, a diffusion model that generates black hole images from seven accretion-flow parameters, and shows that adding these synthetic images to the training set improves a parameter regression network.
desk verdict A useful first application of diffusion to black hole image generation, but the augmentation claim lacks a size-matched control and may leak the test set through validation. read the letter →
The pith
A machine-rendered reading of the paper's core claim, the machinery that carries it, and where it could break.
The reading
What carries the argument
The load-bearing mechanism is the Branch-Corrected U-Net: a standard diffusion U-Net whose bottleneck is augmented with a parameter-correction branch that maps the latent feature vector to the seven physical parameters. The model is trained to minimize a weighted mixed loss $\mathcal{L}=\lambda_1\mathcal{L}_{\mathrm{noise}}+\lambda_2\mathcal{L}_{\mathrm{label}}$ (with $\lambda_1=0.95$, $\lambda_2=0.05$), where $\mathcal{L}_{\mathrm{noise}}$ is the standard denoising objective and $\mathcal{L}_{\mathrm{label}}$ forces the latent representation to encode the parameters. During sampling, the time step and parameter vector condition the denoising of $x_T$ back to $x_0$, yielding an image with the requested physical properties.
What would settle it
Run the paper's regression experiment on a fresh, independently generated GRRT test set of several hundred images drawn uniformly from the Table 1 ranges; if the mixed-dataset $R^2$ advantage over real-only training does not reproduce, or if the 20 μas-blurred disk-thickness $R^2$ remains negative (the paper already reports −0.3325), the claim that synthetic augmentation reliably improves parameter prediction would be refuted.
Extended reading notes
Core claim
BCDDM's central claim is that a diffusion model can learn the mapping from the seven RIAF (radiatively inefficient accretion flow) parameters to the simulated image, and that the learned mapping is accurate enough to serve as a data generator. The branch-correction architecture forces the latent representation at the U-Net bottleneck to predict the input labels, so the model optimizes both the denoising error and the parameter-consistency error. The paper reports SSIM values of 0.877–0.975 on six reconstructed test images, with NRMSE sometimes high because of spatial misalignment between sampled and target images; the parameter branch returns values close to the ground truth, with small deviations in spin $a$ and electron temperature $T_e$. For the regression evaluation, mixing BCDDM-generated images with real ones raises the test $R^2$ from 0.9206 to 0.9645 for $a$, from 0.9671 to 0.9960 for $T_e$, and from 0.9012 to 0.9602 for position angle, while the binary flow-direction accuracy rises from 92.19% to 94.27%. The paper also reports that outside the training parameter range the model generalizes poorly, so the mapping is reliable mainly inside the sampled box.
Load-bearing premise
The whole method assumes that 2,157 simulated images are enough for the model to learn a smooth, reliable mapping between the seven physical parameters and the image, so that images it generates fall on the same distribution as true ray-traced images.
Editorial extensions
If this is right
- A regressor trained on real plus synthetic images achieves higher $R^2$ for most parameters than one trained on real images alone, so BCDDM can augment small GRRT datasets without breaking their physical statistics.
- Because generation takes about 5.25 seconds per image on one GPU, a researcher can expand a 2,157-image training set by thousands of samples at a fraction of the ray-tracing cost.
- The parameter-correction branch itself acts as a fast estimator of black hole parameters from images, providing a second route to parameter inference within the same model.
- The method is not tied to the RIAF model; the authors state it can be retrained on other accretion models, and with multi-channel inputs it could be extended to polarized images.
- Because the model fails outside the parameter ranges it was trained on, any practical use for survey-level parameter estimation would need a substantially wider training set than the 2,157-image RIAF dataset.
Reading between the lines
- Editorial inference: If the conditional diffusion mapping is smooth inside the training box, the same architecture could be used as an amortized surrogate inside a Bayesian likelihood evaluation, replacing on-the-fly GRRT calls during MCMC sampling; the paper does not test this.
- Editorial inference: The sharp drop in disk-thickness $R^2$ at 20 μas blur (from 0.9717 to −0.0683 for real data) suggests that no amount of synthetic augmentation can restore a feature the instrument cannot resolve; accurate estimation of $h_{\rm disk}$ from images at this resolution may require an explicit blurring or multi-epoch model.
- Editorial inference: The larger $R^2$ gains for position angle (+0.0590) and the flow-direction accuracy gain (92.19% to 94.27%), versus essentially no gain for mass (≈0.0000), suggest that augmentation helps most for parameters with subtle or orientation-dependent image signatures; a direct test would compare per-parameter learning curves on synthetic-only versus real-only data.
Editorial analysis
A structured set of objections, weighed in public.
Referee Report
Summary. The paper presents BCDDM, a conditional denoising diffusion model for generating black hole accretion-flow images from seven physical parameters (spin, mass, electron temperature, disk thickness, Keplerian factor, position angle, and flow direction). The model is trained on 2,157 GRRT (ipole) images of a RIAF model, with a novel branch-correction architecture and a mixed loss combining noise prediction and label prediction. The authors report NRMSE/SSIM reconstruction metrics and evaluate the usefulness of the generated images as data augmentation for a ResNet50 regressor that predicts black hole parameters, comparing datasets of real, fake, and mixed images.
Significance. BCDDM is, to the authors' knowledge, the first diffusion-based generative model for black hole images, and the public availability of code and data is a strength. The reported generation speed of 5.25 s per image, though slower than direct GRRT surrogates, offers a concrete speed-up over computational GRRT and the approach is potentially extensible to other accretion models and polarization. However, the central claims of high-fidelity generation and augmentation benefit are not yet fully supported by the evidence: the NRMSE values are large, the data augmentation comparisons lack a size-matched control, and the label loss introduces a circularity in demonstrating parameter-image consistency. With additional experimental controls and statistical rigor, the method could become a useful tool.
major comments (4)
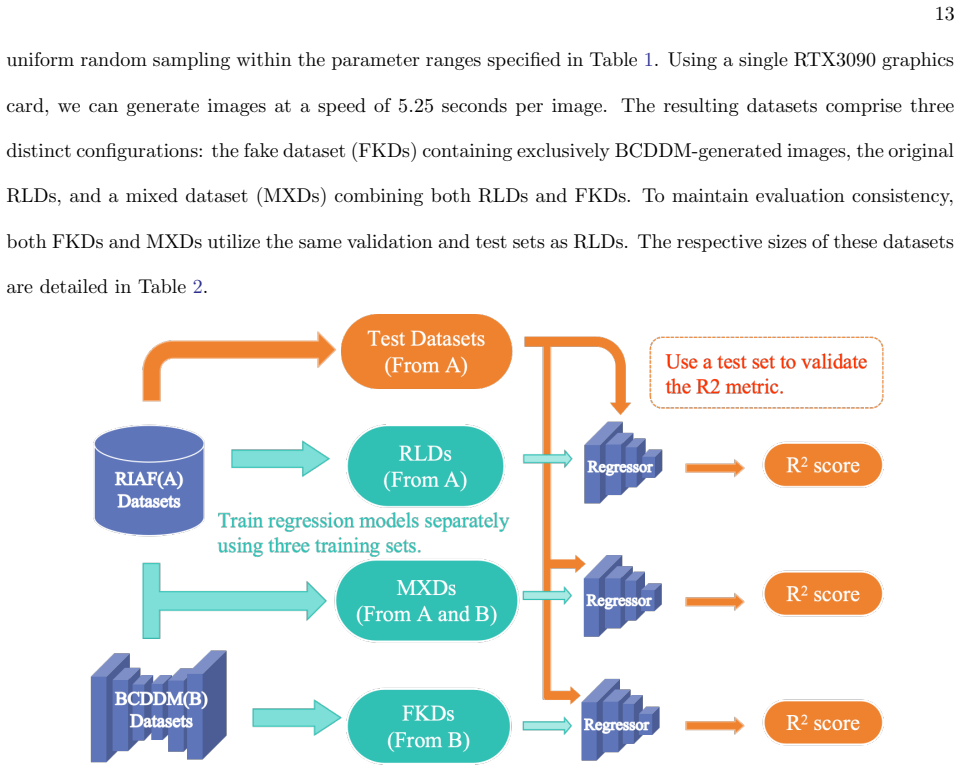
- [Section 3.2, Table 3] The comparison between RLDs (1,725 training images) and MXDs (3,450 training images, 1,725 real + 1,725 BCDDM) does not control for dataset size. The observed R2 increases (e.g., a: 0.9206 to 0.9645; PA: 0.9012 to 0.9602) could be driven by the additional training data rather than the physical fidelity of BCDDM images. A size-matched control, such as training on 3,450 real GRRT images or on the RLDs with a classical augmentation (noise, small shifts, or duplicated real images), is required to support the claim that BCDDM augmentation provides unique information. Furthermore, Table 4 shows that the MXD performance for hdisk at 20 µas blurring is worse than RLDs (-0.3325 vs -0.0683), which is inconsistent with a robust augmentation benefit.
- [Section 2.4, Eq. (11)] The label loss L_label explicitly optimizes the branch to predict the conditioning parameters from the intermediate feature representation of the generated image. This enforces a statistical association between generated images and parameters by construction, so the strong parameter-prediction results in Figure 5 and the R2 improvements in Table 3 are not independent evidence that the images encode physically correct features. Since the regressor is evaluated on real test images, the improvement in MXDs could reflect the regressor exploiting label-specific cues present in the synthetic images; the paper should demonstrate that the augmentation benefit persists when the label branch is ablated or when the comparison is size-matched.
- [Section 3.1, Figure 5] The claim that BCDDM generates “clear and high-quality” black hole images is not consistent with the reported NRMSE values, which range from 0.072 to 1.037 across the six test images, with panels (b) and (d) at 0.897 and 1.037. The authors attribute these discrepancies to spatial alignment and brightness instability, but this undercuts the utility of the model as a pixel-accurate surrogate. Additionally, Figure 6 shows that outside the training parameter ranges the model produces high NRMSE and low SSIM (e.g., panel f: NRMSE=1.349, SSIM=0.165), confirming that the surrogate is only valid within the narrow training distribution.
- [Section 3.2, Tables 3 and 4] No error bars, confidence intervals, or repeated-seed experiments are reported for any R2 value. With a test set of only 216 images, the differences between RLDs and MXDs are subject to sampling noise; for example, the hdisk R2 of 0.9841 versus 0.9893 in Table 3 is small relative to the likely variance. The claim of “significant improvements” requires either multiple training runs with reported variability or a statistical significance test.
minor comments (6)
- [Section 2.2] The heading 'black hole image dateset' should be corrected to 'dataset'.
- [Throughout] The parameter hdisk is sometimes denoted 'h' (e.g., Section 3.1, Figure 6); please use consistent notation.
- [Section 2.4, Figures 2 and 3] The architecture is hard to parse; the feeding of the conditioning label at training and sampling, and the role of the predicted label at inference, should be clarified.
- [Section 2.3] The linear noise schedule (β_t from 1e-4 to 0.02) is chosen without motivation; a discussion or comparison with alternative schedules would strengthen the paper.
- [Section 3.2] For the binary parameter Fdir, R2 is not an appropriate regression metric; the confusion matrix in Figure 8 is more informative, and the regression formulation for a binary variable should be explained.
- [References] The citation 'Wan & Ohtani 2000' for Eq. (11) appears unrelated to the label loss; please verify the reference.
Circularity Check
Label-loss-trained parameter branch makes the 'strong correlation' evidence self-confirming; SSIM/NRMSE and FKDs checks provide non-circular grounding.
-
fitted input called prediction
[Section 2.4, Eq. (11), used as evidence in Section 3.1 and Fig. 5]
"Meanwhile, the label loss, Llabel = Ex0,l h (f (k) − l)2 i , enforces alignment between generated images and their target physical parameters. ... The physical parameters predicted by the parameter correction branch closely match the original values ... This confirms that the parameter correction branch effectively learns the mapping between images and physical parameters, demonstrating BCDDM’s sensitivity to parameter variations."
The quoted 'prediction' is made by the parameter-correction branch that is explicitly trained, via L_label, to output the ground-truth physical parameters from image features, and during sampling the same label is also injected as conditioning ('we encode both the step t and the image’s label, embedding this information into the noisy image xt'). The near-match between the branch output and the input label is therefore a consequence of the training objective and the conditioning channel, not an independent measurement that the image content alone encodes the parameters. Using this agreement to 'confirm' that BCDDM-generated image features correspond to the parameters is a fitted output being presented as its own validation.
full rationale
The derivation is not globally circular: BCDDM is trained on 1,941 GRRT-rendered RIAF images and evaluated on 216 held-out images, and the SSIM/NRMSE comparisons against real GRRT images are independent, non-circular evidence that the generated images are structurally similar. The FKDs-only regressor underperforming RLDs on several parameters is also an honest external check. However, one load-bearing supporting claim is circular: the 'strong correlation between generated images and their physical parameters' is validated with the parameter-correction branch, which is trained by L_label to output exactly those labels while the labels are also injected as conditioning inputs, so the agreement is enforced by construction rather than independently established. The data-augmentation comparison (RLDs with 1,725 training images vs MXDs with 3,450 training images) is additionally confounded by dataset size; this is an experimental-control problem rather than a formal circularity, and it should be addressed with a size-matched control and repeated-seed error bars before the augmentation benefit is attributed to BCDDM fidelity. On balance, the central image-generation claim has independent content, but the parameter-correlation evidence and the 'proves in reverse' inference are partially self-confirming, giving a partial-circularity score of 6.
Assumptions & free parameters
free parameters (3)
- Loss weights lambda1, lambda2 =
0.95, 0.05
- Diffusion noise schedule beta_t and T =
beta from 1e-4 to 0.02, T=1000
- Training epochs and checkpoint selection =
8000 epochs, model saved at epoch 5000
assumptions (4)
- domain assumption The RIAF model with thermal synchrotron emission is a valid description of the M87* accretion flow at 230 GHz.
- domain assumption The ipole GRRT code produces ground-truth images for the target physical parameters.
- standard math The standard DDPM forward and reverse process equations (Eqs. 4-9) are correct.
- ad hoc to paper Adding the label prediction branch and the L_label loss enforces physical consistency between generated images and conditioning parameters.
Cite this review
Pith. "Pith review of BCDDM: Branch-Corrected Denoising Diffusion Model for Black Hole Image Generation." pith.science (2026). https://pith.science/paper/JB4DEETM
@misc{pith2026250208528,
  author       = {Pith},
  title        = {Pith review of: BCDDM: Branch-Corrected Denoising Diffusion Model for Black Hole Image Generation},
  year         = {2026},
  howpublished = {\url{https://pith.science/paper/JB4DEETM}},
  note         = {Machine review of arXiv:2502.08528}
}
read the original abstract
The properties of black holes and accretion flows can be inferred by fitting Event Horizon Telescope (EHT) data to simulated images generated through general relativistic ray tracing (GRRT). However, due to the computationally intensive nature of GRRT, the efficiency of generating specific radiation flux images needs to be improved. This paper introduces the Branch Correction Denoising Diffusion Model (BCDDM), a deep learning framework that synthesizes black hole images directly from physical parameters. The model incorporates a branch correction mechanism and a weighted mixed loss function to enhance accuracy and stability. We have constructed a dataset of 2,157 GRRT-simulated images for training the BCDDM, which spans seven key physical parameters of the radiatively inefficient accretion flow (RIAF) model. Our experiments show a strong correlation between the generated images and their physical parameters. By enhancing the GRRT dataset with BCDDM-generated images and using ResNet50 for parameter regression, we achieve significant improvements in parameter prediction performance. BCDDM offers a novel approach to reducing the computational costs of black hole image generation, providing a faster and more efficient pathway for dataset augmentation, parameter estimation, and model fitting.
Figures


Figures from the paper (7 more)




Reference graph
Works this paper leans on
-
[1]
Asgar, S., Sahil, A. A., & Nazim Uddin, M. 2023, in 2023 26th International Conference on Computer and Information Technology (ICCIT), 1–5, doi: 10.1109/ICCIT60459.2023.10441276
-
[2]
Bardeen, J. M. 1973, in Black Holes (Les Astres Occlus), ed. C. Dewitt & B. S. Dewitt, 215–239
1973
-
[3]
Broderick, A. E., Fish, V. L., Doeleman, S. S., & Loeb, A. 2011a, ApJ, 735, 110, doi: 10.1088/0004-637X/735/2/110 —. 2011b, ApJ, 738, 38, doi: 10.1088/0004-637X/738/1/38
-
[4]
E., Gold, R., Karami, M., Preciado-L´ opez, J
Broderick, A. E., Gold, R., Karami, M., Preciado-L´ opez, J. A., et al. 2020, ApJ, 897, 139, doi: 10.3847/1538-4357/ab91a4
-
[5]
Broderick, A. E., Fish, V. L., Johnson, M. D., et al. 2016, ApJ, 820, 137, doi: 10.3847/0004-637X/820/2/137
-
[6]
Chael, A., Johnson, M. D., & Lupsasca, A. 2021, ApJ, 918, 6, doi: 10.3847/1538-4357/ac09ee
-
[7]
2018, ApJ, 867, 59, doi: 10.3847/1538-4357/aadfe5
Chan, C.-k., Medeiros, L., ¨Ozel, F., & Psaltis, D. 2018, ApJ, 867, 59, doi: 10.3847/1538-4357/aadfe5
-
[8]
2024, in IAU General Assembly, 1132, doi: 10.48550/arXiv.2405.04749
Chang, D., Tiede, P., Johnson, M., & Palumbo, D. 2024, in IAU General Assembly, 1132, doi: 10.48550/arXiv.2405.04749
Show all 62 references
-
[9]
2023, Science China Physics, Mechanics, and Astronomy, 66, 260401, doi: 10.1007/s11433-022-2059-5 Event Horizon Telescope Collaboration, Akiyama, K.,
Chen, S., Jing, J., Qian, W.-L., & Wang, B. 2023, Science China Physics, Mechanics, and Astronomy, 66, 260401, doi: 10.1007/s11433-022-2059-5 Event Horizon Telescope Collaboration, Akiyama, K.,
2023 doi
-
[10]
2019a, ApJL, 875, L1, doi: 10.3847/2041-8213/ab0ec7 —
Alberdi, A., Alef, W., et al. 2019a, ApJL, 875, L1, doi: 10.3847/2041-8213/ab0ec7 —. 2019b, ApJL, 875, L5, doi: 10.3847/2041-8213/ab0f43 —. 2022a, ApJL, 930, L12, doi: 10.3847/2041-8213/ac6674 —. 2022b, ApJL, 930, L17, doi: 10.3847/2041-8213/ac6756 —. 2022c, ApJL, 930, L16, do...
-
[11]
C., et al
Algaba, J. C., et al. 2021a, ApJL, 910, L12, doi: 10.3847/2041-8213/abe71d —. 2021b, ApJL, 910, L13, doi: 10.3847/2041-8213/abe4de Event Horizon Telescope Collaboration, Akiyama, K.,
-
[12]
2024b, ApJL, 964, L26, doi: 10.3847/2041-8213/ad2df1 —
Alberdi, A., et al. 2024b, ApJL, 964, L26, doi: 10.3847/2041-8213/ad2df1 —. 2024c, ApJL, 964, L25, doi: 10.3847/2041-8213/ad2df0
-
[13]
2000, ApJL, 528, L13, doi: 10.1086/312423
Falcke, H., Melia, F., & Agol, E. 2000, ApJL, 528, L13, doi: 10.1086/312423
2000 doi
-
[14]
2021, in 2021 IEEE/CVF International Conference on Computer Vision (ICCV), 142–151
Fei, N., Gao, Y., Lu, Z., & Xiang, T. 2021, in 2021 IEEE/CVF International Conference on Computer Vision (ICCV), 142–151
2021
-
[15]
S., Palumbo, D
Gelles, Z., Prather, B. S., Palumbo, D. C. M., Johnson, M. D., et al. 2021, ApJ, 912, 39, doi: 10.3847/1538-4357/abee13 19
2021 doi
-
[16]
J., Pouget-Abadie, J., Mirza, M., Xu, B., et al
Goodfellow, I. J., Pouget-Abadie, J., Mirza, M., Xu, B., et al. 2014, in Proceedings of the 28th International Conference on Neural Information Processing Systems - Volume 2, NIPS’14 (Cambridge, MA, USA: MIT Press), 2672–2680
2014
-
[17]
E., Holz, D
Gralla, S. E., Holz, D. E., & Wald, R. M. 2019, PhRvD, 100, 024018, doi: 10.1103/PhysRevD.100.024018
2019 doi
-
[18]
2016, in 2016 IEEE Conference on Computer Vision and Pattern Recognition (CVPR), 770–778
He, K., Zhang, X., Ren, S., & Sun, J. 2016, in 2016 IEEE Conference on Computer Vision and Pattern Recognition (CVPR), 770–778
2016
-
[19]
2020, Denoising Diffusion Probabilistic Models
Ho, J., Jain, A., & Abbeel, P. 2020, Denoising Diffusion Probabilistic Models
2020
-
[20]
1997, Neural computation, 9, 1735, doi: 10.1162/neco.1997.9.8.1735
Hochreiter, S., & Schmidhuber, J. 1997, Neural computation, 9, 1735, doi: 10.1162/neco.1997.9.8.1735
1997 doi
- [21]
-
[22]
2024, JCAP, 2024, 054, doi: 10.1088/1475-7516/2024/11/054
Huang, J., Zheng, L., Guo, M., & Chen, B. 2024, JCAP, 2024, 054, doi: 10.1088/1475-7516/2024/11/054
2024 doi
-
[23]
V., Narayan, R., & Abramowicz, M
Igumenshchev, I. V., Narayan, R., & Abramowicz, M. A. 2003, ApJ, 592, 1042, doi: 10.1086/375769
2003 doi
-
[24]
D., Lupsasca, A., Strominger, A., Wong, G
Johnson, M. D., Lupsasca, A., Strominger, A., Wong, G. N., et al. 2020, Science Advances, 6, eaaz1310, doi: 10.1126/sciadv.aaz1310
2020 doi
-
[25]
P., & Welling, M
Kingma, D. P., & Welling, M. 2022, Auto-Encoding Variational Bayes. https://arxiv.org/abs/1312.6114
2022 arXiv
-
[26]
Krizhevsky, A., Sutskever, I., & Hinton, G. E. 2012, Communications of the ACM, 60, 84
2012
-
[27]
2022, Science China
Liu, X., Chen, S., & Jing, J. 2022, Science China
2022
-
[28]
Physics, Mechanics, and Astronomy, 65, 120411, doi: 10.1007/s11433-022-1946-2
1946 doi
-
[29]
Luminet, J. P. 1979, A&A, 75, 228
1979
-
[30]
R., Psaltis, D., & ¨Ozel, F
Medeiros, L., Lauer, T. R., Psaltis, D., & ¨Ozel, F. 2018, ApJ, 864, 7, doi: 10.3847/1538-4357/aad37a
2018 doi
-
[31]
R., & ¨Ozel, F
Medeiros, L., Psaltis, D., Lauer, T. R., & ¨Ozel, F. 2023, ApJL, 947, L7, doi: 10.3847/2041-8213/acc32d
2023 doi
-
[32]
M., Porth, O., et al
Mizuno, Y., Younsi, Z., Fromm, C. M., Porth, O., et al. 2018, Nature Astronomy, 2, 585, doi: 10.1038/s41550-018-0449-5
2018 doi
-
[33]
2024, MNRAS, 527, 10965, doi: 10.1093/mnras/stad3797 Mo´ scibrodzka, M., & Gammie, C
Mohan, A., Protopapas, P., Kunnumkai, K., Garraffo, C., et al. 2024, MNRAS, 527, 10965, doi: 10.1093/mnras/stad3797 Mo´ scibrodzka, M., & Gammie, C. F. 2018, MNRAS, 475, 43, doi: 10.1093/mnras/stx3162
2024 doi
-
[34]
A., & Yfantis, A
Moscibrodzka, M. A., & Yfantis, A. I. 2023, ApJS, 265, 22, doi: 10.3847/1538-4365/acb6f9
2023 doi
-
[35]
2022, MNRAS, 511, 3795, doi: 10.1093/mnras/stac285
Narayan, R., Chael, A., Chatterjee, K., Ricarte, A., et al. 2022, MNRAS, 511, 3795, doi: 10.1093/mnras/stac285
2022 doi
-
[36]
V., & Abramowicz, M
Narayan, R., Igumenshchev, I. V., & Abramowicz, M. A. 2003, PASJ, 55, L69, doi: 10.1093/pasj/55.6.L69
2003 doi
-
[37]
1997, ApJ, 476, 49, doi: 10.1086/303591
Narayan, R., Kato, S., & Honma, F. 1997, ApJ, 476, 49, doi: 10.1086/303591
1997 doi
-
[38]
2021, ApJ, 912, 35, doi: 10.3847/1538-4357/abf117
Gelles, Z., et al. 2021, ApJ, 912, 35, doi: 10.3847/1538-4357/abf117
2021 doi
-
[39]
2021, PhRvD, 104, 124010, doi: 10.1103/PhysRevD.104.124010
Peng, J., Guo, M., & Feng, X.-H. 2021, PhRvD, 104, 124010, doi: 10.1103/PhysRevD.104.124010
2021 doi
-
[40]
2016a, ApJ, 831, 4, doi: 10.3847/0004-637X/831/1/4
Pu, H.-Y., Akiyama, K., & Asada, K. 2016a, ApJ, 831, 4, doi: 10.3847/0004-637X/831/1/4
-
[41]
Pu, H.-Y., & Broderick, A. E. 2018, ApJ, 863, 148, doi: 10.3847/1538-4357/aad086
2018 doi
-
[42]
2016b, ApJ, 820, 105, doi: 10.3847/0004-637X/820/2/105
Pu, H.-Y., Yun, K., Younsi, Z., & Yoon, S.-J. 2016b, ApJ, 820, 105, doi: 10.3847/0004-637X/820/2/105
-
[43]
2022, ApJ, 938, 2, doi: 10.3847/1538-4357/ac8f49
Qin, X., Chen, S., Zhang, Z., & Jing, J. 2022, ApJ, 938, 2, doi: 10.3847/1538-4357/ac8f49
2022 doi
-
[44]
N., et al
Qiu, R., Ricarte, A., Narayan, R., Wong, G. N., et al. 2023, MNRAS, 520, 4867, doi: 10.1093/mnras/stad466
2023 doi
-
[45]
2024, in Proceedings of the IEEE/CVF Conference on Computer Vision and Pattern Recognition
Ran, H., Guizilini, V., & Wang, Y. 2024, in Proceedings of the IEEE/CVF Conference on Computer Vision and Pattern Recognition
2024
-
[46]
SaraerToosi, A., & Broderick, A. E. 2024, ApJ, 967, 140, doi: 10.3847/1538-4357/ad3e76
2024 doi
-
[47]
2024, IEEE Transactions on Medical Imaging, 43, 3559, doi: 10.1109/TMI.2024.3418652
Shi, Y., Xia, W., Wang, G., & Mou, X. 2024, IEEE Transactions on Medical Imaging, 43, 3559, doi: 10.1109/TMI.2024.3418652
2024
-
[48]
2014, Computer Science
Simonyan, K., & Zisserman, A. 2014, Computer Science
2014
-
[49]
D., & Kazemi, A
Stephen, K. D., & Kazemi, A. 2014, Geophysical Prospecting, 62, 1009, doi: 10.1111/1365-2478.12109
2014
-
[50]
2024, in Proceedings of the IEEE/CVF Conference on Computer Vision and Pattern Recognition van der Gucht, J., Davelaar, J., Hendriks, L., Porth, O., et al
Tu, S., Dai, Q., Cheng, Z.-Q., et al. 2024, in Proceedings of the IEEE/CVF Conference on Computer Vision and Pattern Recognition van der Gucht, J., Davelaar, J., Hendriks, L., Porth, O., et al. 2020, A&A, 636, A94, doi: 10.1051/0004-6361/201937014
2024 doi
-
[51]
2011, Classical and Quantum Gravity, 28, 225011, doi: 10.1088/0264-9381/28/22/225011
Perrin, G. 2011, Classical and Quantum Gravity, 28, 225011, doi: 10.1088/0264-9381/28/22/225011
2011 doi
-
[52]
2000, Journal of Statistical Planning and Inference, 86, 157
Wan, A., & Ohtani, K. 2000, Journal of Statistical Planning and Inference, 86, 157
2000
-
[53]
2022, Communications in Theoretical Physics, 74, 097401, doi: 10.1088/1572-9494/ac6e5c
Wang, M., Chen, S., & Jing, J. 2022, Communications in Theoretical Physics, 74, 097401, doi: 10.1088/1572-9494/ac6e5c
2022 doi
-
[54]
2004, IEEE Transactions on Image Processing, 13, 600, doi: 10.1109/TIP.2003.819861
Wang, Z., Bovik, A., Sheikh, H., & Simoncelli, E. 2004, IEEE Transactions on Image Processing, 13, 600, doi: 10.1109/TIP.2003.819861
2004
-
[55]
Wang, Z., & Bovik, A. C. 2009, IEEE Signal Processing Magazine, 26, 98, doi: 10.1109/MSP.2008.930649 20
2009
-
[56]
White, C. J. 2022, ApJS, 262, 28, doi: 10.3847/1538-4365/ac77ef
2022 doi
-
[57]
I., Zhao, S., Gold, R., Mo´ scibrodzka, M., et al
Yfantis, A. I., Zhao, S., Gold, R., Mo´ scibrodzka, M., et al. 2024, MNRAS, 535, 3181, doi: 10.1093/mnras/stae2509
2024 doi
-
[58]
2014, ARA&A, 52, 529, doi: 10.1146/annurev-astro-082812-141003
Yuan, F., & Narayan, R. 2014, ARA&A, 52, 529, doi: 10.1146/annurev-astro-082812-141003
2014 doi
-
[59]
2003, ApJ, 598, 301, doi: 10.1086/378716
Yuan, F., Quataert, E., & Narayan, R. 2003, ApJ, 598, 301, doi: 10.1086/378716
2003 doi
-
[60]
2022, European Physical Journal C, 82, 835, doi: 10.1140/epjc/s10052-022-10794-z —
Zhang, Z., Chen, S., & Jing, J. 2022, European Physical Journal C, 82, 835, doi: 10.1140/epjc/s10052-022-10794-z —. 2024, JCAP, 2024, 027, doi: 10.1088/1475-7516/2024/09/027
2022 doi
-
[61]
2024, JCAP, 05, 032, doi: 10.1088/1475-7516/2024/05/032
Zhang, Z., Hou, Y., Guo, M., & Chen, B. 2024, JCAP, 05, 032, doi: 10.1088/1475-7516/2024/05/032
2024 doi
-
[62]
2025, in The Thirteenth International Conference on Learning Representations
Zheng, Y., Liang, R., ZHENG, K., et al. 2025, in The Thirteenth International Conference on Learning Representations. https://openreview.net/forum?id=wM2sfVgMDH
2025
Reviewed August 8, 2026 · model on record in the stance chip above.
Discussion (0). Continue with ORCID to comment.