CITYREP: A Unified Benchmark for Urban Representations Across Cities, Tasks, and Modalities
Pith reviewed 2026-06-29 21:44 UTC · model grok-4.3
The pith
Urban representation evaluations using random splits overestimate model performance and fail to support cross-city generalization.
A machine-rendered reading of the paper's core claim, the machinery that carries it, and where it could break.
Core claim
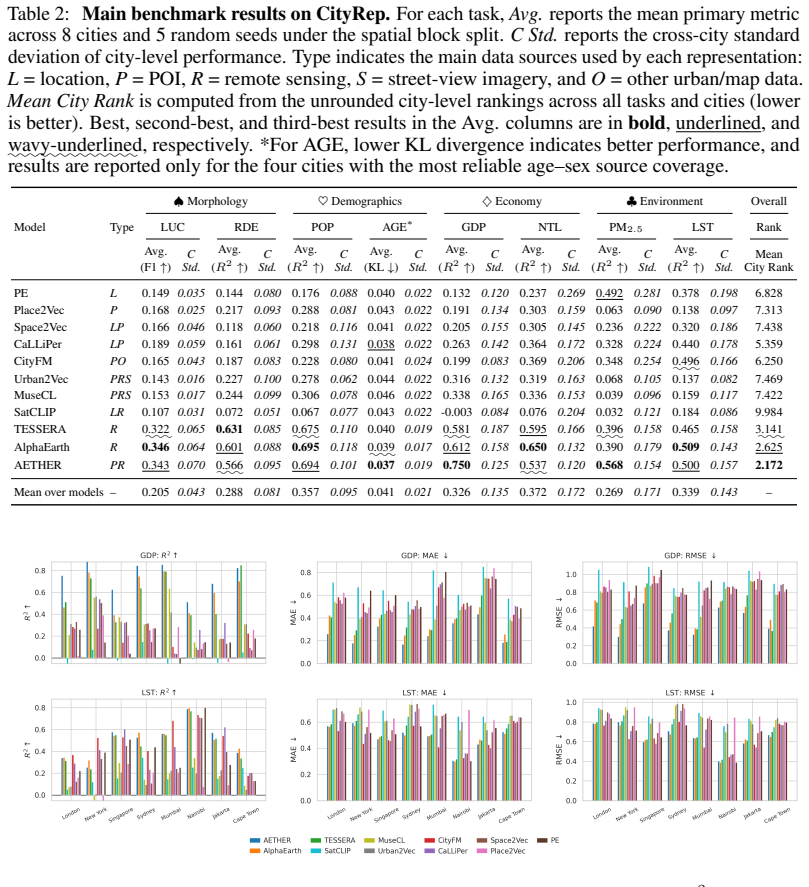
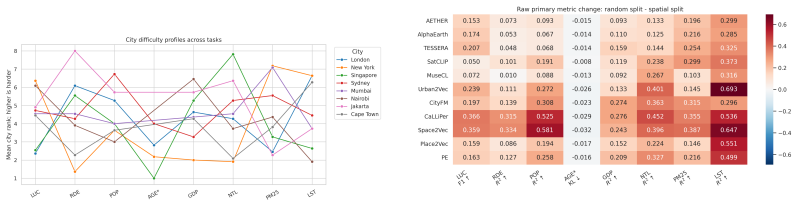
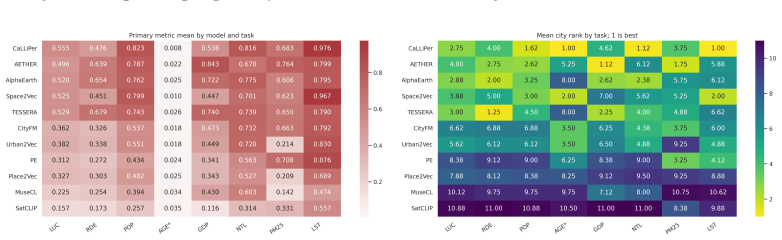
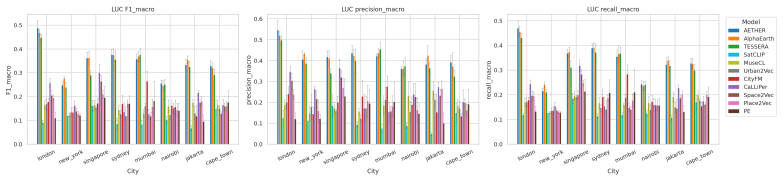
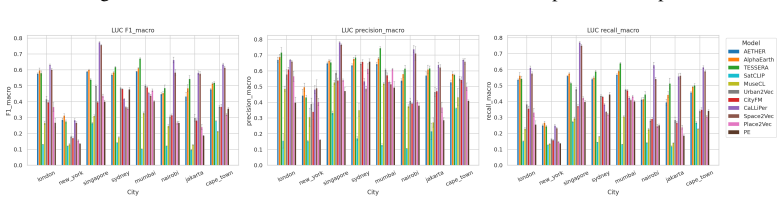
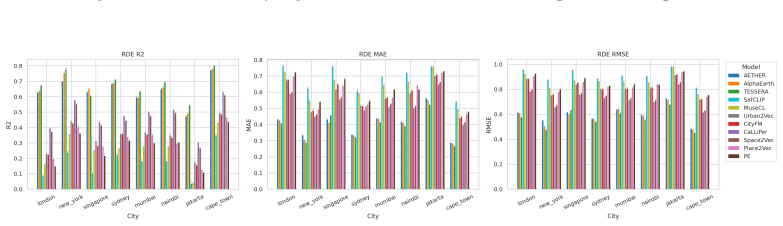
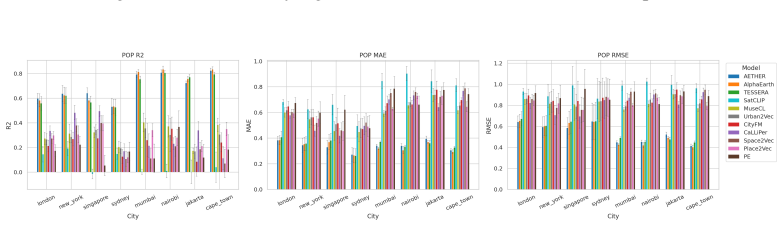
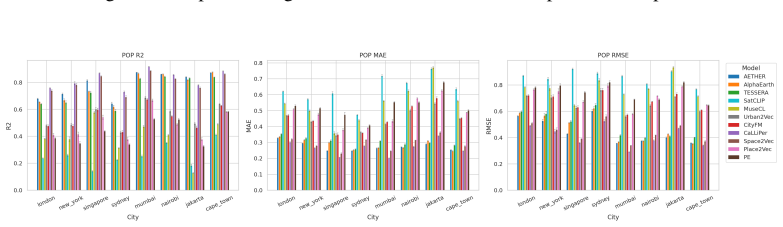
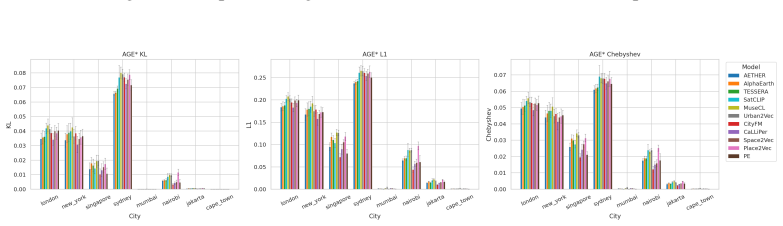
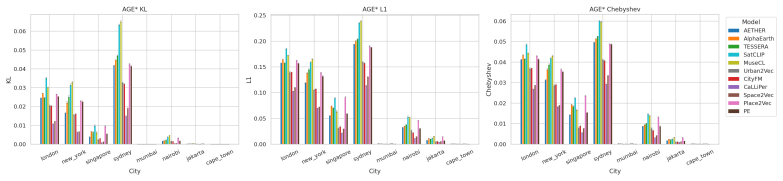
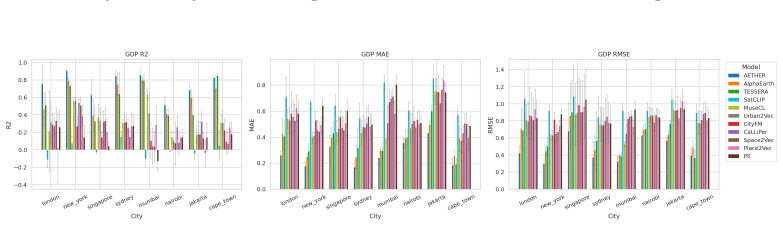
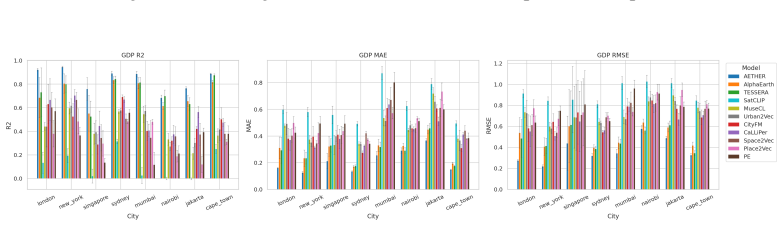
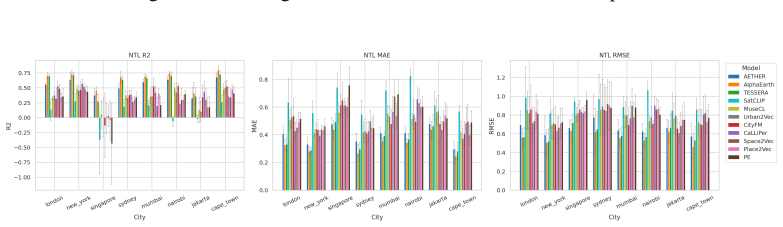
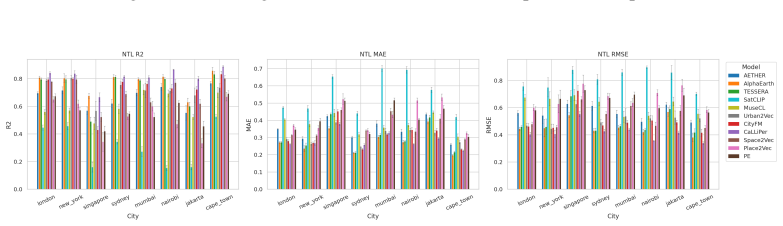
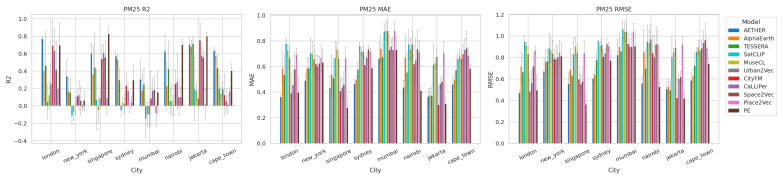
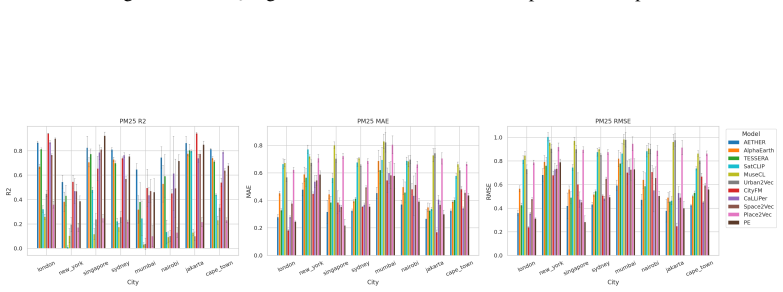
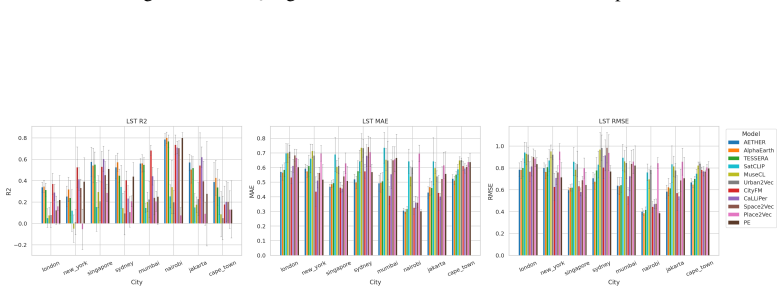
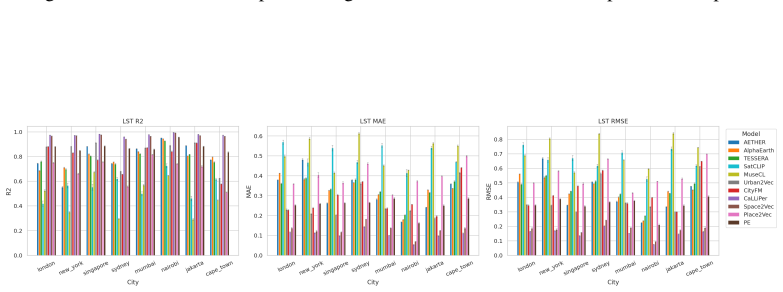
CityRep supplies a spatial unit-agnostic alignment module, a block-based spatial split protocol that removes leakage, and an extensible suite covering 8 cities and 8 tasks; when 11 models are evaluated under this protocol, scores drop and rankings shift relative to random splits, while performance also differs markedly across cities and tasks.
What carries the argument
Block-based spatial splits that partition cities into contiguous blocks for train-test division, preventing spatial leakage while remaining compatible with heterogeneous urban data representations.
If this is right
- Random splits produce higher scores than block-based spatial splits.
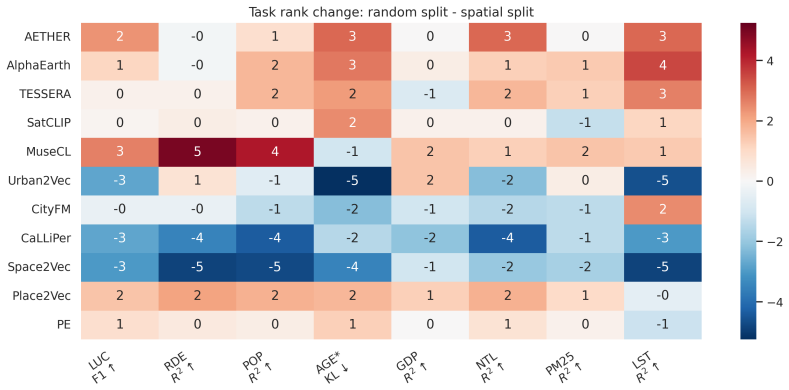
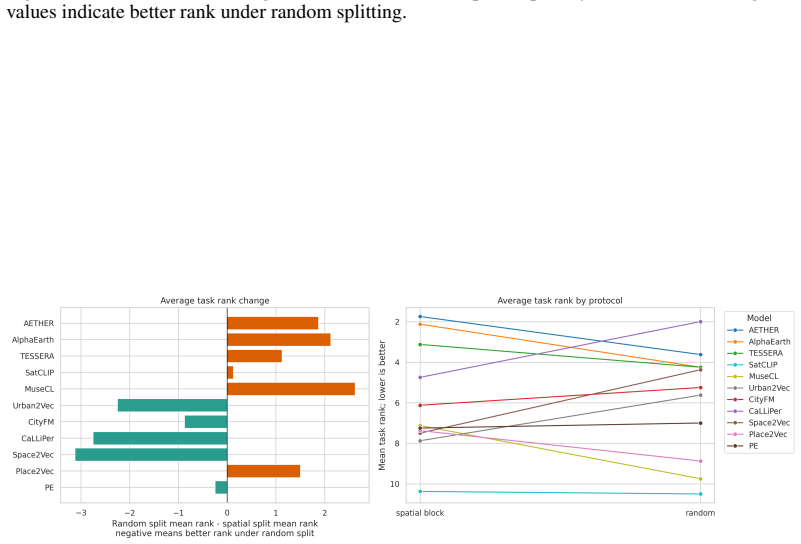
- Model rankings reverse or shift when spatial splits replace random ones.
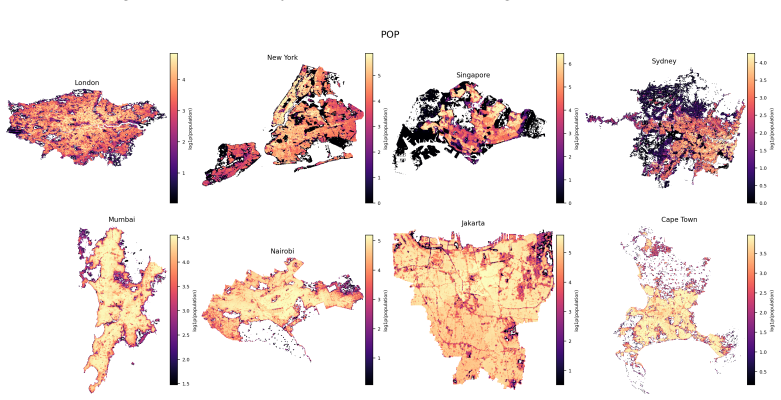
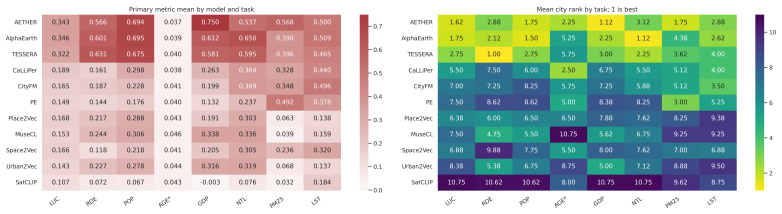
- Performance differs substantially from city to city and task to task.
- Generalization-aware evaluation protocols are required for credible claims about urban representations.
Where Pith is reading between the lines
- Model designers may need to add explicit spatial-awareness constraints during training to maintain rankings under block splits.
- The benchmark could be used to identify which data modalities transfer most reliably across cities.
- Real-world urban applications would benefit from testing new models on held-out cities before deployment.
Load-bearing premise
The choice of eight cities, eight tasks, and block-based splits is broad enough to support claims about cross-location generalization without creating its own selection biases or coverage gaps.
What would settle it
If additional experiments on new cities using both random and block splits produce identical scores and unchanged model rankings, that would show the claimed sensitivity does not hold.
Figures


read the original abstract
Urban representation learning encodes complex urban environments into general-purpose embeddings for diverse downstream tasks and emerging urban foundation models. However, current evaluations are limited, typically focusing on one or two cities and tasks and relying on random splits that introduce spatial leakage, leading to inflated performance and weak support for cross-location generalization and fair comparison. To address this, we propose CityRep, a unified benchmark that evaluates urban representations across data modalities, cities, and tasks using spatially structured splits. CityRep consists of three key components: (1) a spatial unit-agnostic evaluation framework that supports heterogeneous urban representations through a standardized alignment module; (2) a unified evaluation protocol using block-based spatial splits to mitigate spatial leakage and enable rigorous model comparison; and (3) an extensible multi-city, multi-task benchmark suite spanning 8 cities and 8 tasks across regression, classification, and distribution prediction. We evaluate 11 representative urban representation models. Results show that performance is highly sensitive to the split protocol, with random splits inflating scores and altering model rankings. We also observe substantial variability across cities and tasks, underscoring the need for generalization-aware evaluation. CityRep is released as a reproducible benchmark with datasets, evaluation pipelines, and diagnostic tools to facilitate fair comparison and support future research in urban representation learning towards urban foundation models.
Editorial analysis
A structured set of objections, weighed in public.
Referee Report
Summary. The paper introduces CityRep, a benchmark for urban representation learning that spans 8 cities, 8 tasks (regression, classification, distribution prediction), and multiple modalities. It provides a spatial unit-agnostic alignment framework, a block-based spatial split protocol intended to reduce leakage, and an evaluation of 11 models. The central empirical claims are that random splits inflate scores and alter model rankings while performance varies substantially across cities and tasks, motivating generalization-aware evaluation protocols and the release of the benchmark suite.
Significance. If the empirical results on split sensitivity and cross-city variability hold under scrutiny, the work would be significant for the urban ML community by establishing a reproducible, multi-city benchmark that discourages over-optimistic evaluation and supports development of urban foundation models. The release of datasets, evaluation pipelines, and diagnostic tools is a concrete strength for reproducibility.
major comments (3)
- [Evaluation protocol] Evaluation protocol section: The assertion that block-based spatial splits eliminate leakage without introducing new artifacts (e.g., block-size interactions with urban density or adjacency correlations) is load-bearing for the sensitivity-to-split-protocol result, yet no sensitivity analysis to block size, no comparison against alternative spatial partitioning methods, and no quantification of residual spatial autocorrelation are reported.
- [Benchmark suite] Benchmark suite description: The claim that observed variability across cities and tasks supports the broader recommendation for generalization-aware evaluation rests on the 8-city/8-task selection being representative; however, no coverage analysis, diversity metrics, or justification for city/task selection is provided to rule out selection bias as the source of the reported variability.
- [Results] Results section on model rankings: The finding that random splits alter model rankings is central, but without reporting per-city/task variance estimates, statistical significance tests on ranking changes, or controls for the number of runs, it is unclear whether the ranking shifts exceed what would be expected from sampling variability alone.
minor comments (2)
- [Introduction] The abstract and introduction use the term 'spatial unit-agnostic' without a precise definition or pseudocode for the alignment module; a short formal description would improve clarity.
- [Experiments] Table or figure captions for the 11 models should explicitly list the modalities each model was originally trained on to allow readers to assess cross-modality generalization.
Simulated Author's Rebuttal
We thank the referee for their thoughtful comments, which highlight important aspects of the evaluation protocol, benchmark design, and statistical analysis. We provide point-by-point responses below and commit to revisions that enhance the rigor of our claims without altering the core contributions.
read point-by-point responses
-
Referee: [Evaluation protocol] Evaluation protocol section: The assertion that block-based spatial splits eliminate leakage without introducing new artifacts (e.g., block-size interactions with urban density or adjacency correlations) is load-bearing for the sensitivity-to-split-protocol result, yet no sensitivity analysis to block size, no comparison against alternative spatial partitioning methods, and no quantification of residual spatial autocorrelation are reported.
Authors: We agree that additional validation of the block-based spatial split protocol would strengthen the manuscript. In the revised version, we will add a sensitivity analysis varying block sizes (e.g., 100m, 500m, 1km) and report effects on performance metrics and estimated leakage. We will also include a comparison to alternative methods such as random grid partitioning and administrative unit splits. To quantify residual spatial autocorrelation, we will compute Moran's I statistic on the training and test sets for each split. These additions will be presented in a new subsection of the evaluation protocol and an appendix. revision: yes
-
Referee: [Benchmark suite] Benchmark suite description: The claim that observed variability across cities and tasks supports the broader recommendation for generalization-aware evaluation rests on the 8-city/8-task selection being representative; however, no coverage analysis, diversity metrics, or justification for city/task selection is provided to rule out selection bias as the source of the reported variability.
Authors: The cities were chosen to represent a range of urban scales, climates, and data availability across continents, and tasks cover regression, classification, and distribution prediction with varying spatial granularities. However, we acknowledge the lack of explicit justification and metrics in the original manuscript. We will revise the benchmark suite section to include a justification based on data coverage and add diversity metrics such as city population variance, geographic spread, and task type distribution to demonstrate representativeness and mitigate concerns of selection bias. revision: yes
-
Referee: [Results] Results section on model rankings: The finding that random splits alter model rankings is central, but without reporting per-city/task variance estimates, statistical significance tests on ranking changes, or controls for the number of runs, it is unclear whether the ranking shifts exceed what would be expected from sampling variability alone.
Authors: We appreciate this point on statistical robustness. The original experiments were run with a fixed seed for reproducibility, but to address this, we will re-run all experiments with multiple random seeds (at least 5) and report mean and standard deviation per city and task. We will also apply statistical tests, such as the Friedman test for overall ranking significance and post-hoc tests for pairwise model comparisons, to confirm that observed ranking changes due to split protocol are statistically significant. These results will be added to the results section and tables. revision: yes
Circularity Check
Empirical benchmark paper with no derivation chain or self-referential reductions
full rationale
The paper proposes CityRep as a benchmark consisting of a spatial unit-agnostic framework, block-based splits, and a multi-city/multi-task suite; it then reports direct empirical observations on 11 models. No equations, predictions, or uniqueness claims appear that reduce by construction to fitted parameters, self-citations, or ansatzes defined inside the work. The sensitivity findings are measurements on the benchmark itself rather than outputs derived from its own inputs. This is a self-contained empirical contribution.
Axiom & Free-Parameter Ledger
axioms (1)
- domain assumption Random splits in spatial urban data introduce leakage that inflates performance and prevents fair cross-location comparison.
Reference graph
Works this paper leans on
-
[1]
Satclip: global, general-purpose location embeddings with satellite imagery
Konstantin Klemmer, Esther Rolf, Caleb Robinson, Lester Mackey, and Marc Rußwurm. Satclip: global, general-purpose location embeddings with satellite imagery. InProceedings of the Thirty-Ninth AAAI Conference on Artificial Intelligence and Thirty-Seventh Conference on Innovative Applications of Artificial Intelligence and Fifteenth Symposium on Educationa...
2025
-
[2]
TESSERA: Temporal Embeddings of Surface Spectra for Earth Representation and Analysis
Zhengpeng Feng, Clement Atzberger, Sadiq Jaffer, Jovana Knezevic, Silja Sormunen, Robin Young, Madeline C Lisaius, Markus Immitzer, Toby Jackson, James Ball, et al. Tessera: Temporal embeddings of surface spectra for earth representation and analysis.arXiv preprint arXiv:2506.20380, 2025
work page internal anchor Pith review Pith/arXiv arXiv 2025
-
[3]
Christopher F Brown, Michal R Kazmierski, Valerie J Pasquarella, William J Rucklidge, Masha Samsikova, Chenhui Zhang, Evan Shelhamer, Estefania Lahera, Olivia Wiles, Simon Ilyushchenko, et al. Alphaearth foundations: An embedding field model for accurate and efficient global mapping from sparse label data. arXiv preprint arXiv:2507.22291, 2025
work page internal anchor Pith review Pith/arXiv arXiv 2025
-
[4]
Urban2vec: Incorporating street view imagery and pois for multi-modal urban neighborhood embedding
Zhecheng Wang, Haoyuan Li, and Ram Rajagopal. Urban2vec: Incorporating street view imagery and pois for multi-modal urban neighborhood embedding. InProceedings of the AAAI Conference on Artificial Intelligence, volume 34, pages 1013–1020, 2020
2020
-
[5]
Musecl: predicting urban socioeconomic indicators via multi-semantic contrastive learning
Xixian Yong and Xiao Zhou. Musecl: predicting urban socioeconomic indicators via multi-semantic contrastive learning. InProceedings of the Thirty-Third International Joint Conference on Artificial Intelligence, IJCAI ’24, 2024
2024
-
[6]
From itdl to place2vec: Reasoning about place type similarity and relatedness by learning embeddings from augmented spatial contexts
Bo Yan, Krzysztof Janowicz, Gengchen Mai, and Song Gao. From itdl to place2vec: Reasoning about place type similarity and relatedness by learning embeddings from augmented spatial contexts. InProceedings of the 25th ACM SIGSPATIAL International Conference on Advances in Geographic Information Systems, SIGSPATIAL ’17, New York, NY , USA, 2017. Association ...
2017
-
[7]
Estimating urban functional distributions with semantics preserved poi embedding.International Journal of Geographical Information Science, 36(10):1905–1930, 2022
Weiming Huang, Lizhen Cui, Meng Chen, Daokun Zhang, and Yao Yao. Estimating urban functional distributions with semantics preserved poi embedding.International Journal of Geographical Information Science, 36(10):1905–1930, 2022
1905
-
[8]
Multi-modal contrastive learning of urban space representations from poi data.Computers, Environment and Urban Systems, 120:102299, 2025
Xinglei Wang, Tao Cheng, Stephen Law, Zichao Zeng, Lu Yin, and Junyuan Liu. Multi-modal contrastive learning of urban space representations from poi data.Computers, Environment and Urban Systems, 120:102299, 2025
2025
-
[9]
City foundation models for learning general purpose representations from openstreetmap
Pasquale Balsebre, Weiming Huang, Gao Cong, and Yi Li. City foundation models for learning general purpose representations from openstreetmap. InProceedings of the 33rd ACM international conference on information and knowledge management, pages 87–97, 2024
2024
-
[10]
Enriching location representation with detailed semantic information
Junyuan Liu, Xinglei Wang, and Tao Cheng. Enriching location representation with detailed semantic information. In13th International Conference on Geographic Information Science (GIScience 2025), volume 346 ofLeibniz International Proceedings in Informatics (LIPIcs), pages 3:1–3:15, 2025
2025
-
[11]
Roberts, V olker Bahn, Simone Ciuti, Mark S
David R. Roberts, V olker Bahn, Simone Ciuti, Mark S. Boyce, Jane Elith, Gurutzeta Guillera-Arroita, Severin Hauenstein, José J. Lahoz-Monfort, Boris Schröder, Wilfried Thuiller, David I. Warton, Brendan A. Wintle, Florian Hartig, and Carsten F. Dormann. Cross-validation strategies for data with temporal, spatial, hierarchical, or phylogenetic structure.E...
2017
-
[12]
Lahoz-Monfort, and Gurutzeta Guillera-Arroita
Roozbeh Valavi, Jane Elith, José J. Lahoz-Monfort, and Gurutzeta Guillera-Arroita. blockCV: An R package for generating spatially or environmentally separated folds for k-fold cross-validation of species distribution models.Methods in Ecology and Evolution, 10(2):225–232, 2019
2019
-
[13]
Importance of spatial predictor variable selection in machine learning applications: Moving from data reproduction to spatial prediction.Ecological Modelling, 411:108815, 2019
Hanna Meyer, Christoph Reudenbach, Stephan Wöllauer, and Thomas Nauss. Importance of spatial predictor variable selection in machine learning applications: Moving from data reproduction to spatial prediction.Ecological Modelling, 411:108815, 2019
2019
-
[14]
Poi2vec: geographical latent representation for predicting future visitors
Shanshan Feng, Gao Cong, Bo An, and Yeow Meng Chee. Poi2vec: geographical latent representation for predicting future visitors. InProceedings of the Thirty-First AAAI Conference on Artificial Intelligence, AAAI’17, pages 102–108. AAAI Press, 2017
2017
-
[15]
Learning urban region representations with pois and hierarchical graph infomax.ISPRS Journal of Photogrammetry and Remote Sensing, 196:134–145, 2023
Weiming Huang, Daokun Zhang, Gengchen Mai, Xu Guo, and Lizhen Cui. Learning urban region representations with pois and hierarchical graph infomax.ISPRS Journal of Photogrammetry and Remote Sensing, 196:134–145, 2023. 10
2023
-
[16]
Beyond alphaearth: toward human-centered spatial representation via poi-guided contrastive learning
Junyuan Liu, Quan Qin, Guangsheng Dong, Xinglei Wang, Jiazhuang Feng, Zichao Zeng, and Tao Cheng. Beyond alphaearth: toward human-centered spatial representation via poi-guided contrastive learning. arXiv preprint arXiv:2510.09894, 2025
-
[17]
Multi-scale representation learning for spatial feature distributions using grid cells
Gengchen Mai, Krzysztof Janowicz, Bo Yan, Rui Zhu, Ling Cai, and Ni Lao. Multi-scale representation learning for spatial feature distributions using grid cells. InInternational Conference on Learning Representations, 2020
2020
-
[18]
H3 indexes points and shapes into a hexagonal grid, 2026
Uber Technologies, Inc. H3 indexes points and shapes into a hexagonal grid, 2026. https://h3geo.org/. Data available under the Apache 2.0 License. Accessed 06/05/2026
2026
-
[19]
Stewart, Caleb Robinson, Isaac A
Adam J. Stewart, Caleb Robinson, Isaac A. Corley, Anthony Ortiz, Juan M. Lavista Ferres, and Arindam Banerjee. Torchgeo: Deep learning with geospatial data.ACM Transactions on Spatial Algorithms and Systems, 11(4), 2025. Article 15
2025
-
[20]
Geo-bench: toward foundation models for earth monitoring
Alexandre Lacoste, Nils Lehmann, Pau Rodriguez, Evan David Sherwin, Hannah Kerner, Björn Lütjens, Jeremy Irvin, David Dao, Hamed Alemohammad, Alexandre Drouin, Mehmet Gunturkun, Gabriel Huang, David Vazquez, Dava Newman, Yoshua Bengio, Stefano Ermon, and Xiao Xiang Zhu. Geo-bench: toward foundation models for earth monitoring. InProceedings of the 37th In...
2023
-
[21]
Satlaspretrain: A large-scale dataset for remote sensing image understanding
Favyen Bastani, Piper Wolters, Ritwik Gupta, Joe Ferdinando, and Aniruddha Kembhavi. Satlaspretrain: A large-scale dataset for remote sensing image understanding. In2023 IEEE/CVF International Conference on Computer Vision (ICCV), pages 16726–16736, 2023
2023
-
[22]
Pangaea: Assessing geospatial foundation models capabilities through a global and inclusive benchmark.IEEE Geoscience and Remote Sensing Magazine, 14:245–285, 2026
Valerio Marsocci, Yuru Jia, Georges Le Bellier, Dávid Kerekes, Liang Zeng, Sebastian Hafner, Sebastian Gerard, Eric Brune, Ritu Yadav, Ali Shibli, Heng Fang, Yifang Ban, Maarten Vergauwen, Nicolas Audebert, and Andrea Nascetti. Pangaea: Assessing geospatial foundation models capabilities through a global and inclusive benchmark.IEEE Geoscience and Remote ...
2026
-
[23]
Torchspatial: A location encoding framework and benchmark for spatial representation learning
Nemin Wu, Qian Cao, Zhangyu Wang, Zeping Liu, Yanlin Qi, Jielu Zhang, Joshua Ni, Xiaobai Yao, Hongxu Ma, Lan Mu, Stefano Ermon, Tanuja Ganu, Akshay Nambi, Ni Lao, and Gengchen Mai. Torchspatial: A location encoding framework and benchmark for spatial representation learning. InAdvances in Neural Information Processing Systems, volume 37, pages 81437–81460, 2024
2024
-
[24]
OBSR: Open benchmark for spatial representations
Julia Moska, Oleksii Furman, Kacper Kozaczko, Szymon Leszkiewicz, Jakub Polczyk, Piotr Gramacki, and Piotr Szyma ´nski. OBSR: Open benchmark for spatial representations. InProceedings of the 33rd ACM International Conference on Advances in Geographic Information Systems, SIGSPATIAL ’25, 2025
2025
-
[25]
MoRA: Mobility as the backbone for geospatial representation learning at scale
Ya Wen, Jixuan Cai, Qiyao Ma, Linyan Li, Xinhuan Chen, Chris Webster, and Yulun Zhou. MoRA: Mobility as the backbone for geospatial representation learning at scale. InInternational Conference on Learning Representations, 2026
2026
-
[26]
Dormann, Guillaume Cornu, Gaëlle Viennois, Nicolas Bayol, Alexei Lyapustin, Sylvie Gourlet- Fleury, and Raphaël Pélissier
Pierre Ploton, Frédéric Mortier, Maxime Réjou-Méchain, Nicolas Barbier, Nicolas Picard, Vivien Rossi, Carsten F. Dormann, Guillaume Cornu, Gaëlle Viennois, Nicolas Bayol, Alexei Lyapustin, Sylvie Gourlet- Fleury, and Raphaël Pélissier. Spatial validation reveals poor predictive performance of large-scale ecological mapping models.Nature Communications, 11...
2020
-
[27]
Primary Land Use Tax Lot Output (PLUTO), version 25v4
New York City Department of City Planning. Primary Land Use Tax Lot Output (PLUTO), version 25v4. NYC Open Data / BYTES of the BIG APPLE, 2026. CSV tax-lot records; current version 25v4; last modified 2026-02-20; accessed 2026-05-06
2026
-
[28]
Master Plan 2019 Land Use layer (2025)
Urban Redevelopment Authority. Master Plan 2019 Land Use layer (2025). data.gov.sg, 2023. Indicative land-use polygon layer; data from Dec. 2019; extracted from the Master Plan 2019 approved on 2019-11-18; last updated 2025-12-05; accessed 2026-05-06
2019
-
[29]
Environmental Planning Instrument – Land Zoning
NSW Department of Planning, Housing and Infrastructure. Environmental Planning Instrument – Land Zoning. NSW Planning Portal Open Data, 2022. Vector land-zoning dataset; update frequency weekly; Creative Commons Attribution; accessed 2026-05-06
2022
-
[30]
City of Cape Town. Zoning. Cape Town Open Data Portal feature service, 2019. Zoning / split-zoning feature service; published 2019-02-10; dataset-specific or custom licence; accessed 2026-05-06
2019
-
[31]
Peraturan Gubernur Nomor 31 Tahun 2022 tentang Rencana Detail Tata Ruang Wilayah Perencanaan Provinsi Daerah Khusus Ibukota Jakarta
Pemerintah Provinsi DKI Jakarta. Peraturan Gubernur Nomor 31 Tahun 2022 tentang Rencana Detail Tata Ruang Wilayah Perencanaan Provinsi Daerah Khusus Ibukota Jakarta. JDIH Provinsi DKI Jakarta, 2022. Peraturan Gubernur No. 31; ditetapkan 2022-06-27; BD Provinsi DKI Jakarta Tahun 2022 Nomor 63003; accessed 2026-05-06. 11
2022
-
[32]
Development Plan for Greater Mumbai 2014–2034: Existing Land Use Maps and Report
Municipal Corporation of Greater Mumbai. Development Plan for Greater Mumbai 2014–2034: Existing Land Use Maps and Report. Municipal Corporation of Greater Mumbai, 2012. Existing Land Use 2012 source; cited via UDRI/Login Mumbai data-source register; accessed 2026-05-06
2014
-
[33]
Nairobi, Kenya Land Use 2010
World Bank Data Catalog. Nairobi, Kenya Land Use 2010. World Bank Data Catalog, 2010. Land-use shapefile; source: Columbia University’s Center for Sustainable Urban Development; shapefile last updated 2020-06-25; metadata last updated 2023-01-19; Creative Commons Attribution 4.0; accessed 2026-05-06
2010
-
[34]
OpenStreetMap road-network extract for the CityRep benchmark cities
OpenStreetMap contributors. OpenStreetMap road-network extract for the CityRep benchmark cities. OpenStreetMap database, 2026. Drivable highway ways extracted for London, New York, Singapore, Sydney, Mumbai, Nairobi, Jakarta, and Cape Town; licensed under the Open Data Commons Open Database License (ODbL) 1.0; accessed/extracted 2026-05-06
2026
-
[35]
Bondarenko, R
M. Bondarenko, R. Priyatikanto, N. Tejedor-Garavito, W. Zhang, T. McKeen, A. Cunningham, T. Woods, J. Hilton, D. Cihan, B. Nosatiuk, T. Brinkhoff, A. Tatem, and A. Sorichetta. Constrained estimates of 2015–2030 total number of people per grid square at a resolution of 3 arc (approximately 100m at the equator), R2024B version v1. WorldPop, School of Geogra...
2015
-
[36]
Bondarenko, R
M. Bondarenko, R. Priyatikanto, N. Tejedor-Garavito, W. Zhang, T. McKeen, A. Cunningham, T. Woods, J. Hilton, D. Cihan, B. Nosatiuk, T. Brinkhoff, A. Tatem, and A. Sorichetta. Constrained estimates of 2015–2030 total number of people per grid square broken down by gender and age groupings at a resolution of 3 arc (approximately 100m at the equator), R2024...
2015
-
[37]
Downscaled gridded global dataset for gross domestic product (GDP) per capita PPP over 1990–2022.Scientific Data, 12:178, 2025
Matti Kummu, Maria Kosonen, and Sina Masoumzadeh Sayyar. Downscaled gridded global dataset for gross domestic product (GDP) per capita PPP over 1990–2022.Scientific Data, 12:178, 2025
1990
-
[38]
VIIRS Nighttime Lights Annual V2.2.https://eogdata.mines.edu/products/vnl/, 2024
Earth Observation Group, Payne Institute for Public Policy, Colorado School of Mines. VIIRS Nighttime Lights Annual V2.2.https://eogdata.mines.edu/products/vnl/, 2024. Accessed: 2026-05-06
2024
-
[39]
Elvidge, Mikhail Zhizhin, Tilottama Ghosh, Feng-Chi Hsu, and Jay Taneja
Christopher D. Elvidge, Mikhail Zhizhin, Tilottama Ghosh, Feng-Chi Hsu, and Jay Taneja. Annual time series of global VIIRS nighttime lights derived from monthly averages: 2012 to 2019.Remote Sensing, 13(5):922, 2021
2012
-
[40]
van Donkelaar, M
A. van Donkelaar, M. S. Hammer, L. Bindle, M. Brauer, J. R. Brook, M. J. Garay, N. C. Hsu, O. V . Kalashnikova, R. A. Kahn, C. Lee, R. C. Levy, A. Lyapustin, A. M. Sawyer, and R. V . Martin. Global Annual PM2.5 Grids from MODIS, MISR, SeaWiFS and VIIRS Aerosol Optical Depth (AOD), 1998–2022, V5.GL.04, Version 5.04. NASA Socioeconomic Data and Applications...
1998
-
[41]
MODIS/Terra Land Surface Temperature/Emissivity 8-Day L3 Global 1km SIN Grid V061
Zhengming Wan, Simon Hook, and Glynn Hulley. MODIS/Terra Land Surface Temperature/Emissivity 8-Day L3 Global 1km SIN Grid V061. NASA Land Processes Distributed Active Archive Center, 2021. Data set; accessed 2026-05-06
2021
-
[42]
FSQ OS Places
Foursquare Labs, Inc. FSQ OS Places. Foursquare Open Source Places data product, 2026. Open POI dataset; Apache License 2.0; preserve Foursquare attribution and NOTICE file; accessed 2026-05-06
2026
-
[43]
and Mapillary
Meta Platforms, Inc. and Mapillary. Mapillary Open Street-Level Imagery. Mapillary platform / API,
-
[44]
Street-level imagery and map-data platform; accessed via Mapillary API on 2026-05-06; images are shared under CC BY-SA and individual image/user attribution should be preserved where required
2026
-
[45]
A review of location encoding for geoai: methods and applications.International Journal of Geographical Information Science, 36:639–673, 2022
Gengchen Mai, Krzysztof Janowicz, Yingjie Hu, Song Gao, Bo Yan, Rui Zhu, Ling Cai, and Ni Lao. A review of location encoding for geoai: methods and applications.International Journal of Geographical Information Science, 36:639–673, 2022
2022
-
[46]
Gengchen Mai, Yao Xuan, Wenyun Zuo, Yutong He, Jiaming Song, Stefano Ermon, Krzysztof Janowicz, and Ni Lao. Sphere2vec: A general-purpose location representation learning over a spherical surface for large-scale geospatial predictions.ISPRS Journal of Photogrammetry and Remote Sensing, 202:439–462, 2023
2023
-
[47]
Land based classification standards
American Planning Association. Land based classification standards. https://www.planning.org/ lbcs/, 2000. Accessed 2026-05-05
2000
-
[48]
James R. Anderson, Ernest E. Hardy, John T. Roach, and Richard E. Witmer. A land use and land cover classification system for use with remote sensor data. Professional Paper 964, U.S. Geological Survey, 1976. 12 Appendix Contents A Discussion 14 A.1 Limitations . . . . . . . . . . . . . . . . . . . . . . . . . . . . . . . . . . . . . . 14 A.2 Broader Impa...
discussion (0)
Sign in with ORCID, Apple, or X to comment. Anyone can read and Pith papers without signing in.