A Measurement of the Thermal and Ionization State of the IGM at z < 0.5
Pith reviewed 2026-06-28 04:46 UTC · model grok-4.3
The pith
The low-redshift intergalactic medium reaches 28,000 K at z=0.1, seven times hotter than standard models predict.
A machine-rendered reading of the paper's core claim, the machinery that carries it, and where it could break.
Core claim
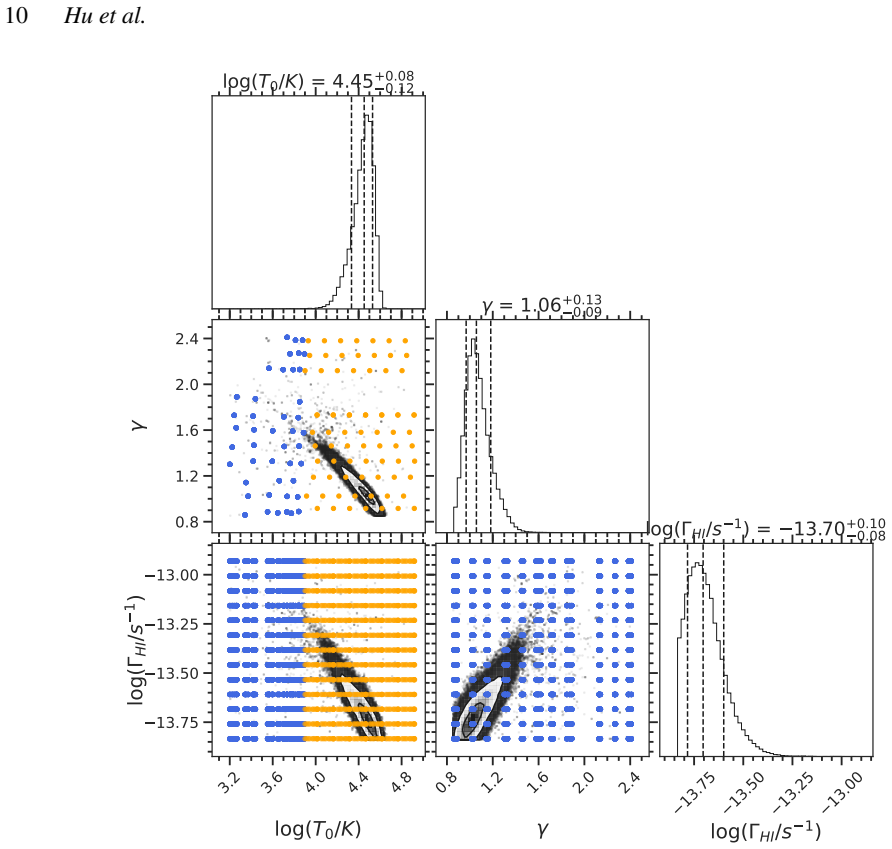
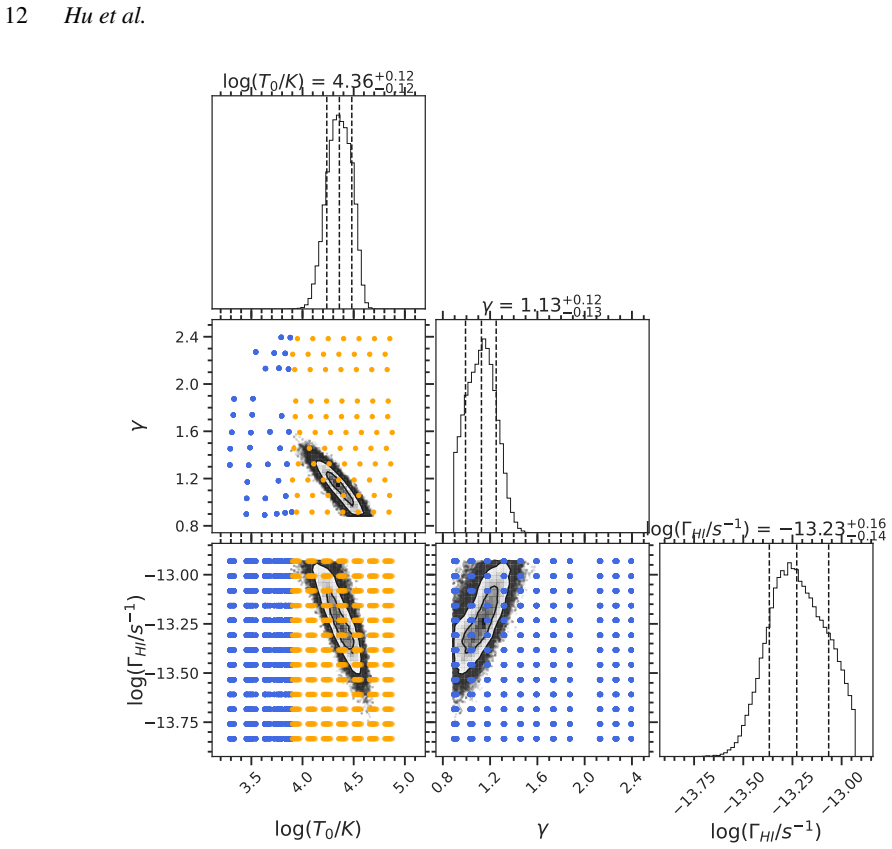
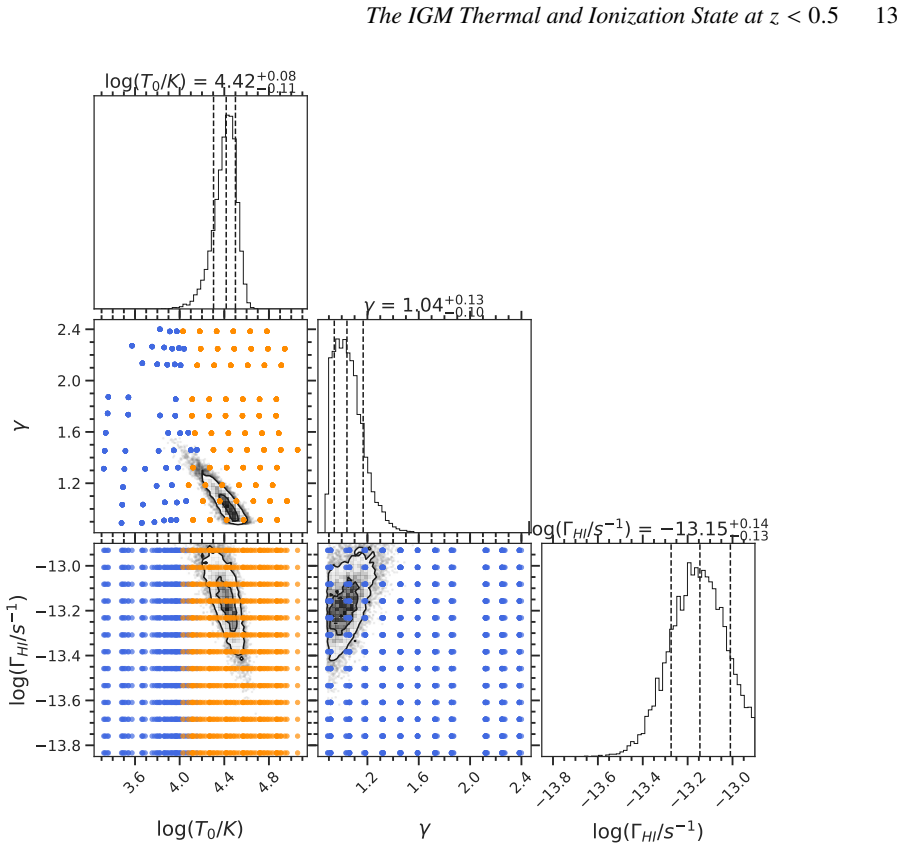
Machine-learning inference on the b-NHI distribution from COS spectra yields log(T0/K) = 4.45 (+0.08/-0.12) and gamma = 1.06 (+0.13/-0.09) at z=0.1, with log(Gamma_HI/s^-1) = -13.70 (+0.10/-0.08); the temperature is approximately seven times higher than the canonical expectation of 4000 K and gamma approximately 1.6.
What carries the argument
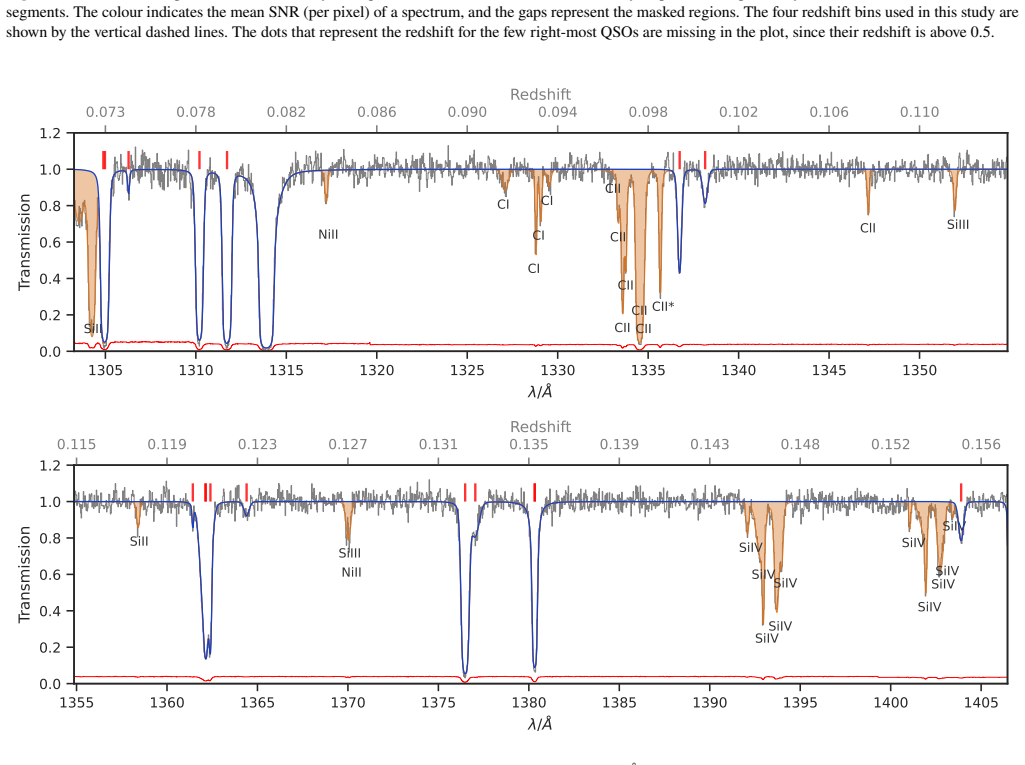
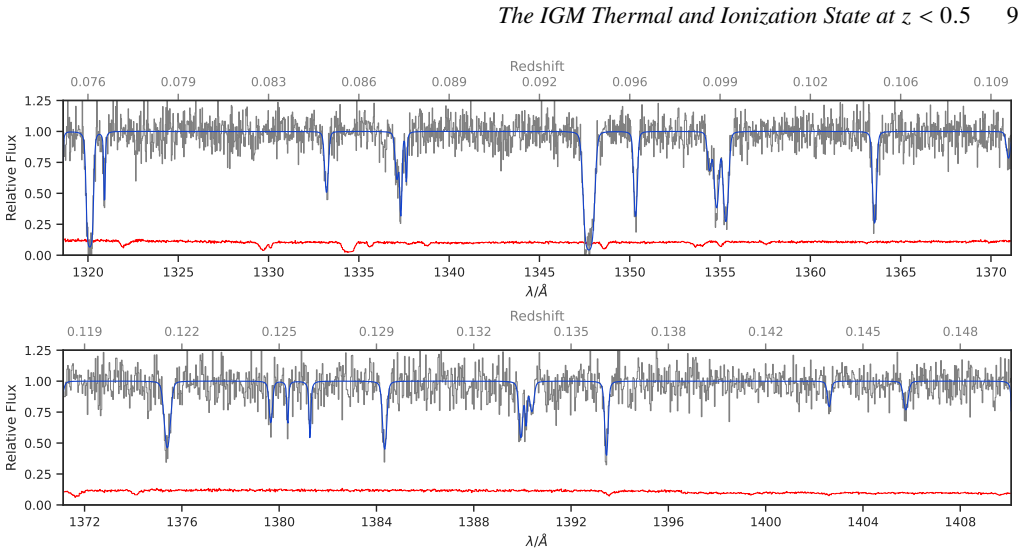
Machine-learning inference that exploits the joint Doppler parameter-column density (b-NHI) distribution obtained from Lyman-alpha forest decomposition.
If this is right
- The IGM temperature at z less than 0.5 exceeds the value expected from passive cooling after helium reionization by a factor of seven.
- The hydrogen photoionization rate at z=0.1 lies roughly four sigma below the range given by current ultraviolet-background synthesis models.
- A turbulent velocity of about 15 km/s added to a standard thermal state can reproduce the observed line widths at z=0.1.
- Either new heating mechanisms or unresolved small-scale turbulence must be present to explain the broad Lyman-alpha lines.
Where Pith is reading between the lines
- If turbulence is confirmed as the dominant cause, existing simulations of the low-redshift IGM will need to incorporate sub-grid velocity fields at scales below current resolution.
- The measured temperature and ionization rate together constrain the integrated energy input from galaxies and AGN since z approximately 2.
- Repeating the same machine-learning analysis on future high-resolution spectra could separate thermal from turbulent contributions without relying on external grids.
Load-bearing premise
The machine-learning method recovers the true thermal and ionization state without large systematic biases from unresolved turbulence, instrumental resolution, or other unmodeled physics.
What would settle it
A grid of hydrodynamic simulations with vtur approximately 15 km/s and standard thermal parameters either fails to reproduce the observed b-NHI distribution or higher-resolution STIS spectra show line widths narrower than those measured in the COS data.
Figures


read the original abstract
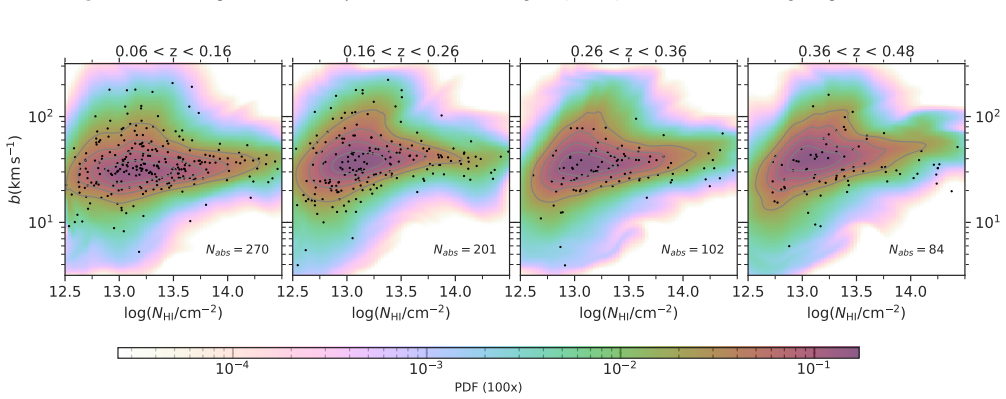
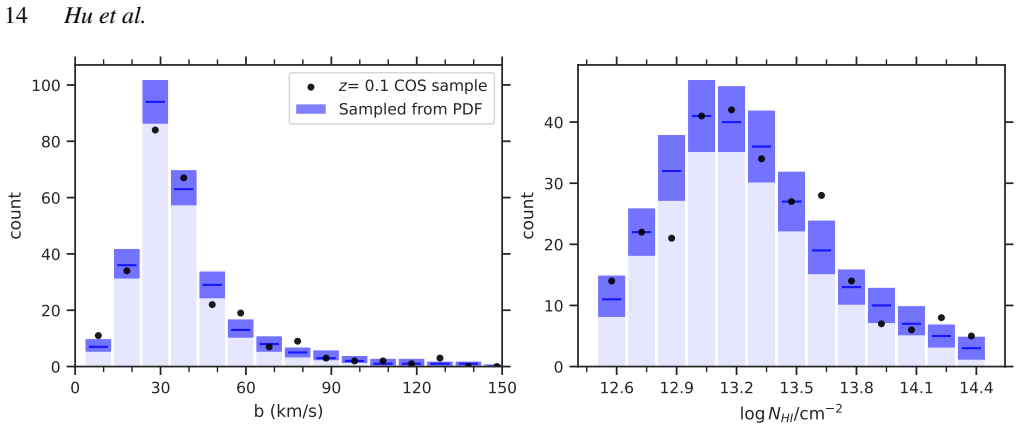
We apply a machine-learning-based inference method that exploits the joint Doppler parameter-column density (b-NHI) distribution from Lya forest decomposition to measure the thermal and ionization state of the intergalactic medium (IGM) in four redshift bins spanning z = 0.06 to 0.48, using 82 archival quasar spectra from the Cosmic Origin Spectrograph (COS) on board Hubble Space Telescope (HST). Our results show that the low-z IGM (z < 0.5) is extremely hot and nearly isothermal, with log(T0/K) = 4.45 (+0.08 / -0.12) [T0 = 28183 (+5700 / -6804) K] and gamma = 1.06 (+0.13 / -0.09) at z = 0.1. This temperature lies approx 7sigma (and 7 times) above the canonical prediction (log T0 approx 3.60, i.e. T0 ~ 4000 K, with gamma ~ 1.6 at z = 0), where the IGM is expected to have cooled long after He II reionization. We also measure the hydrogen photoionization rate to be log (GammaHI/s^-1) = -13.70 (+0.10 / -0.08) at z = 0.1, which is about approx 4sigma below the range predicted by current UV-background synthesis models (approx -13.3). To investigate the discrepancy between these high temperatures and theoretical models, we assess the impact of small-scale turbulence. By exploring a parameter grid in turbulent velocity (vtur) and GammaHI, we find that a standard IGM thermal and ionization state combined with unresolved turbulence of vtur simeq 15 km s^-1 can successfully reproduce the observed line widths at z = 0.1. Comparisons with high-resolution Space Telescope Imaging Spectrograph (STIS) expanded data indicate that the observed line widths are unlikely to be caused by instrumental resolution effects. Our findings suggest that either new heating mechanisms or unresolved turbulence are required to explain the unexpectedly broad Lya lines observed in the low-z IGM.
Editorial analysis
A structured set of objections, weighed in public.
Referee Report
Summary. The manuscript applies a machine-learning inference method to the joint Doppler parameter-column density (b-NHI) distribution extracted from 82 HST/COS quasar spectra to measure the thermal state (T0, gamma) and ionization rate (Gamma_HI) of the IGM in four redshift bins at z < 0.5. It reports log(T0/K) = 4.45 (+0.08/-0.12) and gamma = 1.06 (+0.13/-0.09) at z = 0.1 (T0 approximately 7 times and 7 sigma above canonical predictions), a lower Gamma_HI than UV-background models, and explores a post-hoc grid in turbulent velocity vtur and Gamma_HI to assess whether unresolved turbulence (vtur ≃ 15 km s^{-1}) can reconcile the data with standard thermal parameters.
Significance. If the central measurement is robust after accounting for systematics, the result would indicate that the low-redshift IGM is far hotter and closer to isothermal than expected from standard photoheating and adiabatic cooling following He II reionization, implying either missing heating mechanisms or the need to include small-scale turbulence in IGM models.
major comments (2)
- [ML method section] ML method section (as described in abstract): the primary inference maps the observed b-NHI distribution to T0 and gamma assuming vtur = 0 in the ML training and posterior; the separate turbulence grid search demonstrates that vtur ≃ 15 km s^{-1} plus canonical T0/gamma reproduces the line widths, but does not marginalize vtur inside the ML posterior or retrain the model. Because b² = 2kT/m + vtur², any unmodeled turbulence is absorbed into the reported T0, directly undermining the 7sigma tension claim.
- [Abstract and methods] Abstract and methods description: the reported 7sigma tension and specific fitted values (log T0 = 4.45, gamma = 1.06) are presented without visible derivation steps, full error budget, or validation of the ML method against mocks that include realistic turbulence, instrumental resolution, or other unmodeled physics; this absence makes the load-bearing central claim difficult to assess for systematic bias.
minor comments (1)
- The abstract states that STIS comparisons indicate line widths are unlikely due to instrumental effects, but quantitative details on the resolution comparison (e.g., effective resolution or mock tests) would improve clarity.
Simulated Author's Rebuttal
We thank the referee for their careful and constructive review. We address the two major comments point by point below, clarifying the scope of our ML analysis and outlining planned revisions to improve transparency.
read point-by-point responses
-
Referee: [ML method section] ML method section (as described in abstract): the primary inference maps the observed b-NHI distribution to T0 and gamma assuming vtur = 0 in the ML training and posterior; the separate turbulence grid search demonstrates that vtur ≃ 15 km s^{-1} plus canonical T0/gamma reproduces the line widths, but does not marginalize vtur inside the ML posterior or retrain the model. Because b² = 2kT/m + vtur², any unmodeled turbulence is absorbed into the reported T0, directly undermining the 7sigma tension claim.
Authors: We agree that the primary ML posterior assumes vtur=0 and therefore absorbs any turbulent contribution into the reported T0. The separate post-hoc grid in vtur and Gamma_HI was performed precisely to demonstrate this degeneracy and to show that canonical thermal parameters plus vtur≈15 km s^{-1} can reproduce the observed line widths. The quoted 7σ tension is therefore conditional on the vtur=0 assumption, which is the conventional choice in IGM thermal studies. We will revise the abstract, methods, and discussion to state this assumption explicitly, to emphasize the turbulence alternative, and to note the b² degeneracy. Full joint marginalization over vtur would require retraining the network and is left for future work. revision: partial
-
Referee: [Abstract and methods] Abstract and methods description: the reported 7sigma tension and specific fitted values (log T0 = 4.45, gamma = 1.06) are presented without visible derivation steps, full error budget, or validation of the ML method against mocks that include realistic turbulence, instrumental resolution, or other unmodeled physics; this absence makes the load-bearing central claim difficult to assess for systematic bias.
Authors: The quoted values and uncertainties are the median and 16/84 percentiles of the ML posterior described in the Methods section. We acknowledge that the current text does not display the full error budget or validation mocks that include turbulence. In the revised manuscript we will expand the Methods section with (i) explicit derivation steps for the posterior, (ii) a tabulated error budget, and (iii) additional validation results on mocks that incorporate turbulence, COS resolution, and other systematics. These additions will make the robustness of the central claim easier to evaluate. revision: yes
Circularity Check
No significant circularity in derivation chain
full rationale
The reported T0, gamma, and Gamma_HI values are obtained via machine-learning inference directly from the observed joint b-NHI distribution in archival COS spectra. No equations, self-citations, or parameter fits are shown that reduce these outputs to the inputs by construction. The turbulence grid search is presented as a separate post-hoc exploration and does not redefine or force the primary ML posteriors. The chain is data-driven and externally benchmarked against canonical models without load-bearing self-referential steps.
Axiom & Free-Parameter Ledger
free parameters (1)
- vtur =
15 km/s
axioms (1)
- domain assumption The joint b-NHI distribution is determined primarily by the thermal and ionization state of the IGM
Reference graph
Works this paper leans on
-
[1]
Monthly Notices of the Royal Astronomical Society: Letters , volume=
Generalized massive optimal data compression , author=. Monthly Notices of the Royal Astronomical Society: Letters , volume=. 2018 , publisher=
2018
-
[2]
International Conference on Machine Learning , pages=
Made: Masked autoencoder for distribution estimation , author=. International Conference on Machine Learning , pages=
-
[3]
arXiv preprint arXiv:1805.09294 , year=
Likelihood-free inference with emulator networks , author=. arXiv preprint arXiv:1805.09294 , year=
-
[4]
Symposium on advances in approximate Bayesian inference , pages=
Likelihood-free inference with emulator networks , author=. Symposium on advances in approximate Bayesian inference , pages=. 2019 , organization=
2019
-
[5]
arXiv preprint arXiv:1805.07226 , year=
Sequential Neural Likelihood: Fast Likelihood-free Inference with Autoregressive Flows , author=. arXiv preprint arXiv:1805.07226 , year=
-
[6]
Massive optimal data compression and density estimation for scalable, likelihood-free inference in cosmology. , keywords =. 2018. doi:10.1093/mnras/sty819 , archivePrefix =. 1801.01497 , primaryClass =
work page internal anchor Pith review Pith/arXiv arXiv doi:10.1093/mnras/sty819 2018
-
[7]
The redshift evolution of escape fraction of hydrogen ionizing photons from galaxies
The redshift evolution of escape fraction of hydrogen ionizing photons from galaxies. , keywords =. doi:10.1093/mnras/stw192 , archivePrefix =. 1510.04700 , primaryClass =
work page internal anchor Pith review Pith/arXiv arXiv doi:10.1093/mnras/stw192
-
[8]
CONTACT: Circumgalactic Observations of Nuv-shifted Transitions Across Cosmic Time
-
[9]
The Power Spectrum of the Lyman-$\alpha$ Forest at z < 0.5
The power spectrum of the Lyman- Forest at z < 0.5. , keywords =. 2019. doi:10.1093/mnras/stz344 , archivePrefix =. 1808.05605 , primaryClass =
work page internal anchor Pith review Pith/arXiv arXiv doi:10.1093/mnras/stz344 2019
-
[11]
MNRAS , archivePrefix = "arXiv", eprint =
The Lyman forest in optically thin hydrodynamical simulations. MNRAS , archivePrefix = "arXiv", eprint =. doi:10.1093/mnras/stu2377 , adsurl =
-
[12]
Lehner, N. and Howk, J. C. and Tripp, T. M. and Tumlinson, J. and Prochaska, J. X. and O'Meara, J. M. and Thom, C. and Werk, J. K. and Fox, A. J. and Ribaudo, J. , year=. THE BIMODAL METALLICITY DISTRIBUTION OF THE COOL CIRCUMGALACTIC MEDIUM ATz≲ 1 , volume=. The Astrophysical Journal , publisher=. doi:10.1088/0004-637x/770/2/138 , number=
-
[13]
and Lehner, Nicolas and Howk, J
Wotta, Christopher B. and Lehner, Nicolas and Howk, J. Christopher and O'Meara, John M. and Oppenheimer, Benjamin D. and Cooksey, Kathy L. , year=. The COS CGM Compendium. II. Metallicities of the Partial and Lyman Limit Systems at z ≲ 1 , volume=. The Astrophysical Journal , publisher=. doi:10.3847/1538-4357/aafb74 , number=
-
[14]
, archivePrefix = "arXiv", eprint =
Implications of an updated ultraviolet background for the ionization mechanisms of intervening Ne VIII absorbers. , archivePrefix = "arXiv", eprint =. doi:10.1093/mnras/stw3265 , adsurl =
-
[15]
Gauging Metallicity of Diffuse Gas Under An Uncertain Ionizing Radiation Field
Gauging Metallicity of Diffuse Gas under an Uncertain Ionizing Radiation Field. , keywords =. doi:10.3847/2041-8213/aa762d , archivePrefix =. 1706.04645 , primaryClass =
work page internal anchor Pith review Pith/arXiv arXiv doi:10.3847/2041-8213/aa762d 2041
-
[16]
A Novel Statistical Method for Measuring the Temperature-Density Relation in the IGM Using the b-N _ HI Distribution of Absorbers in the Ly Forest. ApJ , keywords =. 2019. doi:10.3847/1538-4357/ab1418 , archivePrefix =. 1903.11940 , primaryClass =
work page internal anchor Pith review Pith/arXiv arXiv doi:10.3847/1538-4357/ab1418 2019
-
[17]
Advances in Neural Information Processing Systems , pages=
Fast -free inference of simulation models with Bayesian conditional density estimation , author=. Advances in Neural Information Processing Systems , pages=
-
[18]
ApJ , archivePrefix = "arXiv", eprint =
A New Measurement of the Temperature-density Relation of the IGM from Voigt Profile Fitting. ApJ , archivePrefix = "arXiv", eprint =. doi:10.3847/1538-4357/aada86 , adsurl =
-
[19]
arXiv e-prints , keywords =
Masked Autoregressive Flow for Density Estimation. arXiv e-prints , keywords =. 2017
2017
-
[20]
, author =
Emcee: The. , author =. 2013 , pages =
2013
-
[21]
CAMCoS , author =
Ensemble Samplers with Affine Invariance , volume =. CAMCoS , author =. 2010 , pages =
2010
-
[22]
On the evolution of the HI column density distribution in cosmological simulations
On the evolution of the H I column density distribution in cosmological simulations. , keywords =. doi:10.1093/mnras/stt066 , archivePrefix =. 1210.7808 , primaryClass =
work page internal anchor Pith review Pith/arXiv arXiv doi:10.1093/mnras/stt066
-
[23]
A New Calculation of the Ionizing Background Spectrum and the Effects of HeII Reionization
A New Calculation of the Ionizing Background Spectrum and the Effects of He II Reionization. , keywords =. doi:10.1088/0004-637X/703/2/1416 , archivePrefix =. 0901.4554 , primaryClass =
work page internal anchor Pith review Pith/arXiv arXiv doi:10.1088/0004-637x/703/2/1416
-
[24]
ApJ , archivePrefix = "arXiv", eprint =
Evolution of the Intergalactic Opacity: Implications for the Ionizing Background, Cosmic Star Formation, and Quasar Activity. ApJ , archivePrefix = "arXiv", eprint =. doi:10.1086/592289 , adsurl =
-
[25]
E pur si muove: Galilean-invariant cosmological hydrodynamical simulations on a moving mesh. , keywords =. doi:10.1111/j.1365-2966.2009.15715.x , archivePrefix =. 0901.4107 , primaryClass =
-
[26]
HST/COS Observations of the Quasar HE 2347-4342: Probing the Epoch of He II Patchy Reionization at Redshifts z = 2.4-2.9. , keywords =. doi:10.1088/0004-637X/722/2/1312 , adsurl =
-
[27]
Fast likelihood-free cosmology with neural density estimators and active learning
Fast likelihood-free cosmology with neural density estimators and active learning. , keywords =. doi:10.1093/mnras/stz1960 , archivePrefix =. 1903.00007 , primaryClass =
work page internal anchor Pith review Pith/arXiv arXiv doi:10.1093/mnras/stz1960 1903
-
[28]
New Constraints on IGM Thermal Evolution from the Ly{\alpha} Forest Power Spectrum
New Constraints on IGM Thermal Evolution from the Ly Forest Power Spectrum. , keywords =. doi:10.3847/1538-4357/aafad1 , archivePrefix =. 1808.04367 , primaryClass =
work page internal anchor Pith review Pith/arXiv arXiv doi:10.3847/1538-4357/aafad1
-
[29]
VizieR Online Data Catalog: HST/COS survey of z<0.9 AGNs. I. (Danforth+, 2016). VizieR Online Data Catalog , keywords =
2016
-
[30]
Nyx: A Massively Parallel AMR Code for Computational Cosmology
Nyx: A Massively Parallel AMR Code for Computational Cosmology. , keywords =. doi:10.1088/0004-637X/765/1/39 , archivePrefix =. 1301.4498 , primaryClass =
work page internal anchor Pith review Pith/arXiv arXiv doi:10.1088/0004-637x/765/1/39
-
[31]
Detection of extended He II reionization in the temperature evolution of the intergalactic medium. , keywords =. doi:10.1111/j.1365-2966.2010.17507.x , archivePrefix =. 1008.2622 , primaryClass =
-
[32]
Radiative Transfer in a Clumpy Universe. IV. New Synthesis Models of the Cosmic UV/X-Ray Background. , keywords =. doi:10.1088/0004-637X/746/2/125 , archivePrefix =. 1105.2039 , primaryClass =
work page internal anchor Pith review Pith/arXiv arXiv doi:10.1088/0004-637x/746/2/125 2039
-
[33]
The intergalactic medium over the last 10 billion years - I. Ly absorption and physical conditions. , keywords =. doi:10.1111/j.1365-2966.2010.17279.x , archivePrefix =. 1005.2421 , primaryClass =
-
[34]
Critical Star Formation Rates for Reionization: Full Reionization Occurs at Redshift z 7. , keywords =. doi:10.1088/0004-637X/747/2/100 , adsurl =
-
[35]
Voigt profile fitting to quasar absorption lines: an analytic approximation to the Voigt-Hjerting function. , keywords =. doi:10.1111/j.1365-2966.2006.10450.x , archivePrefix =. astro-ph/0602124 , primaryClass =
-
[36]
Effects of Photoionization and Photoheating on Ly Forest Properties from Cholla Cosmological Simulations. , keywords =. doi:10.3847/1538-4357/abed5a , archivePrefix =. 2009.06652 , primaryClass =
-
[37]
Cosmic Reionization and Early Star-forming Galaxies: A Joint Analysis of New Constraints from Planck and the Hubble Space Telescope. ApJL , archivePrefix = "arXiv", eprint =. doi:10.1088/2041-8205/802/2/L19 , adsurl =
-
[38]
MNRAS , archivePrefix = "arXiv", eprint =
Model-independent evidence in favour of an end to reionization by z 6. MNRAS , archivePrefix = "arXiv", eprint =. doi:10.1093/mnras/stu2449 , adsurl =
-
[39]
The He II Lyman-alpha opacity of the universe. , keywords =. doi:10.1086/187546 , adsurl =
-
[40]
Reionization of the Inhomogeneous Universe. , eprint =. doi:10.1086/308330 , adsurl =
-
[41]
Apj , archivePrefix = "arXiv", eprint =
He II Reionization and its Effect on the Intergalactic Medium. Apj , archivePrefix = "arXiv", eprint =. doi:10.1088/0004-637X/694/2/842 , adsurl =
-
[42]
Models of the Thermal Evolution of the Intergalactic Medium After Reionization
Models of the thermal evolution of the intergalactic medium after reionization. , keywords =. doi:10.1093/mnras/stw1117 , archivePrefix =. 1511.05992 , primaryClass =
work page internal anchor Pith review Pith/arXiv arXiv doi:10.1093/mnras/stw1117
-
[43]
, archivePrefix = "arXiv", eprint =
The Evolution of the Helium-ionizing Background at z \ 2-3. , archivePrefix = "arXiv", eprint =. doi:10.1088/0004-637X/706/2/970 , adsurl =
-
[44]
MNRAS , archivePrefix = "arXiv", eprint =
The imprint of inhomogeneous He II reionization on the H I and He II Ly forest. MNRAS , archivePrefix = "arXiv", eprint =. doi:10.1093/mnras/stt1510 , adsurl =
-
[45]
, archivePrefix = "arXiv", eprint =
AGN-driven helium reionization and the incidence of extended He III regions at redshift z 3. , archivePrefix = "arXiv", eprint =. doi:10.1093/mnras/stu2035 , adsurl =
-
[46]
Hubble Space Telescope/Cosmic Origins Spectrograph Observations of the Quasar Q0302-003: Probing the He II Reionization Epoch and QSO Proximity Effects. , keywords =. doi:10.1088/0004-637X/784/1/42 , adsurl =
-
[47]
Measuring the galaxy-mass and galaxy-dust correlations through magnification and reddening. , keywords =. doi:10.1111/j.1365-2966.2010.16486.x , archivePrefix =. 0902.4240 , primaryClass =
-
[48]
The survival and entrainment of molecules and dust in galactic winds. , keywords =. doi:10.1093/mnras/stae1113 , archivePrefix =. 2311.04275 , primaryClass =
-
[49]
, archivePrefix = "arXiv", eprint =
Semi-numeric simulations of helium reionization and the fluctuating radiation background. , archivePrefix = "arXiv", eprint =. doi:10.1093/mnras/stu374 , adsurl =
-
[50]
ArXiv e-prints , archivePrefix = "arXiv", eprint =
The Evolution of the HeII-Ionizing Background at Redshifts 2.3 z 3.8 Inferred from a Statistical Sample of 24 HST/COS HeII Ly Absorption Spectra. ArXiv e-prints , archivePrefix = "arXiv", eprint =
-
[51]
ApJl , archivePrefix = "arXiv", eprint =
The End of Helium Reionization at z \ = 2.7 Inferred from Cosmic Variance in HST/COS He II Ly Absorption Spectra. ApJl , archivePrefix = "arXiv", eprint =. doi:10.1088/2041-8205/733/2/L24 , adsurl =
-
[52]
MNRAS , eprint =
Equation of state of the photoionized intergalactic medium. MNRAS , eprint =
-
[54]
On the Density of Neutral Hydrogen in Intergalactic Space. ApJ , year = 1965, month = nov, volume = 142, pages =. doi:10.1086/148444 , adsurl =
-
[55]
Apj , year = 1971, month = mar, volume = 164, pages =
The Absorption-Line Spectrum of 4c 05.34. Apj , year = 1971, month = mar, volume = 164, pages =. doi:10.1086/180695 , adsurl =
-
[56]
Optical spectra of the central cluster galaxies
Measuring the equation of state of the intergalactic medium. MNRAS , eprint =. doi:10.1046/j.1365-8711.1999.02956.x , adsurl =
-
[57]
The Evolution of the Effective Equation of State of the Intergalactic Medium. ApJ , eprint =. doi:10.1086/308733 , adsurl =
-
[58]
A Measurement of the Temperature-Density Relation in the Intergalactic Medium Using a New Ly Absorption-Line Fitting Method. ApJ , eprint =. doi:10.1086/323426 , adsurl =
-
[59]
The thermal history of the intergalactic medium ^ *. MNRAS , eprint =. doi:10.1046/j.1365-8711.2000.03815.x , adsurl =
-
[63]
ArXiv e-prints , archivePrefix = "arXiv", eprint =
Estimation of the temperature-density relation in the intergalactic medium at z 2-4 via Ly forest. ArXiv e-prints , archivePrefix = "arXiv", eprint =
-
[64]
ArXiv e-prints , archivePrefix = "arXiv", eprint =
Measuring the temperature and profiles of Lyman- absorbers. ArXiv e-prints , archivePrefix = "arXiv", eprint =
-
[65]
The Evolution of the Intergalactic Medium
The Evolution of the Intergalactic Medium. , keywords =. doi:10.1146/annurev-astro-082214-122355 , archivePrefix =. 1512.00086 , primaryClass =
work page internal anchor Pith review Pith/arXiv arXiv doi:10.1146/annurev-astro-082214-122355
-
[66]
VoIgt profile Parameter Estimation Routine (VIPER): H I photoionization rate at z<0.5
VoIgt profile Parameter Estimation Routine (viper): H I photoionization rate at z < 0.5. , keywords =. doi:10.1093/mnras/stx248 , archivePrefix =. 1610.06572 , primaryClass =
work page internal anchor Pith review Pith/arXiv arXiv doi:10.1093/mnras/stx248
-
[67]
Efficient adiabatic hydrodynamical simulations of the high-redshift intergalactic medium
Efficient adiabatic hydrodynamical simulations of the high-redshift intergalactic medium. , keywords =. doi:10.1093/mnras/stx2859 , archivePrefix =. 1705.05374 , primaryClass =
work page internal anchor Pith review Pith/arXiv arXiv doi:10.1093/mnras/stx2859
-
[68]
Diagnosing galactic feedback with the line broadening in the low redshift Lyman-alpha forest
Diagnosing galactic feedback with line broadening in the low-redshift Ly forest. , keywords =. doi:10.1093/mnrasl/slx004 , archivePrefix =. 1610.02046 , primaryClass =
work page internal anchor Pith review Pith/arXiv arXiv doi:10.1093/mnrasl/slx004
-
[69]
The effect of stellar and AGN feedback on the low-redshift Lyman forest in the Sherwood simulation suite. , keywords =. doi:10.1093/mnras/stx1648 , archivePrefix =. 1706.04790 , primaryClass =
work page internal anchor Pith review Pith/arXiv arXiv doi:10.1093/mnras/stx1648
-
[70]
Galaxies and Gas in a Cold Dark Matter Universe. , keywords =. doi:10.1086/186619 , adsurl =
-
[71]
Planck 2013 results. XVI. Cosmological parameters. , keywords =. doi:10.1051/0004-6361/201321591 , archivePrefix =. 1303.5076 , primaryClass =
work page internal anchor Pith review Pith/arXiv arXiv doi:10.1051/0004-6361/201321591 2013
-
[72]
VPFIT: Voigt profile fitting program
-
[73]
McQuinn, Matthew and Upton Sanderbeck, Phoebe R. , year=. On the intergalactic temperature–density relation , volume=. Monthly Notices of the Royal Astronomical Society , publisher=. doi:10.1093/mnras/stv2675 , number=
-
[74]
Evolution of the AGN UV luminosity function from redshift 7.5
Evolution of the AGN UV luminosity function from redshift 7.5. , keywords =. doi:10.1093/mnras/stz1493 , archivePrefix =. 1807.09774 , primaryClass =
work page internal anchor Pith review Pith/arXiv arXiv doi:10.1093/mnras/stz1493
-
[75]
The Astrophysical Journal , abstract =
Matias Zaldarriaga and Lam Hui and Max Tegmark , title =. The Astrophysical Journal , abstract =. doi:10.1086/321652 , url =
-
[76]
Hennawi and Hector Hiss and Jose O
Michael Walther and Joseph F. Hennawi and Hector Hiss and Jose O. A New Precision Measurement of the Small-scale Line-of-sight Power Spectrum of the Ly Forest , journal =. doi:10.3847/1538-4357/aa9c81 , url =
-
[77]
Possible evidence for an inverted temperature-density relation in the intergalactic medium from the flux distribution of the Ly forest. , keywords =. doi:10.1111/j.1365-2966.2008.13114.x , archivePrefix =. 0711.2064 , primaryClass =
-
[78]
Khee-Gan Lee and Joseph F. Hennawi and David N. Spergel and David H. Weinberg and David W. Hogg and Matteo Viel and James S. Bolton and Stephen Bailey and Matthew M. Pieri and William Carithers and David J. Schlegel and Britt Lundgren and Nathalie Palanque-Delabrouille and Nao Suzuki and Donald P. Schneider and Christophe Y. The Astrophysical Journal , ab...
-
[79]
Viel, Matteo and Bolton, James S. and Haehnelt, Martin G. , title = ". Monthly Notices of the Royal Astronomical Society: Letters , volume =. 2009 , month =. doi:10.1111/j.1745-3933.2009.00720.x , url =
-
[80]
The Astrophysical Journal , abstract =
Tom Theuns and Joop Schaye and Saleem Zaroubi and Tae-Sun Kim and Panayiotis Tzanavaris and Bob Carswell , title =. The Astrophysical Journal , abstract =. doi:10.1086/339998 , url =
-
[81]
A Measurement of Small Scale Structure in the 2.2 < z < 4.2 Lyman-alpha Forest
A Measurement of Small-scale Structure in the 2.2 <= z <= 4.2 Ly Forest. , keywords =. doi:10.1088/0004-637X/718/1/199 , archivePrefix =. 0909.5210 , primaryClass =
work page internal anchor Pith review Pith/arXiv arXiv doi:10.1088/0004-637x/718/1/199
-
[82]
The intergalactic medium thermal history at redshift z = 1.7-3.2 from the Ly forest: a comparison of measurements using wavelets and the flux distribution. , keywords =. doi:10.1111/j.1365-2966.2012.21223.x , archivePrefix =. 1202.3577 , primaryClass =
-
[83]
The thermal history of the intergalactic medium down to redshift z=1.5: a new curvature measurement
The thermal history of the intergalactic medium down to redshift z = 1.5: a new curvature measurement. , keywords =. doi:10.1093/mnras/stu660 , archivePrefix =. 1404.1083 , primaryClass =
work page internal anchor Pith review Pith/arXiv arXiv doi:10.1093/mnras/stu660
-
[84]
A New Method to Directly Measure the Jeans Scale of the Intergalactic Medium Using Close Quasar Pairs. , keywords =. doi:10.1088/0004-637X/775/2/81 , archivePrefix =. 1305.0210 , primaryClass =
work page internal anchor Pith review Pith/arXiv arXiv doi:10.1088/0004-637x/775/2/81
-
[85]
Measurement of the small-scale structure of the intergalactic medium using close quasar pairs
Measurement of the small-scale structure of the intergalactic medium using close quasar pairs. Science , keywords =. doi:10.1126/science.aaf9346 , archivePrefix =. 1704.08366 , primaryClass =
work page internal anchor Pith review Pith/arXiv arXiv doi:10.1126/science.aaf9346
discussion (0)
Sign in with ORCID, Apple, or X to comment. Anyone can read and Pith papers without signing in.