Locating nuclear-powered submarines with antineutrinos
Pith reviewed 2026-05-19 19:38 UTC · model grok-4.3
pith:K2NMCANN Add to your LaTeX paper
What is a Pith Number?\usepackage{pith}
\pithnumber{K2NMCANN}
Prints a linked pith:K2NMCANN badge after your title and writes the identifier into PDF metadata. Compiles on arXiv with no extra files. Learn more
The pith
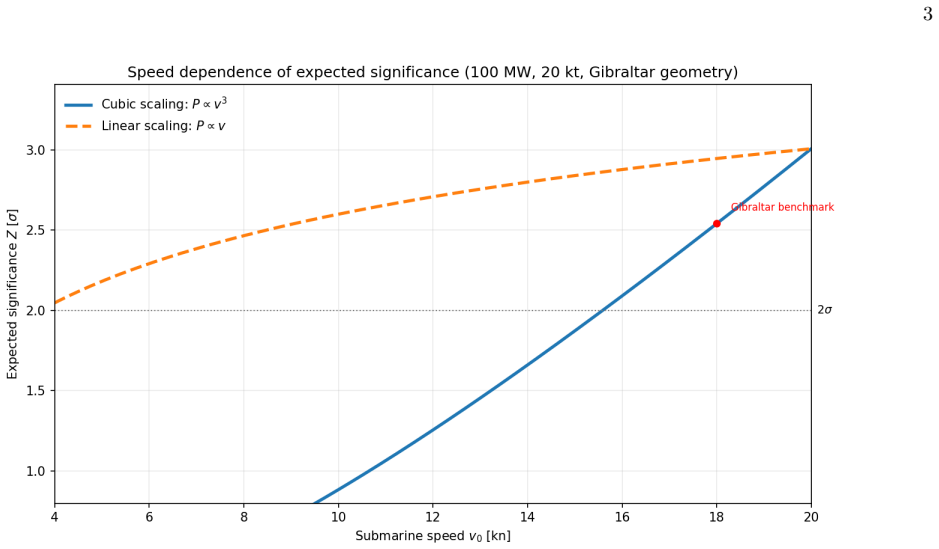
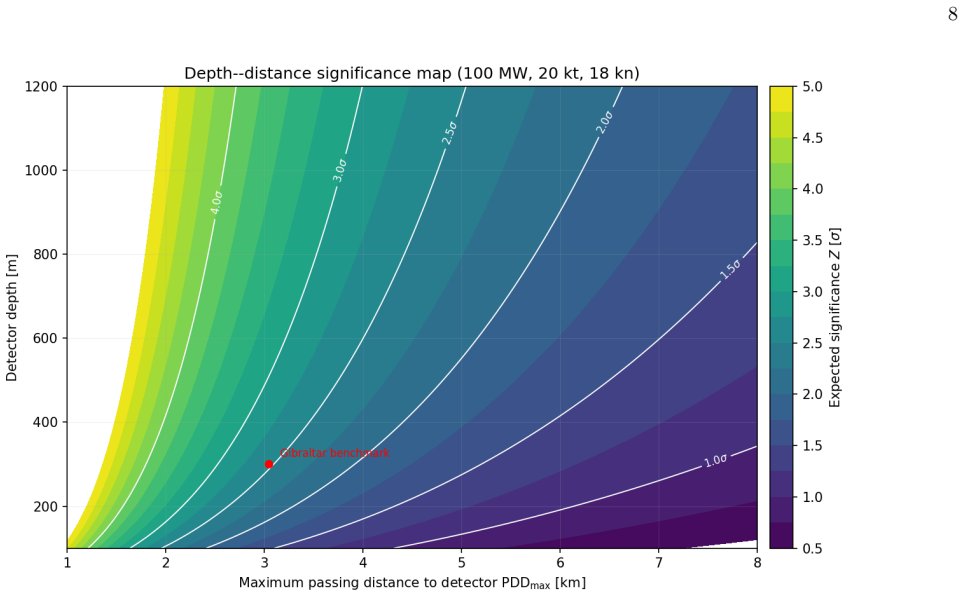
A 20 kt antineutrino detector achieves a benchmark detection score of 2.54 for nuclear submarines in the Strait of Gibraltar under conservative assumptions.
A machine-rendered reading of the paper's core claim, the machinery that carries it, and where it could break.
Core claim
Using analytic scaling relations and numerical estimates, detectability depends primarily on closest approach, detector depth, and deployed mass. For representative assumptions, a 20 kt detector in the Strait of Gibraltar reaches a local benchmark score Z_A ≃ 2.54 for an assumed 100 MW thermal-power sensitivity-study case in a conservative worst-case transit (with Poisson operating point (P_FA, P_det) ≃ (5.5×10^{-3}, 0.51) at threshold k=2), while a three-detector line raises the mapped score to Z_A ≃ 4.66. For broad ocean passages such as GIUK, required detector counts are substantially larger; in the baseline maximum passing distance PDD_max=5 km geometry, about 80 detectors yield only Z_A
What carries the argument
Analytic scaling relations that map antineutrino flux from a submarine reactor to a benchmark score Z_A based on detector mass, depth, and minimum approach distance using Poisson statistics for signal and background.
If this is right
- A 20 kt detector in the Strait of Gibraltar reaches Z_A ≃ 2.54 for 100 MW submarines in conservative worst-case transits.
- A three-detector line in the same location raises the mapped score to Z_A ≃ 4.66.
- In wider passages like the GIUK gap with 5 km maximum passing distance, about 80 detectors are needed to reach only Z_A ∼ 1.6.
- Detection performance is governed by the submarine's closest approach, detector depth, and total deployed mass.
Where Pith is reading between the lines
- The barrier concept could be extended to other narrow strategic passages by adjusting detector count and spacing according to passage width.
- Prototype deployments in known transit routes would allow direct validation of the predicted event rates against the scaling model.
- Integration with existing acoustic monitoring systems could create layered detection that compensates for limitations in each method alone.
Load-bearing premise
The analytic scaling relations and numerical estimates rest on the validity of chosen representative values for detector efficiency, background rates, and submarine reactor power output under real-world conditions.
What would settle it
Recording the actual antineutrino event rate from a known nuclear submarine transit at the modeled closest approach and depth, then comparing it directly to the rate predicted by the scaling relations for a 20 kt detector.
Figures


read the original abstract
Nuclear-powered submarines are difficult to track with conventional methods in congested waterways. We revisit antineutrino-based detection as a barrier concept, analogous to a neutrino-enabled SOSUS-style fence in strategic straits. Using analytic scaling relations and numerical estimates, we show that detectability depends primarily on closest approach, detector depth, and deployed mass. For representative assumptions, a 20\,kt detector in the Strait of Gibraltar reaches a local benchmark score $Z_A\simeq2.54$ for an assumed 100\,MW thermal-power sensitivity-study case in a conservative worst-case transit (with Poisson operating point $(P_\mathrm{FA},P_\mathrm{det})\simeq(5.5\times10^{-3},0.51)$ at threshold $k=2$), while a three-detector line raises the mapped score to $Z_A\simeq4.66$. For broad ocean passages such as GIUK, required detector counts are substantially larger; in the baseline maximum passing distance $\mathrm{PDD}_{\max}=5$\,km geometry, about 80 detectors yield only $Z_A\sim1.6$. The paper outlines detector technology choices, statistical assumptions, and deployment constraints for a first-generation feasibility assessment.
Editorial analysis
A structured set of objections, weighed in public.
Referee Report
Summary. The manuscript presents a feasibility study for detecting nuclear-powered submarines using antineutrino emissions in strategic maritime passages. Employing analytic scaling relations and Poisson statistics, it calculates a benchmark score Z_A for detectability. For a 20 kt detector in the Strait of Gibraltar, it reports Z_A ≃ 2.54 for a 100 MW thermal power case in a conservative worst-case transit scenario, corresponding to a Poisson operating point (P_FA, P_det) ≃ (5.5×10^{-3}, 0.51) at threshold k=2. A three-detector line is shown to improve this to Z_A ≃ 4.66. The paper also estimates requirements for larger passages like the GIUK gap and discusses detector technologies and deployment constraints.
Significance. If the representative assumptions on detector efficiency, background rates, and submarine reactor power are validated, this approach could provide a novel, passive method for submarine detection in chokepoints, complementing traditional acoustic systems. The analytic framework offers a transparent starting point for further engineering studies. The use of standard neutrino physics and explicit Poisson-based estimates is a strength, allowing for clear identification of key parameters.
major comments (2)
- [Abstract] Abstract: The reported Z_A ≃2.54 (and the mapped value 4.66 for three detectors) is obtained from specific representative values for detector efficiency, background rate, and 100 MW thermal power. These parameters directly set the expected signal and background counts that determine the Poisson probabilities at the operating point (P_FA, P_det) ≃ (5.5×10^{-3},0.51) for k=2. Without a sensitivity study or explicit justification of these inputs for the marine environment, the central numerical claims cannot be verified from the given scaling relations alone.
- [Abstract] Abstract: The benchmark score Z_A is constructed internally from the paper's Poisson operating points and scaling relations. Clarification is required on whether Z_A is an independent figure of merit or a direct mapping from the chosen (P_FA, P_det) pair; this affects how the quoted values should be interpreted as evidence of feasibility.
minor comments (1)
- The abstract introduces PDD_max without a prior definition; this quantity should be defined explicitly in the main text when discussing the GIUK geometry.
Simulated Author's Rebuttal
We thank the referee for the careful and constructive review of our manuscript on antineutrino-based detection of nuclear submarines. The comments highlight important points about parameter justification and the interpretation of Z_A. We have revised the abstract and main text to provide additional justification, include a sensitivity study, and clarify the construction of the benchmark score. Our point-by-point responses follow.
read point-by-point responses
-
Referee: [Abstract] Abstract: The reported Z_A ≃2.54 (and the mapped value 4.66 for three detectors) is obtained from specific representative values for detector efficiency, background rate, and 100 MW thermal power. These parameters directly set the expected signal and background counts that determine the Poisson probabilities at the operating point (P_FA, P_det) ≃ (5.5×10^{-3},0.51) for k=2. Without a sensitivity study or explicit justification of these inputs for the marine environment, the central numerical claims cannot be verified from the given scaling relations alone.
Authors: We agree that the quoted Z_A values depend on the specific representative inputs for efficiency, background, and reactor power. The manuscript already states these as representative assumptions and supplies the underlying analytic scaling relations, allowing substitution of other values. To strengthen the presentation, the revised version adds explicit justification for the chosen marine-environment parameters (drawing on standard reactor antineutrino spectra and published background estimates) together with a sensitivity study that varies each input by ±30 %. The updated results confirm that Z_A remains above 2.0 across the explored range, and a new table summarizing the sensitivity will be included. revision: yes
-
Referee: [Abstract] Abstract: The benchmark score Z_A is constructed internally from the paper's Poisson operating points and scaling relations. Clarification is required on whether Z_A is an independent figure of merit or a direct mapping from the chosen (P_FA, P_det) pair; this affects how the quoted values should be interpreted as evidence of feasibility.
Authors: Z_A is constructed directly from the chosen Poisson operating point (P_FA, P_det) at threshold k=2, scaled by the geometric and efficiency factors in the analytic relations; it is therefore a derived internal benchmark rather than an independent figure of merit. We have revised the abstract and the opening of the methods section to state this definition explicitly, making clear that the reported values quantify detectability only for the stated operating point and assumptions. revision: yes
Circularity Check
No significant circularity; derivation is self-contained
full rationale
The paper computes detectability metrics from standard antineutrino flux formulas, Poisson statistics, and explicitly stated representative inputs (100 MW thermal power, detector efficiency, background rates, geometry). The benchmark score Z_A is a derived figure of merit obtained by plugging those inputs into the Poisson operating point (P_FA, P_det) at threshold k=2; this is a direct calculation, not a self-definitional loop or a fitted parameter renamed as a prediction. No self-citations appear in the provided text, no uniqueness theorems are invoked, and no ansatz is smuggled via prior work. The central claims rest on the validity of the conservative assumptions rather than reducing to the inputs by construction.
Axiom & Free-Parameter Ledger
free parameters (2)
- detector mass
- submarine thermal power
axioms (2)
- standard math Antineutrinos from nuclear fission can be detected via inverse beta decay in large scintillator or water detectors.
- domain assumption Signal and background counts follow Poisson statistics for threshold setting.
Lean theorems connected to this paper
-
IndisputableMonolith/Cost/FunctionalEquation.leanwashburn_uniqueness_aczel unclear?
unclearRelation between the paper passage and the cited Recognition theorem.
The neutrino signal rate is then given by s(t) = σ_IBD N_A f_p M_D (P_max / (4π E_fission)) (v0/vmax)^3 1/r(t)^2
What do these tags mean?
- matches
- The paper's claim is directly supported by a theorem in the formal canon.
- supports
- The theorem supports part of the paper's argument, but the paper may add assumptions or extra steps.
- extends
- The paper goes beyond the formal theorem; the theorem is a base layer rather than the whole result.
- uses
- The paper appears to rely on the theorem as machinery.
- contradicts
- The paper's claim conflicts with a theorem or certificate in the canon.
- unclear
- Pith found a possible connection, but the passage is too broad, indirect, or ambiguous to say the theorem truly supports the claim.
Reference graph
Works this paper leans on
-
[1]
Central Intelligence Agency,Soviet Antisubmarine Warfare: Current Capabilities and Priorities, Tech. Rep. SR IR 72-13-S (CIA, 1972) approved for release 2017/06/14
work page 1972
- [2]
-
[3]
First Results from KamLAND: Evidence for Reactor Anti-Neutrino Disappearance
K. Eguchiet al.(KamLAND), “First results from KamLAND: Evidence for reactor anti-neutrino disappearance,” Phys. Rev. Lett.90, 021802 (2003), arXiv:hep-ex/0212021 [hep-ex]
work page internal anchor Pith review Pith/arXiv arXiv 2003
-
[4]
Evidence for oscillation of atmospheric neutrinos
Y. Fukudaet al.(Super-Kamiokande), “Evidence for oscillation of atmospheric neutrinos,” Phys. Rev. Lett.81, 1562–1567 (1998), arXiv:hep-ex/9807003 [hep-ex]
work page internal anchor Pith review Pith/arXiv arXiv 1998
-
[5]
Observation of electron-antineutrino disappearance at Daya Bay
F. P. Anet al.(Daya Bay), “Observation of electron-antineutrino disappearance at Daya Bay,” Phys. Rev. Lett.108, 171803 (2012), arXiv:1203.1669 [hep-ex]
work page internal anchor Pith review Pith/arXiv arXiv 2012
-
[6]
GADZOOKS! Antineutrino Spectroscopy with Large Water Cerenkov Detectors
John F. Beacom and Mark R. Vagins, “GADZOOKS! Anti-neutrino spectroscopy with large water Cherenkov detectors,” Phys. Rev. Lett.93, 171101 (2004), arXiv:hep-ph/0309300 [hep-ph]
work page internal anchor Pith review Pith/arXiv arXiv 2004
-
[7]
Observation of Coherent Elastic Neutrino-Nucleus Scattering
D. Akimovet al.(COHERENT), “Observation of Coherent Elastic Neutrino-Nucleus Scattering,” Science357, 1123–1126 (2017), arXiv:1708.01294 [nucl-ex]. 11
work page internal anchor Pith review Pith/arXiv arXiv 2017
-
[8]
Detection of the free neutrino: a confirmation,
C. L. Cowan, F. Reines, F. B. Harrison, H. W. Kruse, and A. D. McGuire, “Detection of the free neutrino: a confirmation,” Science124, 103–104 (1956)
work page 1956
-
[9]
From eV to EeV: Neutrino Cross Sections Across Energy Scales
J. A. Formaggio and G. P. Zeller, “From eV to EeV: Neutrino Cross Sections Across Energy Scales,” Rev. Mod. Phys.84, 1307–1341 (2012), arXiv:1305.7513 [hep-ex]
work page internal anchor Pith review Pith/arXiv arXiv 2012
-
[10]
Extraction of the 235U and 239Pu Antineutrino Spectra at Daya Bay,
D. Adeyet al.(Daya Bay), “Extraction of the 235U and 239Pu Antineutrino Spectra at Daya Bay,” Phys. Rev. Lett.123, 111801 (2019), arXiv:1904.07812 [hep-ex]
-
[11]
Reactor as a Source of Antineutrinos: Thermal Fission Energy
V. Kopeikin, L. Mikaelyan, and V. Sinev, “Reactor as a source of antineutrinos: Thermal fission energy,” Phys. Atom. Nucl.67, 1892–1899 (2004), [Yad. Fiz.67,1916(2004)], arXiv:hep-ph/0410100 [hep-ph]
work page internal anchor Pith review Pith/arXiv arXiv 2004
-
[12]
Asymptotic formulae for likelihood-based tests of new physics
Glen Cowan, Kyle Cranmer, Eilam Gross, and Ofer Vitells, “Asymptotic formulae for likelihood-based tests of new physics,” Eur. Phys. J.C71, 1554 (2011), arXiv:1007.1727 [physics.data-an]
work page internal anchor Pith review Pith/arXiv arXiv 2011
-
[13]
Milton Abramowitz and Irene A. Stegun, eds.,Handbook of Mathematical Functions with Formulas, Graphs, and Mathe- matical Tables(National Bureau of Standards, Washington, D.C., 1964)
work page 1964
-
[14]
Direct Measurement of Backgrounds using Reactor-Off Data in Double Chooz
Y. Abeet al.(Double Chooz), “Direct Measurement of Backgrounds using Reactor-Off Data in Double Chooz,” Phys. Rev. D87, 011102 (2013), arXiv:1210.3748 [hep-ex]
work page internal anchor Pith review Pith/arXiv arXiv 2013
-
[15]
C. Jollet (JUNO), “The JUNO experiment,”Proceedings, 30th Rencontres de Physique de La Vallee d’Aoste: La Thuile, Aosta Valley, Italy, March 6-12, 2016, Nuovo Cim.C39, 318 (2017)
work page 2016
-
[16]
Trial factors for the look elsewhere effect in high energy physics
Eilam Gross and Ofer Vitells, “Trial factors for the look elsewhere effect in high energy physics,” Eur. Phys. J.C70, 525–530 (2010), arXiv:1005.1891 [physics.data-an]. 12 Appendix A: Alternative Locations
work page internal anchor Pith review Pith/arXiv arXiv 2010
-
[17]
The Danish Straits 7 8 9 10 11 12 13 14 53 54 55 56 57 58 59 60 100 km Danish Straits 6@25km -600 -400 -200 0 (a) A map of the Danish strait. ● ● ● ● ● ● 0 20 000 40 000 60 000 80 000 100 000 120 000 140 000 -500 -400 -300 -200 -100 0 Distance[m] Depth[m] Danish Straits (b) A depth profile of the Danish strait. FIG. 11: The Danish Strait. The Danish strai...
-
[18]
Tsushima strait (Korea-Japan) The Tsushima Strait (between Korea and Japan) is another candidate for a regional barrier. A simplified geometry of roughly 40 km width and 300 m depth indicates strong sensitivity to detector spacing and threshold definition, similarly to the Danish case. In this revision we therefore do not quote fixed Tsushima module count...
discussion (0)
Sign in with ORCID, Apple, or X to comment. Anyone can read and Pith papers without signing in.