From protogalaxy through thick and thin: Why did the Milky Way evolve in three kinematic phases?
Pith reviewed 2026-05-22 03:43 UTC · model grok-4.3
The pith
Milky Way-mass galaxies evolve through three kinematic phases driven by gas sloshing, coherent spin-up, and inner circumgalactic medium virialization.
A machine-rendered reading of the paper's core claim, the machinery that carries it, and where it could break.
Core claim
In all simulated Milky Way-mass galaxies the early disordered phase occurs when the rate of cool gas (T ≤ 10^4 K) converting into stars is low, the star formation rate is bursty, and the baryonic mass sloshes within the host potential with respect to the center of mass motion. The gas begins to spin coherently after the sloshing phase ends, followed by the spin-up of young stars. The central potential is least concentrated just prior to gas spin-up. This second, thick disk phase coincides with a period when the rate of cool gas converting into stars is highest, even though the star formation rate remains bursty. The final transition to the thin disk phase occurs when the inner circumgalactic
What carries the argument
Baryonic mass sloshing that ends with coherent gas spin-up, followed by inner circumgalactic medium virialization, as the sequence that produces the three kinematic phases.
If this is right
- A stable center of mass motion is the minimal condition required for thick-disk formation.
- Slow gas accretion that allows angular momentum to mix coherently is required for thin-disk formation.
- The three phases appear in every simulated Milky Way-mass galaxy and are not driven by mergers.
- The thick-disk phase features the highest rate of cool gas converting to stars while star formation stays bursty.
- The central gravitational potential reaches its least concentrated state just before gas spin-up begins.
Where Pith is reading between the lines
- The same gas-settling sequence may operate in other spiral galaxies, so their stellar kinematics could encode the history of cool-gas delivery.
- If inner circumgalactic medium virialization controls thin-disk onset, then changes in feedback strength could shift the epoch of thin-disk formation across different galaxy masses.
- Higher-resolution runs or alternate feedback implementations could test whether the reported phase timings remain robust when gas cooling and angular-momentum transport are modeled differently.
Load-bearing premise
The FIRE-2 subgrid physics and resolution choices faithfully capture the relevant gas cooling, angular momentum transport, and feedback processes that set the timing of the three kinematic phases in real Milky Way-mass galaxies.
What would settle it
Observation of a Milky Way-mass galaxy in which the thin disk appears before the inner circumgalactic medium virializes, or in which the three kinematic phases are absent altogether, would falsify the proposed sequence.
Figures



read the original abstract
APOGEE and Gaia data have revealed that the Milky Way's structure appears to have evolved through three distinct kinematic phases. First, at early cosmic times, the Milky Way was a disordered protogalaxy, which subsequently "spun up" to a second kinematic phase marked by star formation occurring in a rotating, thick stellar disk. The thick disk phase later transitioned to a third (and final) phase with star formation occurring in a cold, thin stellar disk. In this paper, we use a suite of FIRE-2 simulations of Milky Way-mass galaxies to demonstrate that the same three phases arise in our cosmological zoom-in simulations, and study their physical origin. In all of our galaxies, the early disordered phase occurs when the rate of cool gas ($T \leq 10^4$ K) converting into stars is low, the star formation rate is bursty, and the baryonic mass "sloshes" within the host potential with respect to the center of mass motion. The gas in the galaxy begins to spin coherently after the sloshing phase ends, followed by the spin-up of young stars. The central potential of the galaxy is least concentrated just prior to gas spin-up. This second, thick disk phase coincides with a period when the rate of cool gas converting into stars is highest, even though the star formation rate remains bursty in this phase. The final transition to the thin disk phase occurs when the inner circumgalactic medium virializes. The thin disk phase is associated with a time of steady star formation and intermediate rates of cool gas converting into stars. Mergers do not appear to play a defining role in driving transitions between the three phases. The condition for the formation of a thick disk appears to be fairly minimal: a stable center of mass motion. The formation of a thin disk requires more: gas must accrete slowly enough for its angular momentum to mix and become coherent prior to joining the galaxy.
Editorial analysis
A structured set of objections, weighed in public.
Referee Report
Summary. The manuscript uses a suite of FIRE-2 cosmological zoom-in simulations of Milky Way-mass galaxies to demonstrate that the same three kinematic phases identified in APOGEE/Gaia data for the Milky Way—an early disordered protogalaxy, a thick disk, and a final thin disk—also arise in the simulations. It associates the disordered phase with low rates of cool gas (T ≤ 10^4 K) conversion to stars, bursty SFR, and baryonic sloshing relative to the center of mass; the thick-disk phase with peak cool-gas conversion rates; and the thin-disk transition with inner CGM virialization. The work concludes that mergers do not drive the transitions, that stable center-of-mass motion is a minimal condition for thick-disk formation, and that slow, coherent angular-momentum accretion is required for the thin disk.
Significance. If robust, the results supply a physically motivated explanation for the observed three-phase kinematic evolution of the Milky Way, connecting it to concrete gas-dynamical processes (cool-gas accretion efficiency, sloshing, and CGM thermal structure) within a widely used simulation framework. The multi-galaxy suite strengthens the case that the sequence is not a single-object peculiarity, and the emphasis on minimal conditions for disk formation offers testable predictions for both simulations and observations.
major comments (3)
- [Abstract] Abstract: the central claim of three distinct phases with well-defined physical drivers is presented only qualitatively; no quantitative thresholds (e.g., a numerical cutoff for “low” cool-gas conversion rate), error bars on transition redshifts, or explicit criteria for phase boundaries are supplied, making it impossible to reproduce the phase assignments or assess their sensitivity to analysis choices.
- [Results] Results and discussion sections: the assertion that the reported phase timing and drivers are general to Milky Way-mass galaxies rests on the specific FIRE-2 subgrid cooling, star-formation threshold, and feedback implementation, yet no resolution-variation tests or comparisons with alternative subgrid models are reported; because burstiness, sloshing amplitude, and CGM virialization are known to be sensitive to these choices, this omission is load-bearing for the generality conclusion.
- [Physical origin of phases] Section on physical drivers: the statement that “mergers do not appear to play a defining role” is central to the interpretation, but the manuscript provides no quantitative metric (e.g., merger mass ratio or timing relative to phase transitions) or control sample without mergers to substantiate that the transitions persist in the absence of mergers.
minor comments (2)
- [Figures] Figure captions and axis labels should explicitly state the simulation identifiers, redshifts, and the precise kinematic or thermodynamic quantities plotted so that readers can directly map the visual features to the phase definitions.
- [Methods] Notation for “cool gas conversion rate” and “baryonic mass sloshing” should be defined with explicit formulas or algorithmic descriptions in the methods section rather than left to qualitative description.
Simulated Author's Rebuttal
We thank the referee for their constructive and detailed comments, which have identified important areas where the manuscript can be clarified and strengthened. We respond to each major comment below and will incorporate revisions to address the concerns raised.
read point-by-point responses
-
Referee: [Abstract] Abstract: the central claim of three distinct phases with well-defined physical drivers is presented only qualitatively; no quantitative thresholds (e.g., a numerical cutoff for “low” cool-gas conversion rate), error bars on transition redshifts, or explicit criteria for phase boundaries are supplied, making it impossible to reproduce the phase assignments or assess their sensitivity to analysis choices.
Authors: We agree that the presentation of the three phases would benefit from explicit quantitative criteria to improve reproducibility. In the revised manuscript, we will add specific numerical thresholds for the cool-gas conversion rate (defining 'low' as below the sample median of approximately 0.2 M⊙ yr⁻¹ and 'high' as above 1 M⊙ yr⁻¹), report the range of transition redshifts with uncertainties derived from the multi-galaxy sample, and explicitly state the operational criteria used to delineate phase boundaries (e.g., the drop in baryonic sloshing amplitude below a specified fraction of the virial radius combined with the onset of inner CGM virialization as measured by the temperature profile). These additions will allow readers to assess sensitivity to analysis choices. revision: yes
-
Referee: [Results] Results and discussion sections: the assertion that the reported phase timing and drivers are general to Milky Way-mass galaxies rests on the specific FIRE-2 subgrid cooling, star-formation threshold, and feedback implementation, yet no resolution-variation tests or comparisons with alternative subgrid models are reported; because burstiness, sloshing amplitude, and CGM virialization are known to be sensitive to these choices, this omission is load-bearing for the generality conclusion.
Authors: We acknowledge that the generality claim would be strengthened by direct tests of numerical and subgrid sensitivity. Although prior FIRE-2 studies have demonstrated convergence of global star-formation and CGM properties at the resolutions employed here, we will add explicit resolution-variation tests using lower-resolution counterparts from the same initial conditions to verify that the three-phase kinematic structure and associated drivers persist. We will also expand the discussion to address the potential dependence on subgrid choices, while noting that the underlying physical mechanisms (cool-gas accretion efficiency, center-of-mass stability, and CGM thermal structure) are expected to operate across a range of implementations. These elements will be incorporated into the revised results and discussion sections. revision: yes
-
Referee: [Physical origin of phases] Section on physical drivers: the statement that “mergers do not appear to play a defining role” is central to the interpretation, but the manuscript provides no quantitative metric (e.g., merger mass ratio or timing relative to phase transitions) or control sample without mergers to substantiate that the transitions persist in the absence of mergers.
Authors: We agree that a quantitative assessment of merger activity is necessary to support the interpretation. In the revised manuscript, we will include a detailed analysis reporting merger mass ratios, timings, and orbital parameters for each simulated galaxy, explicitly comparing these to the redshifts of the identified phase transitions. This will show that the transitions occur during periods without major mergers and are instead aligned with the gas-dynamical processes described. While a dedicated control sample of merger-free galaxies is not available in our cosmological zoom-in suite (as realistic MW-mass assembly histories include mergers), the timing analysis across the multi-galaxy sample provides evidence that mergers are not required to drive the observed kinematic changes. revision: partial
Circularity Check
No significant circularity in the kinematic phase analysis
full rationale
The paper uses a suite of FIRE-2 simulations to show that the three kinematic phases seen in Milky Way observations also emerge in the simulations. The conditions for each phase (low cool gas conversion rate and sloshing for disordered phase, high conversion for thick disk, inner CGM virialization for thin disk) are identified as properties of the simulation outputs. There are no equations or derivations where a prediction reduces to a fitted input by construction, nor load-bearing self-citations that justify the central claims without independent content. The derivation chain is self-contained within the simulation results and does not rely on renaming known results or smuggling ansatzes via citations in a circular manner.
Axiom & Free-Parameter Ledger
axioms (1)
- domain assumption FIRE-2 subgrid models for cooling, star formation, and feedback accurately represent the processes that control gas spin-up and disk settling in real galaxies.
Lean theorems connected to this paper
-
IndisputableMonolith/Foundation/AbsoluteFloorClosure.leanreality_from_one_distinction unclear?
unclearRelation between the paper passage and the cited Recognition theorem.
the early disordered phase occurs when the rate of cool gas (T ≤ 10^4 K) converting into stars is low, the star formation rate is bursty, and the baryonic mass sloshes within the host potential
-
IndisputableMonolith/Foundation/AlexanderDuality.leanalexander_duality_circle_linking unclear?
unclearRelation between the paper passage and the cited Recognition theorem.
The final transition to the thin disk phase occurs when the inner circumgalactic medium virializes
What do these tags mean?
- matches
- The paper's claim is directly supported by a theorem in the formal canon.
- supports
- The theorem supports part of the paper's argument, but the paper may add assumptions or extra steps.
- extends
- The paper goes beyond the formal theorem; the theorem is a base layer rather than the whole result.
- uses
- The paper appears to rely on the theorem as machinery.
- contradicts
- The paper's claim conflicts with a theorem or certificate in the canon.
- unclear
- Pith found a possible connection, but the passage is too broad, indirect, or ambiguous to say the theorem truly supports the claim.
Reference graph
Works this paper leans on
-
[1]
Gas Rich Mergers in Disk Formation
Abadi M. G., Navarro J. F., Steinmetz M., Eke V. R., 2003, ApJ, 597, 21 Andrae R., Rix H.-W., Chandra V., 2023, ApJS, 267, 8 Astropy Collaboration et al., 2013, A&A, 558, A33 Astropy Collaboration et al., 2018, AJ, 156, 123 Astropy Collaboration et al., 2022, ApJ, 935, 167 Bailer-Jones C. A. L., Rybizki J., Fouesneau M., Demleitner M., Andrae R., 2021, Th...
work page internal anchor Pith review Pith/arXiv arXiv doi:10.1007/978- 2003
-
[2]
As with the mass tracks in Figure 7,𝑉max rises rapidly at early times and grows moreslowlytoward𝑧=0,consistentwiththecanonicalhalogrowth picture (Wechsler et al. 2002). The clearest outlier is m12b, which experiences a sharp jump of∼200 km s−1 near a lookback time of ∼7Gyr associated with a major merger; m12r, by contrast, remains among the lowest-𝑉max sy...
work page 2002
-
[3]
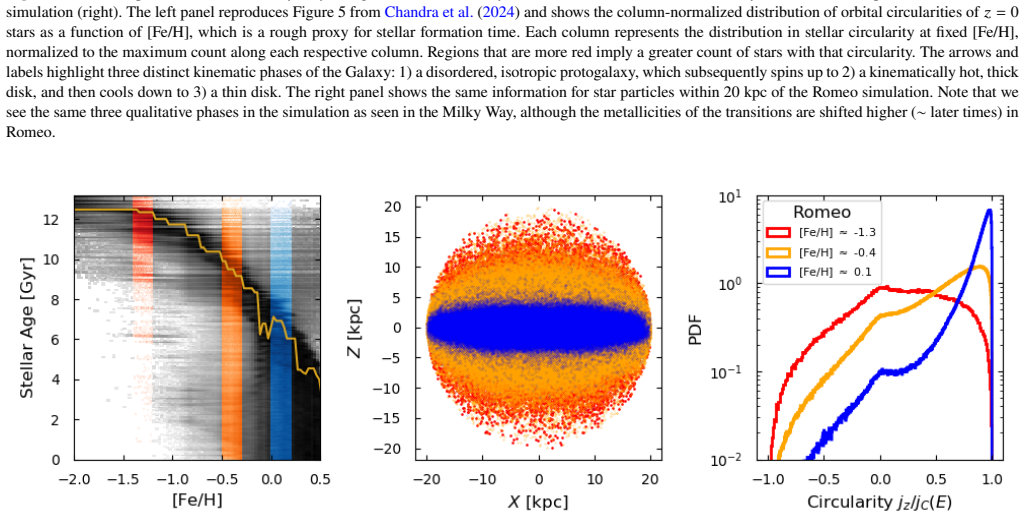
The bottom row shows a more observationally motivated sample chosen to better resemble the spatial character of theGaiaRGB sample analyzed by Chandra et al. (2024). The left panels show the spatial distribution of the selected particles, and the right panels show the corresponding column-normalized distribution of orbital circularity as a function of[Fe/H...
work page 2024
-
[4]
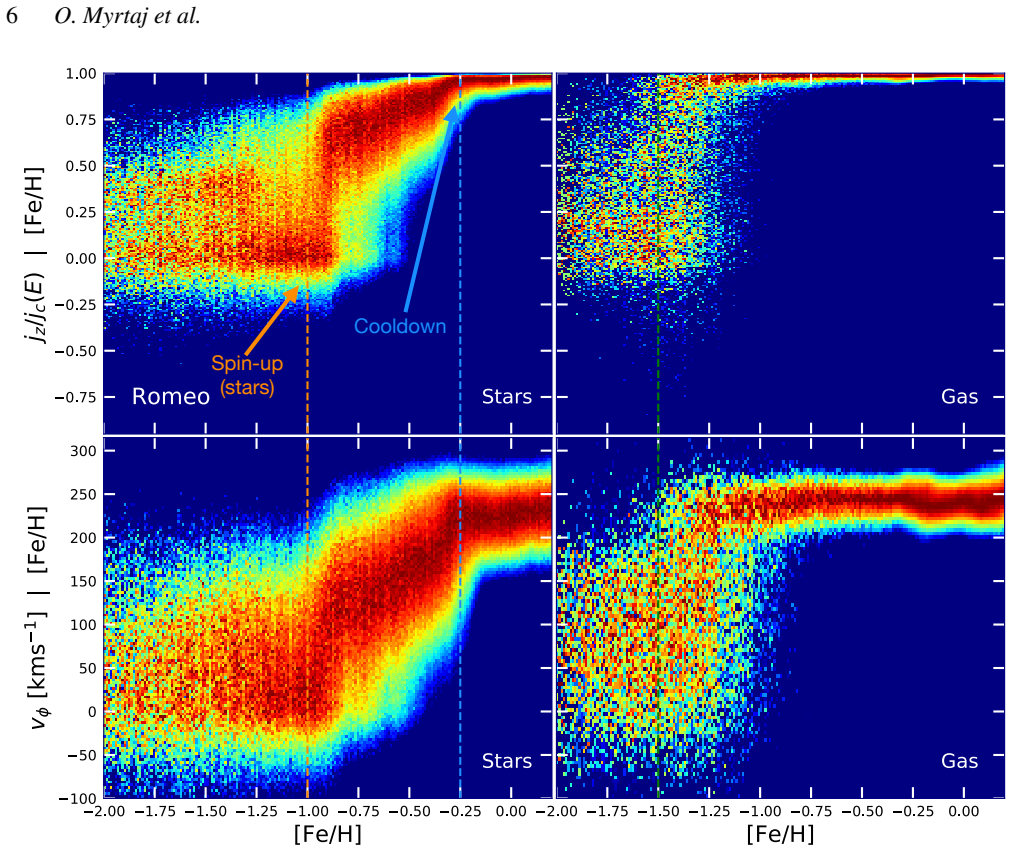
The second row shows a snapshot after gas spin-up but before stellar spin-up. This is the phase in which the gas has begun to acquire coherent rotation, but the newly forming stars have not yet settled into the same ordered kinematic configuration. The cool gas map shows a clearer velocity gradient than in the first row, while the young-star map remains c...
work page 2026
-
[5]
as the250Myr-averagedstarformationratedividedbythemassofcool gas,𝑇≤10 4 K, within 20 kpc of the galaxy center. This definition measures how rapidly the broad cool-gas reservoir is converted into stars. However, because star formation occurs only in the densest and coldest subset of this material, normalizing by all𝑇≤104 K gas may obscure how the more dire...
work page 2021
-
[6]
Across the suite,𝑠 b exhibits the same qualitative behavior seen in the three example systems shown in Figure 11: large-amplitude and chaotic, erratic jumps at early times, followed by a decline to smaller values as the gas disk begins to form. In most galaxies, the transition from frequent excursions above 0.2 to a quieter sub- thresholdstateoccursatorsh...
work page 2026
discussion (0)
Sign in with ORCID, Apple, or X to comment. Anyone can read and Pith papers without signing in.