Exploring the High-Redshift 21-cm Signal via Self-Consistent Simulations using Artificial Neural Network Emulation
Pith reviewed 2026-06-29 06:06 UTC · model grok-4.3
The pith
Self-consistent neural network simulations of cosmic dawn predict detectable 21-cm signals at redshifts below 25.
A machine-rendered reading of the paper's core claim, the machinery that carries it, and where it could break.
Core claim
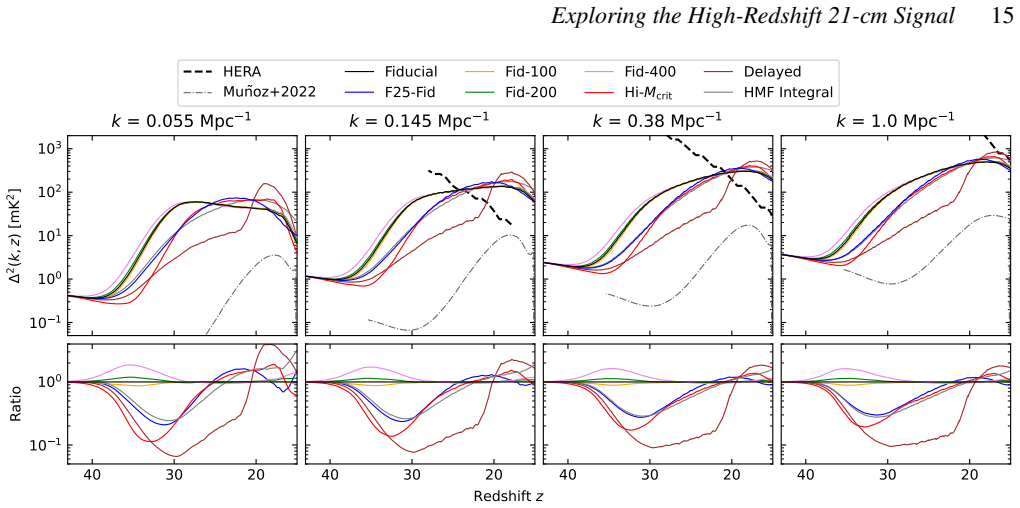
The central discovery is that calibrating small-scale star formation to hydrodynamic simulations via neural network emulation, combined with a critical halo mass for star formation that accounts for molecular hydrogen self-shielding and stochastic merger histories, leads to earlier star formation and higher star formation rates throughout the cosmic dawn epoch. This produces a 21-cm brightness temperature that is detectable at redshifts less than or equal to 25 with 1080 hours of HERA observations, and the absence of a detection at redshifts greater than or equal to 20 would imply a delay time between Population III and Population II star formation of at least 30 million years.
What carries the argument
Neural network emulation of star formation efficiency from AEOS and Renaissance hydrodynamic simulations, embedded in a semi-numeric code tracking large-scale fluctuations and stochastic halo mergers.
If this is right
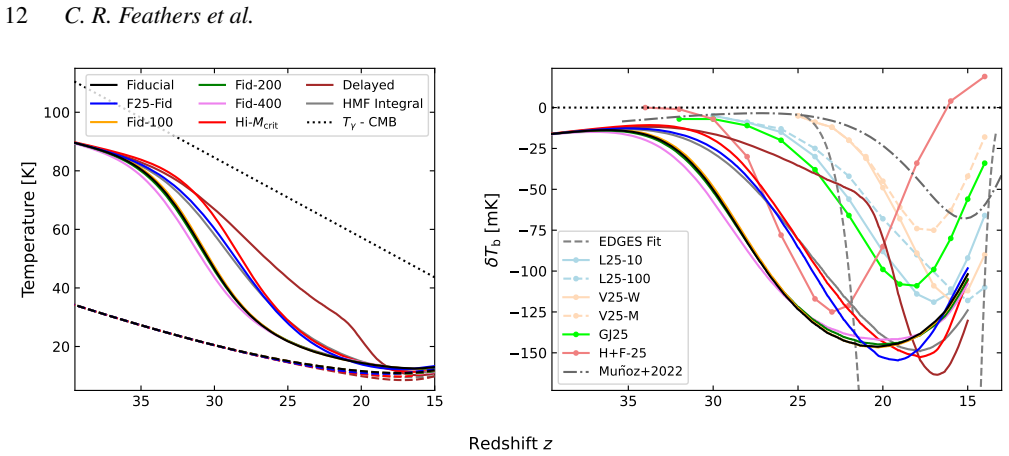
- More efficient Population II star formation produces stronger Lyman-alpha coupling and thus a shallower, wider absorption trough in the 21-cm signal.
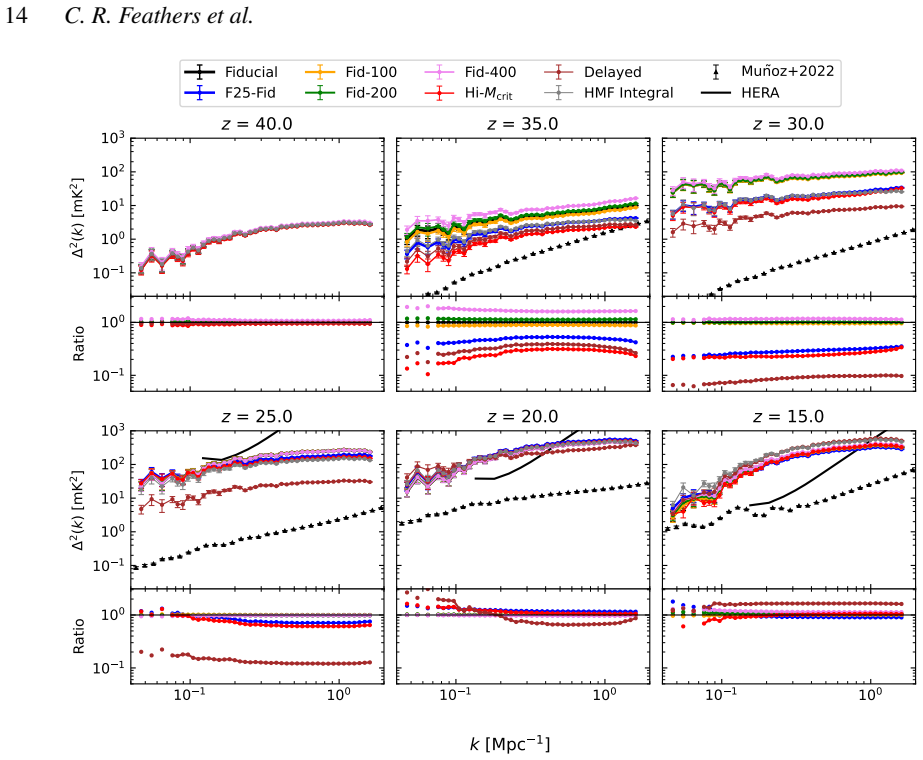
- Population II star formation dominates the 21-cm power spectrum at redshifts below 20 and on smaller scales, while Population III dominates at redshifts above 34 and on larger scales at intermediate redshifts.
- The delay period between Population III and Population II star formation has a significant impact on the 21-cm brightness temperature.
- Including dark matter halo merger histories is required to accurately model the transition between the two populations.
Where Pith is reading between the lines
- Future work could test whether incorporating additional small-scale physics such as varying initial mass functions alters the dominance of different populations in the power spectrum.
- The model's emphasis on stochastic histories suggests that ensemble predictions may show larger variance in the 21-cm signal than mean-field approaches.
- These simulations could inform the design of next-generation radio arrays by highlighting the redshift ranges where the signal is most sensitive to early star formation physics.
Load-bearing premise
The neural network trained on the AEOS and Renaissance simulations accurately reproduces the small-scale star formation efficiency and its dependence on local conditions when placed inside the semi-numeric code with stochastic mergers.
What would settle it
A non-detection of the 21-cm absorption signal at redshifts between 20 and 25 after 1080 hours of HERA integration under moderate foregrounds would indicate that the delay time between Population III and II star formation is at least 30 million years or that the star formation rates are lower than modeled.
Figures


read the original abstract
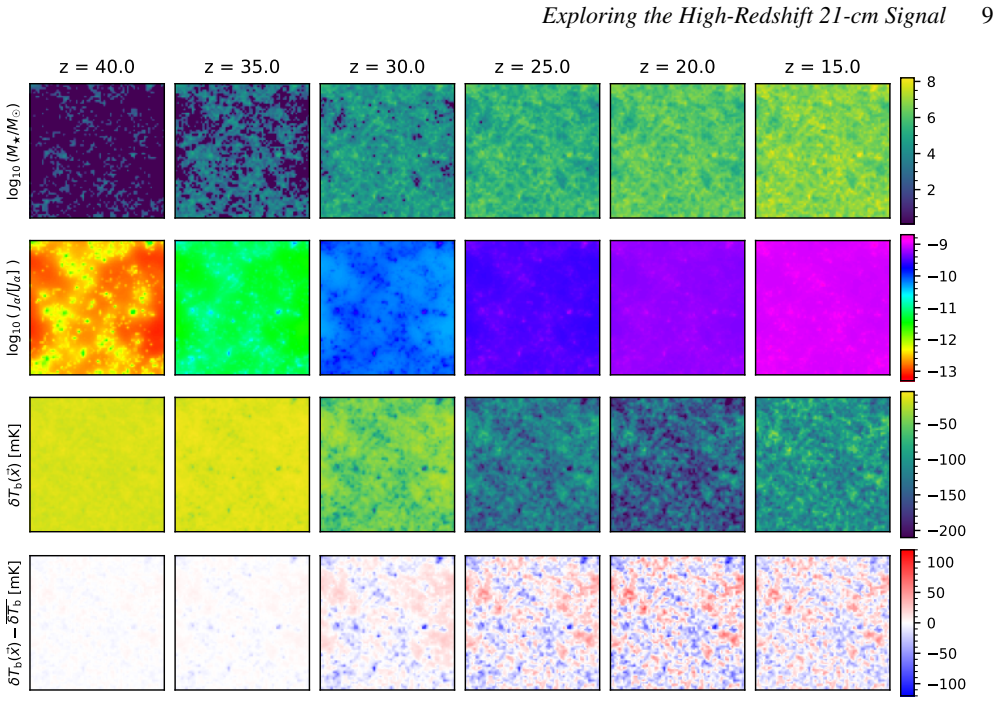
We present a novel, self-consistent, semi-numeric Cosmic Dawn (CD) simulation in which small-scale star formation (SF) is calibrated to the \emph{AEOS} and \emph{Renaissance} hydrodynamic simulations. SF proceeds within dark matter (DM) halos via neural network emulation while considering large-scale fluctuations in density and feedback. We translate the resulting 3D distribution of galaxies into predictions for the 21-cm brightness temperature, \Tb, and power spectrum, \PS. We simulate several unique realizations to study the impact of varying astrophysics on \Tb, finding that more efficient Population II (PopII) SF largely yields stronger Lyman-$\alpha$ coupling, resulting in a shallower and wider absorption trough. However, we find that PopII SF dominates \PS\ at $z \lesssim 20$ and on smaller scales at intermediate redshifts ($k \gtrsim 0.2\ \mathrm{Mpc^{-1}}$ at $z \simeq 34-20$) while Population III (PopIII) SF dominates \PS\ at $z\gtrsim34$ and on larger scales at intermediate redshifts. Compared with previous works, we find that the combination of hydrodynamic SF calibration, a critical halo mass for SF considering \Htwo\ self-shielding, and stochastic DM halo merger histories results in both earlier SF and higher SF rates across CD. Further, we find that the delay period separating PopIII and PopII SF (\tdelay) significantly impacts \Tb, and that one must include DM halo merger histories to properly account for this transition. Finally, we find our fiducial \Tb\ to be detectable at $z\lesssim25$ with 1080 hours of HERA observations under moderate foreground assumptions, and the lack of such a detection at $z \gtrsim 20$ would suggest \tdelay\ $\gtrsim$ 30 Myr.
Editorial analysis
A structured set of objections, weighed in public.
Referee Report
Summary. The manuscript introduces a semi-numeric Cosmic Dawn simulation that emulates small-scale star formation via a neural network trained on the AEOS and Renaissance hydrodynamic runs, incorporating large-scale density/feedback fluctuations and stochastic DM halo merger histories. It generates 3D galaxy distributions to predict the 21-cm brightness temperature Tb and power spectrum PS, finding that the setup produces earlier and higher star-formation rates than prior work, with Pop II dominating PS at z ≲ 20 (and smaller scales at intermediate z) while Pop III dominates at z ≳ 34 (and larger scales intermediately); the fiducial Tb is stated to be detectable at z ≲ 25 with 1080 hours of HERA data under moderate foregrounds, and non-detection at z ≳ 20 would imply tdelay ≳ 30 Myr.
Significance. If the neural-network transfer holds, the framework supplies a route to self-consistent 21-cm forecasts that include stochastic merger histories and hydro-calibrated efficiencies, enabling exploration of astrophysical variations across multiple realizations and potential constraints on the Pop III–Pop II transition delay from future observations.
major comments (3)
- [Methods (NN emulation section)] Methods (neural-network emulation and embedding procedure): the central claim of earlier/higher SF rates and the resulting Tb/PS evolution rests on the NN (trained on limited-volume AEOS/Renaissance runs) accurately reproducing small-scale SF efficiency, its density/feedback dependence, and the tdelay transition once placed inside the semi-numeric code that adds stochastic large-scale mergers; no explicit validation or domain-shift test for this transfer is described, which directly affects the reported Pop II/Pop III dominance and HERA thresholds.
- [Results (Tb and HERA section)] Results (Tb evolution and detectability statements): the assertion that the fiducial model is detectable at z ≲ 25 with 1080 h HERA under moderate foregrounds, and that non-detection at z ≳ 20 implies tdelay ≳ 30 Myr, treats tdelay as an adjustable parameter whose specific value is not derived from first principles within the simulation; this makes the quantitative threshold sensitive to the chosen foreground model and tdelay calibration rather than an internal prediction.
- [Discussion (comparison paragraph)] Comparison to prior work (discussion of SF rates): the statement that hydrodynamic calibration plus critical halo mass for H2 self-shielding plus stochastic mergers produces earlier SF is presented as a combined effect, yet the manuscript does not isolate the contribution of each ingredient via controlled runs within the same code, leaving the load-bearing attribution to the full combination unquantified.
minor comments (2)
- Notation: the power spectrum is denoted PS throughout; explicit definition (e.g., as Δ²(k) or the dimensionless form) in the text and figure captions would improve clarity.
- The abstract and methods refer to the simulation as 'self-consistent,' but the SF calibration is performed against external hydrodynamic volumes; a brief caveat on the remaining dependence on those training data would be useful.
Simulated Author's Rebuttal
We thank the referee for their constructive and detailed review of our manuscript. We address each major comment point by point below, indicating where revisions will be made to improve clarity and robustness.
read point-by-point responses
-
Referee: [Methods (NN emulation section)] Methods (neural-network emulation and embedding procedure): the central claim of earlier/higher SF rates and the resulting Tb/PS evolution rests on the NN (trained on limited-volume AEOS/Renaissance runs) accurately reproducing small-scale SF efficiency, its density/feedback dependence, and the tdelay transition once placed inside the semi-numeric code that adds stochastic large-scale mergers; no explicit validation or domain-shift test for this transfer is described, which directly affects the reported Pop II/Pop III dominance and HERA thresholds.
Authors: We agree that the manuscript would benefit from explicit validation of the NN transfer. In the revised version we will add a dedicated subsection presenting cross-checks of SF efficiencies between the embedded NN and the original hydro runs in overlapping density and redshift regimes, along with a brief discussion of domain-shift considerations. This directly supports the robustness of the Pop II/Pop III dominance results. revision: yes
-
Referee: [Results (Tb and HERA section)] Results (Tb evolution and detectability statements): the assertion that the fiducial model is detectable at z ≲ 25 with 1080 h HERA under moderate foregrounds, and that non-detection at z ≳ 20 implies tdelay ≳ 30 Myr, treats tdelay as an adjustable parameter whose specific value is not derived from first principles within the simulation; this makes the quantitative threshold sensitive to the chosen foreground model and tdelay calibration rather than an internal prediction.
Authors: The detectability statements are presented for the fiducial tdelay choice, which is calibrated to hydro results rather than derived from first principles. We will revise the text to explicitly state the conditional nature of these thresholds, emphasize dependence on the foreground model, and add a short sensitivity discussion showing how the HERA horizon changes with tdelay. This clarifies the model-dependent character without altering the core claims. revision: partial
-
Referee: [Discussion (comparison paragraph)] Comparison to prior work (discussion of SF rates): the statement that hydrodynamic calibration plus critical halo mass for H2 self-shielding plus stochastic mergers produces earlier SF is presented as a combined effect, yet the manuscript does not isolate the contribution of each ingredient via controlled runs within the same code, leaving the load-bearing attribution to the full combination unquantified.
Authors: We acknowledge that the manuscript does not isolate the individual contributions of the three ingredients. Performing a full set of controlled runs would require substantial additional resources. In revision we will expand the discussion to articulate the physical motivation for treating them as a combined, self-consistent package and will note the limitation on attribution. This provides a more balanced presentation while preserving the central narrative. revision: partial
Circularity Check
No significant circularity; external hydro calibration and input parameters keep derivation independent
full rationale
The paper calibrates small-scale SF efficiency via NN emulation to external AEOS and Renaissance hydrodynamic simulations, then embeds this in a semi-numeric code with stochastic merger histories and standard cosmological initial conditions to predict Tb and PS. tdelay is explicitly an input parameter varied across realizations rather than a fitted output. No self-definitional equations, fitted inputs renamed as predictions, or load-bearing self-citations appear in the abstract or described methods. The central claims on earlier/higher SF rates and HERA detectability thresholds follow from the model structure without reducing to the inputs by construction.
Axiom & Free-Parameter Ledger
free parameters (2)
- tdelay
- critical halo mass for SF
axioms (2)
- standard math Standard Lambda-CDM cosmology and linear density fluctuations on large scales provide the correct initial conditions for halo assembly.
- domain assumption The neural network trained on AEOS and Renaissance runs generalizes to the density and feedback environments realized in the semi-numeric code.
Reference graph
Works this paper leans on
-
[1]
Ahn, K., & Shapiro, P. R. 2021, ApJ, 914, 44, doi:10.3847/1538-4357/ abf3bf Ahn, K., Xu, H., Norman, M. L., Alvarez, M. A., & Wise, J. H. 2015, ApJ, 802, 8, doi:10.1088/0004-637X/802/1/8 Allison, A. C., & Dalgarno, A. 1969, ApJ, 158, 423, doi:10.1086/150204 Armengaud, E., Palanque-Delabrouille, N., Yèche, C., Marsh, D. J. E., & Baur, J. 2017, MNRAS, 471, ...
-
[2]
by summing over the main contributors to collisional excitation at high redshifts: collisions between a hydrogen atom and an electron (eH), a proton (pH), and a second hydrogen atom (HH). The coefficient is thus 𝑥c =𝑥 HH c +𝑥 eH c +𝑥 pH c = 𝑇★ 𝐴10𝑇𝛾 [𝑛HI𝜅HH 10 (𝑇K)+𝑛 e𝜅eH 10 (𝑇K)+𝑛 p𝜅pH 10 (𝑇K)], (A1) where𝑛 𝑖 is the number density of species𝑖, and𝜅𝑖 10 i...
2006
discussion (0)
Sign in with ORCID, Apple, or X to comment. Anyone can read and Pith papers without signing in.