Compositional Periodic Spline Approximation for Circular Density Data in Bayes Spaces
Pith reviewed 2026-05-20 00:09 UTC · model grok-4.3
The pith
Centered log-ratio transformation enables periodic spline approximation for circular densities in Bayes spaces.
A machine-rendered reading of the paper's core claim, the machinery that carries it, and where it could break.
Core claim
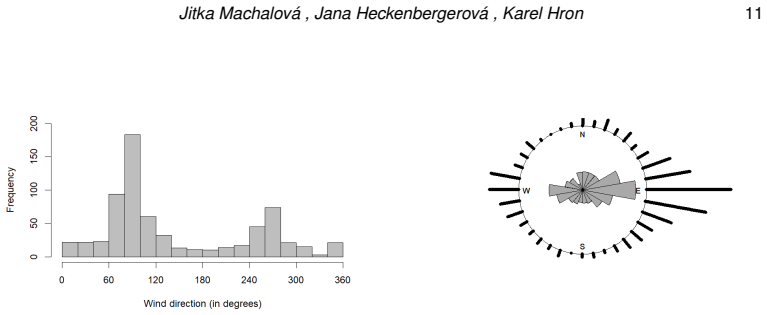
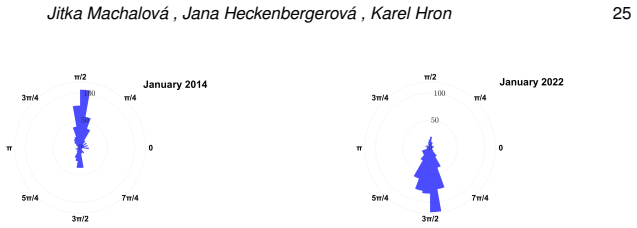
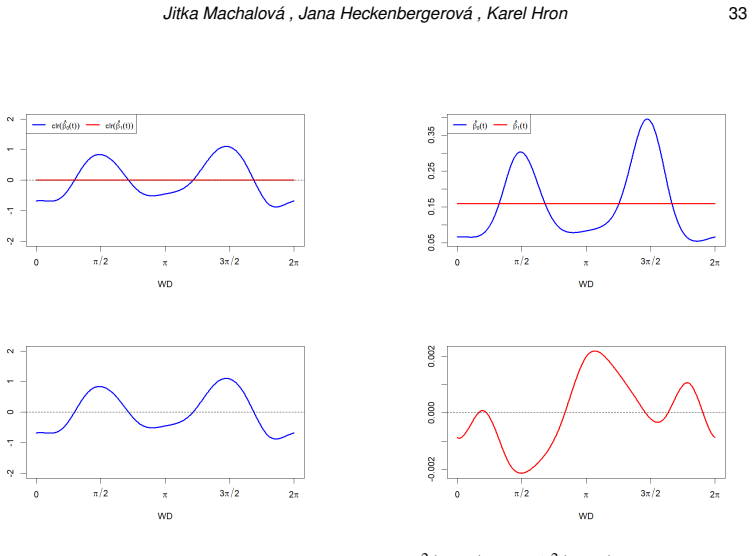
Applying the centered log-ratio transformation represents densities in a subspace of the standard L2 space, enabling functional data analysis tools while preserving relative nature and periodic structure. A coefficient-based construction of periodic splines with zero-integral constraint is developed with matrix formulations for smoothing and penalized splines for efficient estimation. The method applied to long-term wind direction data yields smooth interpretable density estimates and supports statistical analysis including functional regression.
What carries the argument
The centered log-ratio transformation to a Bayes space subspace combined with coefficient-based periodic splines under zero-integral constraint, which allows matrix-based smoothing and penalized estimation while maintaining compositional properties.
If this is right
- Smooth density estimates are obtained for circular data such as wind directions.
- Functional regression and other analyses become possible on the density functions.
- Matrix formulations support efficient and practical implementation of the estimators.
- Extensions to more complex density-valued data are feasible.
Where Pith is reading between the lines
- The method may offer advantages over standard circular density estimators by enforcing periodicity and relative scale through the compositional transform.
- It could be applied to other periodic phenomena like daily activity patterns or seasonal wind variations for better modeling.
- Future work might combine this with machine learning for high-dimensional circular data analysis.
- A practical test would involve real-world datasets from ecology or meteorology to assess accuracy in capturing multimodal circular distributions.
Load-bearing premise
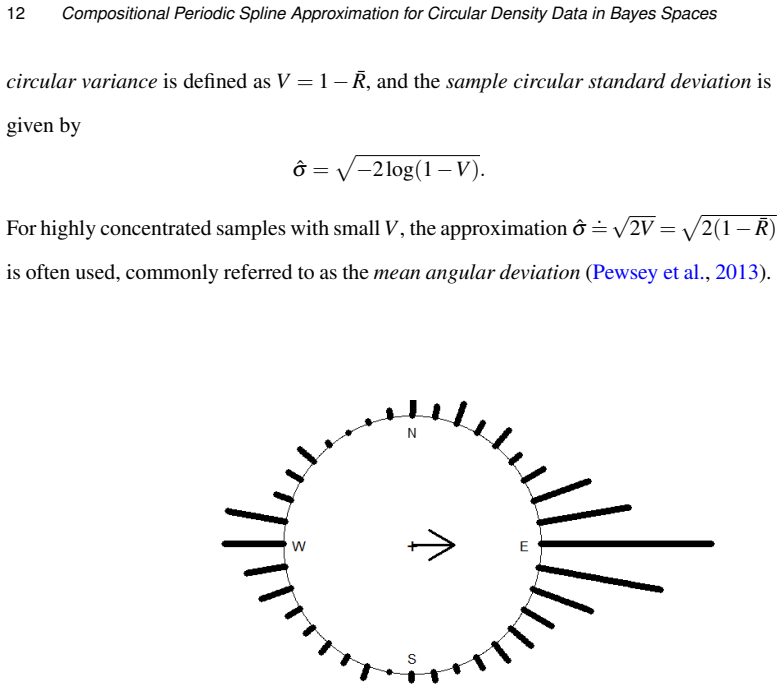
The centered log-ratio transformation preserves the relative compositional nature and periodic structure of the densities sufficiently to allow undistorted application of standard functional data analysis tools.
What would settle it
Simulate data from a known circular density, estimate it with the proposed splines, and compare the recovered density to the truth using a compositional distance measure; large discrepancies would falsify the claim that properties are preserved.
Figures


read the original abstract
This paper proposes a novel framework for the approximation and analysis of circular density data using compositional periodic splines within Bayes spaces with the Hilbert space structure. By applying the centered log-ratio transformation, densities are represented in a subspace of the standard $L^2$ space of real-valued functions, which enables the use of functional data analysis tools while preserving the relative nature of distributions and their periodic structure. A coefficient-based construction of periodic splines with a zero-integral constraint is developed, together with matrix formulations for both smoothing splines and penalized splines, allowing efficient estimation and implementation. The methodology is applied to long-term wind direction data, where it provides smooth and interpretable density estimates and supports further statistical analysis, including functional regression. The results demonstrate the practical relevance of the proposed approach and its potential for extensions to more complex density-valued data.
Editorial analysis
A structured set of objections, weighed in public.
Referee Report
Summary. The paper proposes a framework for approximating and analyzing circular density data via compositional periodic splines in Bayes spaces. It applies the centered log-ratio transformation to represent densities in the zero-integral subspace of L², enabling standard functional data analysis tools while preserving periodicity and relative information. A coefficient-based construction of periodic splines enforcing the zero-integral constraint is developed, together with matrix formulations for smoothing splines and penalized splines to support efficient estimation. The approach is illustrated on long-term wind direction data, yielding smooth density estimates and supporting functional regression.
Significance. If the constructions are rigorously established, the work offers a coherent extension of functional data analysis to compositional circular data, with computational advantages from the matrix methods and direct enforcement of the integral constraint. The wind-direction application demonstrates utility for directional distributions. Credit is given for the explicit adaptation of FDA techniques to the constrained periodic setting and for avoiding post-hoc adjustments to the zero-integral condition.
major comments (1)
- The central claim that the clr map and coefficient-based splines allow direct application of FDA tools without distorting periodic or compositional properties would be strengthened by an explicit verification (e.g., in the spline-construction section) that the zero-integral constraint is preserved exactly under the smoothing and penalty operators for arbitrary smoothing parameters.
minor comments (3)
- Abstract: the phrase 'Bayes spaces with the Hilbert space structure' should be accompanied by the explicit inner product once the transformation is introduced.
- Application section: quantitative metrics (e.g., integrated squared error or cross-validated log-likelihood) comparing the spline estimates to circular kernel density estimators would better support the claim of practical relevance.
- The matrix formulations for penalized splines should include the explicit expression for the penalty matrix (or its null-space projection) to facilitate reproducibility.
Simulated Author's Rebuttal
We thank the referee for the careful reading and positive recommendation of minor revision. The single major comment is addressed below; we have revised the manuscript to incorporate an explicit verification as suggested.
read point-by-point responses
-
Referee: The central claim that the clr map and coefficient-based splines allow direct application of FDA tools without distorting periodic or compositional properties would be strengthened by an explicit verification (e.g., in the spline-construction section) that the zero-integral constraint is preserved exactly under the smoothing and penalty operators for arbitrary smoothing parameters.
Authors: We agree that making this preservation explicit strengthens the central claim. The coefficient-based periodic splines are constructed from a basis that lies exactly in the zero-integral subspace (Section 3), and both the smoothing-spline and penalized-spline estimators are obtained from linear systems whose matrices are formed by inner products within that same subspace. Consequently, for any smoothing parameter the solution coefficient vector automatically satisfies the linear constraint that enforces zero integral. In the revised manuscript we have added a short proposition (new Proposition 3.1) together with its proof in the spline-construction section, verifying that the estimated functions remain in the zero-integral subspace for arbitrary smoothing parameters. This confirms that the clr-transformed estimates can be treated with standard FDA tools without post-hoc adjustments or distortion of the periodic or compositional structure. revision: yes
Circularity Check
No significant circularity detected in derivation chain
full rationale
The paper's central construction begins with the standard centered log-ratio (clr) map, which sends positive periodic densities to the zero-integral subspace of L2 while preserving periodicity pointwise; this is an external, independently verifiable property of the clr transformation rather than a result derived inside the paper. From this embedding the authors introduce a coefficient-based basis for periodic splines that exactly enforces the integral-zero constraint via linear conditions on the coefficients, then obtain the usual matrix representations for smoothing and penalized splines by direct substitution of the constrained basis into the standard quadratic forms. None of these steps reduces by the paper's own equations to a fitted parameter renamed as a prediction, nor does any load-bearing premise rest on a self-citation whose content is itself unverified; the subsequent application to wind-direction data is presented as an illustration, not as a self-referential validation. The derivation therefore remains self-contained against external benchmarks of spline theory and compositional data analysis.
Axiom & Free-Parameter Ledger
free parameters (1)
- smoothing penalty parameter
axioms (1)
- domain assumption Centered log-ratio transformation maps positive densities to a subspace of L2 functions while preserving relative information and periodicity.
Reference graph
Works this paper leans on
-
[1]
Computational Statistics , year =
Benlakhdar, Said and Rziza, Mohammed and Thami, Rachid Oulad Haj , title =. Computational Statistics , year =
-
[2]
van den Boogaart, K. G. and Egozcue, J.J. and Pawlowsky-Glahn, V. , title =. Statistics and Operations Research Transactions , year =
-
[3]
van den Boogaart, K. G. and Egozcue, J.J. and Pawlowsky-Glahn, V. , title =. Australian & New Zealand Journal of Statistics , year =
-
[4]
A global sensitivity analysis method applied to wind farm power output estimation models , year =
Carta, Jos. A global sensitivity analysis method applied to wind farm power output estimation models , year =. Applied Energy , volume =. doi:10.1016/j.apenergy.2020.115968 , type =
-
[5]
Coles, S.G. and Walshaw, D. , Title =. Journal of the Royal Statistical Society Series C-Applied Statistics , Year =
-
[6]
Journal of Building Engineering , Year =
Cui, Bingchang and Huang, Peng , Title =. Journal of Building Engineering , Year =. doi:10.1016/j.jobe.2024.111119 , Article-Number =
- [7]
- [8]
- [9]
-
[10]
Ditlevsen, O , Title =. Structural Safety , Year =. doi:10.1016/S0167-4730(02)00022-X , ISSN =
-
[11]
Droppo, James G. and Napier, Bruce A. , Title =. Journal of the Air & Waste Management Association , Year =. doi:10.3155/1047-3289.58.7.913 , ISSN =
-
[12]
Egozcue, J.J. and D. Hilbert space of probability density functions based on. Acta Mathematica Sinica , year =
- [13]
-
[14]
Holmes, J. D. , Title =. Strutural Safety , Year =. doi:10.1016/j.strusafe.2020.101983 , Article-Number =
-
[15]
Horn, Jan-Tore and Bitner-Gregersen, Elzbieta and Krokstad, Jorgen R. and Leira, Bernt J. and Amdahl, Jorgen , Title =. Applied Ocean Research , Year =. doi:10.1016/j.apor.2018.01.010 , ISSN =
-
[16]
Topics in circular statistics , ISBN =
Jammalamadaka, Sreenivasa Rao and Sengupta, Ashis , address =. Topics in circular statistics , ISBN =. 2001 , collection =
work page 2001
-
[17]
Journal of Marine Science and Engineering , Year =
Kaliske, Malte and Schmidt, Boso , Title =. Journal of Marine Science and Engineering , Year =. doi:10.3390/jmse12071116 , Article-Number =
-
[18]
Kamisan, Nur Arina Basilah and Hussin, Abdul Ghapor and Zubairi, Yong Zulina , Title =. Sains Malaysiana , Year =
- [19]
-
[20]
Ley, Christophe and Verdebout, Thomas , title =. 2019 , collection =
work page 2019
-
[21]
Applied Ocean Research , Year =
Lin, Yifan and Dong, Sheng , Title =. Applied Ocean Research , Year =. doi:10.1016/j.apor.2019.03.017 , ISSN =
- [22]
-
[23]
MacDonald, A. and Scarrott, C. J. and Lee, D. and Darlow, B. and Reale, M. and Russell, G. , Title =. Computational Statistics & Data Analysis , Year =. doi:10.1016/j.csda.2011.01.005 , ISSN =
-
[24]
Journal of Applied Statistics , volume =
Preprocessing of centred logratio transformed density functions using smoothing splines , author =. Journal of Applied Statistics , volume =. 2016 , publisher =
work page 2016
-
[25]
Computational Statistics , volume =
Compositional splines for representation of density functions , author =. Computational Statistics , volume =. 2021 , publisher =
work page 2021
-
[26]
Mardia, K. V. , title =. Journal of the Royal Statistical Society: Series B (Methodological) , volume =. doi:https://doi.org/10.1111/j.2517-6161.1975.tb01550.x , year =
-
[27]
Kanti V. Mardia and Peter E. Jupp , address =. Directional Statistics , ISBN =
-
[28]
Meteorological Applications , Year =
Palutikof, JP and Brabson, BB and Lister, DH and Adcock, ST , Title =. Meteorological Applications , Year =. doi:10.1017/S1350482799001103 , ISSN =
- [29]
- [30]
-
[31]
Compositional regression with functional response , Journal =
Talsk. Compositional regression with functional response , Journal =. 2018 , Volume =. doi:10.1016/j.csda.2018.01.018 , ISSN =
-
[32]
Talsk\'a, Ren\'ata and Hron, Karel and Matys Grygar, Tom\'a. Compositional Scalar-on-Function Regression with Application to Sediment Particle Size Distributions , Journal =. 2021 , Volume =. doi:10.1007/s11004-021-09941-1 , EarlyAccessDate =
-
[33]
Vanem, Erik and Fekhari, Elias and Dimitrov, Nikolay and Kelly, Mark and Cousin, Alexis and Guiton, Martin , title =. Proceedings of the ASME 42nd International Conference on Ocean, Offshore and Arctic Engineering (OMAE2023) , year =
-
[34]
Journal of Offshore Mechanics and Arctic Engineering , year =
Vanem, Erik and Fekhari, Elias and Dimitrov, Nikolay and Kelly, Mark and Cousin, Alexis and Guiton, Martin , title =. Journal of Offshore Mechanics and Arctic Engineering , year =
-
[35]
Journal of Wind Engineering and Industrial Aerodynamics , volume =
Wang, Zhi-wei and Zhang, Wen-ming and Zhang, Yu-feng and Liu, Zhao , title =. Journal of Wind Engineering and Industrial Aerodynamics , volume =. 2021 , issn =
work page 2021
-
[36]
Journal of Applied Meteorology , Year =
Weber, RO , Title =. Journal of Applied Meteorology , Year =. doi:10.1175/1520-0450(1997)036<1403:EFTSDO>2.0.CO;2 , ISSN =
-
[37]
Ye, X. W. and Xi, P. S. and Nagode, Marko , Title =. Engineering Structures , Year =. doi:10.1016/j.engstruct.2018.08.035 , ISSN =
-
[38]
Zerbe, Kevin and Polit, Chris and McClain, Stacey and Cook, Tim , title =. 2022 , journal =. doi:10.1007/s13753-022-00396-4 , type =
-
[39]
Machalov. Innovative Approach to Wind Direction Data Analyses: A Compositional Periodic Spline Representation in. New Trends in Functional Statistics and Related Fields , year =
- [40]
-
[41]
Eilers, Paul H. C. and Marx, Brian D. , title =. 2021 , publisher =. doi:10.1017/9781108610247 , isbn =
-
[42]
Orthogonal decomposition of multivariate densities in
Genest, Christian and Hron, Karel and Ne. Orthogonal decomposition of multivariate densities in. Journal of Multivariate Analysis , year =
discussion (0)
Sign in with ORCID, Apple, or X to comment. Anyone can read and Pith papers without signing in.