REVIEW 2 major objections 3 minor 88 references
Cocoon shock, X-ray cavities and extended Inverse Compton emission in Hercules A: clues from Chandra observations
T0 review · 2 major / 3 minor · reviewed 2026-08-12 · deepseek-v4-flash
Pith's one-line read The X-ray glow filling Hercules A's radio lobes is inverse Compton emission from CMB-scattering electrons, not hot gas, and it pins the lobe magnetic field at 12±3 μG.
desk verdict Solid single-object study with two new detections; the lobe IC claim has an unaddressed spectral-index inconsistency that the authors need to fix. read the letter →
The pith
A machine-rendered reading of the paper's core claim, the machinery that carries it, and where it could break.
The reading
What carries the argument
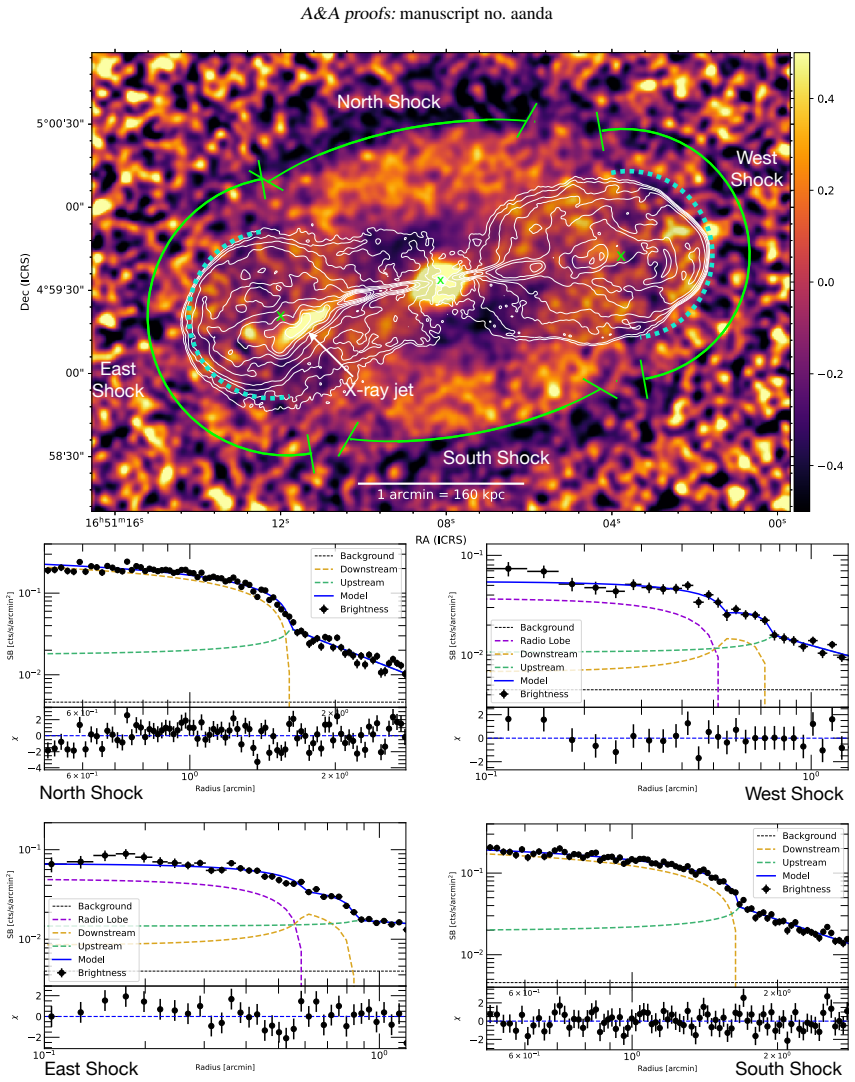
The load-bearing mechanism is inverse Compton scattering of cosmic microwave background photons by the radio-lobe electron population: the CMB energy density at $z=0.155$ is about $7.5\times10^{-13}\ \mathrm{erg\,cm^{-3}}$, and electrons with $\gamma\sim10^3$ upscatter those photons into the X-ray band, giving a power law whose 1 keV normalization is set by the electron density. That normalization is extracted with a geometric model in which each lobe is a sphere of constant emissivity $A_l$ whose projection along the line of sight is $I_l(r)=2A_l\sqrt{r_l^2-r^2}$; the fit separates the lobe IC emission from the shocked ICM and yields the lobe radius that matches the radio lobe edges. The shock part of the argument is carried by the Rankine-Hugoniot density-jump relation $M=\sqrt{3J/(4-J)}$, applied to broken power-law surface brightness fits, and by spectral temperature jumps fitted with a deprojected thermal model. Together these two mechanisms convert surface brightness edges and a faint X-ray excess into physical claims about a 90–150 Myr outburst and a 12 μG lobe field.
What would settle it
A deep hard X-ray spectrum of the radio lobes would settle the matter: inverse Compton predicts a featureless power law with photon index near 1.5 continuing beyond 10 keV, while the alternative thermal plasma would show a roughly 7–8 keV thermal peak and iron line emission that current data cannot fully exclude.
Extended reading notes
Core claim
The central claim is that the radio lobes of Hercules A shine in X-rays by inverse Compton scattering: relativistic electrons with Lorentz factors around $10^3$ upscatter cosmic microwave background photons into the Chandra band. The measured 1 keV flux density of $21.7\pm1.4\ (\mathrm{stat})\pm1.3\ (\mathrm{sys})$ nJy comes from three concordant methods — spectral fits against the shocked shell as background, blank-sky-subtracted fits with a frozen thermal component plus a power law, and integration of the sphere-of-emission surface brightness model — and combining it with the 13.9 Jy synchrotron flux at 1.4 GHz and spectral index $\alpha=1.2$ gives a volume-averaged lobe magnetic field of $B=12\pm3\,\mu$G. The same data reveal two new surface brightness edges east and west at about 280 kpc that, together with the known north-south edges at 150 kpc, close into a complete cocoon shock with Mach numbers $1.65\pm0.05$ (north-south) and $1.9\pm0.3$ (east-west); the shock age inferred from their radii is 90–150 Myr.
Load-bearing premise
The weakest link is the geometric assumption that each radio lobe is a uniform X-ray-emitting sphere concentric with a spherical shock, and that the cluster's projected alignment matches its true three-dimensional orientation; if the lobe emission or shock shape is not spherical, the fitted density jumps, Mach numbers, and the inferred inverse Compton flux would all shift.
Editorial extensions
If this is right
- The lobe X-ray glow being IC means the lobes are not hiding hot gas: the implied electron pressure nearly balances the shocked ICM pressure, leaving little room for non-radiating particles.
- The complete cocoon shock dates the dominant outburst to 90–150 Myr and gives a jet power of $(1.4{-}2.3)\times10^{46}\ \mathrm{erg\,s^{-1}}$, about two orders of magnitude above the cluster's X-ray luminosity.
- The X-ray cavities are dynamically younger than the cocoon and misaligned with the jets, so they are not buoyant remnants of the current outburst; backflow from the lobes is the preferred explanation.
- The eastern jet's X-rays are consistent with mildly Doppler-boosted IC-CMB emission ($\delta\approx2.7$, $B\approx12\,\mu$G), avoiding the need for very efficient re-acceleration to $\gamma\ge10^8$.
- IC emission masks any cavities associated with the radio lobes, so searches for lobe cavities in similar systems must model the non-thermal continuum first.
Reading between the lines
- If $B\approx12\,\mu$G holds, the lobes sit well below the ~36–40 μG equipartition value inferred for the jet, implying the electron population, not the magnetic field, dominates the lobe pressure; this would strengthen the case for particle-dominated lobes in FR I/II hybrids generally.
- The cocoon's elongation (150 kpc north-south, 280 kpc east-west) is a clean geometric test: deeper X-ray maps should show the same shock age along both axes if it is a single outburst, and a mismatch would reveal a second, axis-aligned outburst.
- The backflow explanation predicts steep-spectrum, low-frequency radio emission inside the cavities; deep LOFAR observations in the 42–66 MHz band should detect it if present, distinguishing backflow from a wind-excavated bubble.
- A direct test of the IC origin is to map the lobe X-ray surface brightness spatially: IC should track the synchrotron radio lobes with a uniform emissivity, whereas a thermal component would trace the cluster potential and show a different radial profile.
Editorial analysis
A structured set of objections, weighed in public.
Referee Report
Summary. The paper presents a Chandra and VLA analysis of the radio galaxy 3C348 in the Hercules A cluster. Using surface-brightness profiles, the authors identify north-south discontinuities at ~150 kpc and east-west discontinuities at ~280 kpc, interpret these as a single cocoon shock, and derive Mach numbers of 1.65 ± 0.05 and 1.9 ± 0.3, respectively. They confirm two radio-faint X-ray cavities, measure their sizes and ages, and detect X-ray emission from the eastern jet and from the radio lobes. The jet X-ray emission is modeled as Doppler-boosted inverse Compton (IC) emission with δ ~ 2.7, while the lobe X-ray excess is interpreted as IC-CMB emission with a combined 1 keV flux density of 21.7 ± 1.4 (statistical) ± 1.3 (systematic) nJy, from which a lobe magnetic field of 12 ± 3 μG is derived.
Significance. If the lobe X-ray excess is genuinely IC emission, this is one of the few direct, spatially resolved measurements of a magnetic field in a radio lobe through the IC/CMB ratio, and the proposed complete cocoon shock around a ~400 kpc double lobe system would be a valuable constraint on AGN feedback energetics. The paper is careful in several respects: three independent estimates of the lobe IC flux agree (23.2 ± 1.1, 20.6 ± 1.9, and 21.3 ± 1.2 nJy), two background treatments are used, uncertainties are reported at 1σ, and a thermal model for the lobe X-rays is considered in detail in Appendix B. The main weakness is an internal inconsistency between the fitted X-ray photon index and the radio spectral index adopted for the one-zone IC model; this must be resolved before the central IC/B-field claim can be accepted.
major comments (2)
- [§3.2.3 and §4.2.2] The one-zone IC interpretation is internally inconsistent with the measured X-ray spectral slope. In both background treatments of §3.2.3, the lobe excess is fitted with a power law of photon index Γ ≈ 1.5 (α_X ≈ 0.5), while §4.2.2 derives B = 12 ± 3 μG adopting a radio spectral index α = 1.2 for the lobes. In a one-zone IC-CMB model, the IC X-ray slope must equal the synchrotron slope of the same electrons; the electrons producing 1 keV IC photons have γ ≈ 10^3 and radiate synchrotron at ν ≈ 50 MHz for B ≈ 12 μG. The radio data cited in §4.2.2 give α ≈ 1.0–1.2 in that range, predicting Γ ≈ 2.0–2.2, not 1.5. The measured Γ ≈ 1.5 therefore suggests that the fitted power-law component contains an additional hard component, most plausibly unmodeled thermal emission, and that the quoted 21.7 nJy IC flux and B are biased. Please re-fit the lobe spectra with the non-thermal index tied to the radio value (e.g., Γ = 2.2) and a free apec component to account for residual thermal emission, and report the resulting IC flux and magnetic field; alternatively, provide a physical model in which the IC slope is allowed to differ from the radio slope.
- [§3.1.1, Eq. (2), Table 1] The east-west shock parameters and the third estimate of the lobe IC flux are sensitive to the assumed lobe geometry. The surface-brightness model treats the lobe X-ray emission as a uniform sphere of constant emissivity concentric with a spherical shock (Eq. 2) and assumes that the 2D alignment of the cluster and radio axes matches the true 3D alignment. The authors acknowledge this simplification but do not quantify its effect. Because the fitted density jump J enters the Mach numbers through Eq. (1), and the normalization Al is used as one of the three IC flux estimates in §3.2.3, departures from sphericity or a small offset between the lobe and shock centers would introduce a systematic error in both the cocoon-shock Mach numbers and the IC flux. Please quantify this by refitting with a spheroidal lobe model, or by allowing a small center offset and adding the resulting systematic uncertainties to Table 1.
minor comments (3)
- [§3.1.2] The final paragraph of this subsection says 'The south-eastern cavity is likely larger than the north-western cavity.' This should read 'south-western' and 'north-eastern'.
- [Fig. 2] The east and west surface-brightness panels do not have an explicit x-axis label identifying the distance from the lobe center; please add such a label and indicate which model component corresponds to the lobe sphere.
- [§3.2.3] The third flux estimate, which converts the surface-brightness normalization Al into a 1 keV flux density, assumes a photon index of 1.5 but does not propagate the uncertainty in the fitted photon index into the flux; please include this systematic term when quoting the combined flux.
Circularity Check
No significant circularity: the IC flux, shock Mach numbers, and magnetic field are independently measured and derived; the jet Doppler factor is an explicit fit, not a mislabeled prediction.
full rationale
The paper's main derived quantities are not equivalent to their inputs by construction. The lobe X-ray excess is measured in three ways (two independent spectral decompositions against different background treatments, plus the surface-brightness sphere normalization), and the 21.7 nJy fiducial value is an average over those methods; the magnetic field B = 12 +/- 3 microG follows from the standard ratio of IC to synchrotron flux from the same electron population (Mernier et al. 2019), not from an assumed value of B. The shock Mach numbers are obtained from fitted density jumps via the Rankine-Hugoniot relation, with the north-south result independently re-derived from the data rather than imported from Nulsen et al. (2005a). Self-citations (Nulsen et al. 2005a; Ubertosi et al. 2023; McNamara & Nulsen 2007, 2012) are historical, methodological, or re-derived by the present analysis, and none carries a load-bearing uniqueness claim. The eastern-jet Doppler factor delta ~ 2.7 is explicitly fitted to reconcile the IC-CMB model with the measured 4.8 nJy flux; the paper does not present it as a prediction. The acknowledged 2D/3D alignment simplification for the cocoon-shock geometry and the possible Gamma ~ 1.5 (X-ray) versus alpha = 1.2 (radio) spectral-index tension are model assumptions and consistency risks, but they are not circular reductions of the central claims to their own inputs.
Assumptions & free parameters
free parameters (4)
- Doppler factor δ for the eastern jet =
~2.7
- Electron energy index p for the jet =
2.2
- Spectral index α for the lobes =
1.2
- Electron Lorentz factor range for the lobes =
gamma_min=10, gamma_max=10^5
assumptions (5)
- domain assumption The projected 2D alignment of the cluster major axis and the radio axis matches the 3D alignment.
- domain assumption The lobe X-ray emission can be modeled as a sphere of constant emissivity per unit volume.
- domain assumption The shock travels at a constant speed v_sh = M c_s over its lifetime.
- domain assumption The electron energy distribution in the lobes is a broken power law with α=1.2 above the break.
- standard math Standard ΛCDM cosmology with H0=70 km/s/Mpc and Omega_m=0.3.
Cite this review
Pith. "Pith review of Cocoon shock, X-ray cavities and extended Inverse Compton emission in Hercules A: clues from Chandra observations." pith.science (2026). https://pith.science/paper/OVHPX6WQ
@misc{pith2026241112804,
  author       = {Pith},
  title        = {Pith review of: Cocoon shock, X-ray cavities and extended Inverse Compton emission in Hercules A: clues from Chandra observations},
  year         = {2026},
  howpublished = {\url{https://pith.science/paper/OVHPX6WQ}},
  note         = {Machine review of arXiv:2411.12804}
}
abstract
We present a detailed analysis of jet activity in the radio galaxy 3C348 at the center of the galaxy cluster Hercules A. We use archival Chandra data to investigate the jet-driven shock front, the radio-faint X-ray cavities, the eastern jet, and the presence of extended Inverse Compton (IC) X-ray emission from the radio lobes. We detect two pairs of shocks: one in the north-south direction at 150 kpc from the center, and another in the east-west direction at 280 kpc. These shocks have Mach numbers of $\mathcal{M} = 1.65\pm0.05$ and $\mathcal{M} = 1.9\pm0.3$, respectively. Together, they form a complete cocoon around the large radio lobes. Based on the distance of the shocks from the center, we estimate that the corresponding jet outburst is 90-150 Myr old. We confirm the presence of two radio-faint cavities within the cocoon, misaligned from the lobes, each $\sim$100 kpc wide and 40-60 Myr old. A backflow from the radio lobes might explain why the cavities are dynamically younger than the cocoon shock front. We also detect non-thermal X-ray emission from the eastern jet and from the large radio lobes. The X-ray emission from the jet is visible at 80 kpc from the AGN and can be accounted for by an IC model with a mild Doppler boosting ($\delta\sim2.7$). A synchrotron model could explain the radio-to-X-ray spectrum only for very high Lorentz factors $\gamma\geq10^{8}$ of the electrons in the jet. For the large radio lobes, we argue that the X-ray emission has an IC origin, with a 1 keV flux density of $21.7\pm1.4\text{(statistical)}\pm1.3\text{(systematic)}$ nJy. A thermal model is unlikely, as it would require unrealistically high gas temperature, density, and pressure, along with a strong depolarization of the radio lobes, which are instead highly polarized. The IC detection, combined with the synchrotron flux density, suggests a magnetic field of $12\pm3\mu$G in the lobes.
Figures


Figures from the paper (2 more)


Reference graph
Works this paper leans on
-
[1]
, " * write output.state after.block = add.period write newline
ENTRY address archiveprefix author booktitle chapter edition editor howpublished institution eprint journal key month note number organization pages publisher school series title type volume year label extra.label sort.label short.list INTEGERS output.state before.all mid.sentence after.sentence after.block FUNCTION init.state.consts #0 'before.all := #1 ...
-
[2]
write newline
" write newline "" before.all 'output.state := FUNCTION n.dashify 't := "" t empty not t #1 #1 substring "-" = t #1 #2 substring "--" = not "--" * t #2 global.max substring 't := t #1 #1 substring "-" = "-" * t #2 global.max substring 't := while if t #1 #1 substring * t #2 global.max substring 't := if while FUNCTION word.in bbl.in " " * FUNCTION format....
-
[3]
Allen , S. W. & Fabian , A. C. 1997, , 286, 583
1997
-
[4]
J., & Scott , P
Asplund , M., Grevesse , N., Sauval , A. J., & Scott , P. 2009, , 47, 481
2009
-
[5]
Bai , J. M. & Lee , M. G. 2003, , 585, L113
2003
-
[6]
A., McNamara , B
B \^ rzan , L., Rafferty , D. A., McNamara , B. R., Wise , M. W., & Nulsen , P. E. J. 2004, , 607, 800
2004
-
[7]
Blumenthal , G. R. & Gould , R. J. 1970, Reviews of Modern Physics, 42, 237
1970
-
[8]
Y., Lebedeva , O
Braude , S. Y., Lebedeva , O. M., Megn , A. V., Ryabov , B. P., & Zhouck , I. N. 1969, , 143, 289
1969
Show all 88 references
-
[9]
1999, , 342, 57
Brunetti , G., Comastri , A., Setti , G., & Feretti , L. 1999, , 342, 57
1999
-
[10]
Burn , B. J. 1966, , 133, 67
1966
-
[11]
J., et al
Capetti , A., Buttiglione , S., Axon , D. J., et al. 2011, , 527, L2
2011
-
[12]
W., Donahue , M., Voit , G
Cavagnolo , K. W., Donahue , M., Voit , G. M., & Sun , M. 2009, , 182, 12
2009
-
[13]
o hringer , H., Krause , M., & Tr \
Chon , G., B \"o hringer , H., Krause , M., & Tr \"u mper , J. 2012, , 545, L3
2012
-
[14]
S., Georganopoulos , M., et al
Clautice , D., Perlman , E. S., Georganopoulos , M., et al. 2016, , 826, 109
2016
-
[15]
H., Hardcastle , M
Croston , J. H., Hardcastle , M. J., Harris , D. E., et al. 2005, , 626, 733
2005
-
[16]
H., Kraft , R
Croston , J. H., Kraft , R. P., Hardcastle , M. J., et al. 2009, , 395, 1999
2009
-
[17]
P., Nulsen , P
David , L. P., Nulsen , P. E. J., McNamara , B. R., et al. 2001, , 557, 546
2001
-
[18]
& Molendi , S
de Grandi , S. & Molendi , S. 2009, , 508, 565
2009
-
[19]
N., Wise , M
de Vries , M. N., Wise , M. W., Huppenkothen , D., et al. 2018, , 478, 4010
2018
-
[20]
Dreher , J. W. & Feigelson , E. D. 1984, , 308, 43
1984
-
[21]
2010, , 516, A18
Dubus , G., Cerutti , B., & Henri , G. 2010, , 516, A18
2010
-
[22]
T., Worrall , D
Duffy , R. T., Worrall , D. M., Birkinshaw , M., et al. 2018, , 476, 4848
2018
-
[23]
2020, The Open Journal of Astrophysics, 3, 12
Eckert , D., Finoguenov , A., Ghirardini , V., et al. 2020, The Open Journal of Astrophysics, 3, 12
2020
-
[24]
Fabian , A. C. 1994, , 32, 277
1994
-
[25]
Fabian , A. C. 2012, , 50, 455
2012
-
[26]
Fanaroff , B. L. & Riley , J. M. 1974, , 167, 31P
1974
-
[27]
D., Laurent-Muehleisen , S
Feigelson , E. D., Laurent-Muehleisen , S. A., Kollgaard , R. I., & Fomalont , E. B. 1995, , 449, L149
1995
-
[28]
2011, , 411, 349
Gaspari , M., Melioli , C., Brighenti , F., & D'Ercole , A. 2011, , 411, 349
2011
-
[29]
2020, Nature Astronomy, 4, 10
Gaspari , M., Tombesi , F., & Cappi , M. 2020, Nature Astronomy, 4, 10
2020
-
[30]
G., & Mastichiadis , A
Georganopoulos , M., Kirk , J. G., & Mastichiadis , A. 2001, , 561, 111
2001
-
[31]
M., O'Dea , C
Gill , A., Boyce , M. M., O'Dea , C. P., et al. 2021, , 912, 88
2021
-
[32]
Gitti , M., Brighenti , F., & McNamara , B. R. 2012, Advances in Astronomy, 2012, 950641
2012
-
[33]
Gizani , N. A. B., Cohen , A., & Kassim , N. E. 2005, , 358, 1061
2005
-
[34]
Gizani , N. A. B. & Leahy , J. P. 2003, , 342, 399
2003
-
[35]
Gizani , N. A. B. & Leahy , J. P. 2004, , 350, 865
2004
-
[36]
& Feretti , L
Govoni , F. & Feretti , L. 2004, International Journal of Modern Physics D, 13, 1549
2004
-
[37]
J., Birkinshaw , M., Cameron , R
Hardcastle , M. J., Birkinshaw , M., Cameron , R. A., et al. 2002, , 581, 948
2002
-
[38]
J., Birkinshaw , M., & Worrall , D
Hardcastle , M. J., Birkinshaw , M., & Worrall , D. M. 1998, , 294, 615
1998
-
[39]
Hardcastle , M. J. & Croston , J. H. 2005, , 363, 649
2005
-
[40]
Hardcastle , M. J. & Croston , J. H. 2010, , 404, 2018
2010
-
[41]
Hardcastle , M. J. & Croston , J. H. 2020, , 88, 101539
2020
-
[42]
Harris , D. E. & Grindlay , J. E. 1979, , 188, 25
1979
-
[43]
J., Croston , J
Harwood , J. J., Croston , J. H., Intema , H. T., et al. 2016, , 458, 4443
2016
-
[44]
2016, , 594, A116
HI4PI Collaboration , Ben Bekhti , N., Fl \"o er , L., et al. 2016, , 594, A116
2016
-
[45]
S., Nandra , K., Clerc , N., & Gaspari , M
Hofmann , F., Sanders , J. S., Nandra , K., Clerc , N., & Gaspari , M. 2016, , 585, A130
2016
-
[46]
G., Schaye , J., Schaller , M., & Nobels , F
Hu s ko , F., Lacey , C. G., Schaye , J., Schaller , M., & Nobels , F. S. J. 2022, , 516, 3750
2022
-
[47]
2005, , 632, 781
Isobe , N., Makishima , K., Tashiro , M., & Hong , S. 2005, , 632, 781
2005
-
[48]
2002, , 580, L111
Isobe , N., Tashiro , M., Makishima , K., et al. 2002, , 580, L111
2002
-
[49]
S., Gandhi , P., et al
Isobe , N., Tashiro , M. S., Gandhi , P., et al. 2009, , 706, 454
2009
-
[50]
J., Croston , J
Konar , C., Hardcastle , M. J., Croston , J. H., & Saikia , D. J. 2009, , 400, 480
2009
-
[51]
Laing , R. A. 1980, , 193, 439
1980
-
[52]
2019, , 484, 3376
Liu , W., Sun , M., Nulsen , P., et al. 2019, , 484, 3376
2019
-
[53]
Mathews , W. G. 2014, , 783, 42
2014
-
[54]
J., Gaspari , M., et al
McKinley , B., Tingay , S. J., Gaspari , M., et al. 2022, Nature Astronomy, 6, 109
2022
-
[55]
McNamara , B. R. & Nulsen , P. E. J. 2007, , 45, 117
2007
-
[56]
McNamara , B. R. & Nulsen , P. E. J. 2012, New Journal of Physics, 14, 055023
2012
-
[57]
L., Sadun , A
Meier , D. L., Sadun , A. C., & Lind , K. R. 1991, , 379, 141
1991
-
[58]
2019, , 486, 5430
Mernier , F., Werner , N., Bagchi , J., et al. 2019, , 486, 5430
2019
-
[59]
2024, , 532, 3036
Mestici , S., Tombesi , F., Gaspari , M., Piconcelli , E., & Panessa , F. 2024, , 532, 3036
2024
-
[60]
J., Ineson , J., et al
Mingo , B., Hardcastle , M. J., Ineson , J., et al. 2017, , 470, 2762
2017
-
[61]
Nulsen , P. E. J., Hambrick , D. C., McNamara , B. R., et al. 2005 a , , 625, L9
2005
-
[62]
Nulsen , P. E. J., McNamara , B. R., Wise , M. W., & David , L. P. 2005 b , , 628, 629
2005
-
[63]
P., Baum , S
O'Dea , C. P., Baum , S. A., Tremblay , G. R., et al. 2013, , 771, 38
2013
-
[64]
2017, Nature Astronomy, 1, 0194
Padovani , P. 2017, Nature Astronomy, 1, 0194
2017
-
[65]
Perley , R. A. & Butler , B. J. 2017, , 230, 7
2017
-
[66]
Perucho , M., L \'o pez-Miralles , J., Gizani , N. A. B., Mart \' , J. M., & Boccardi , B. 2023, , 523, 3583
2023
-
[67]
2024, arXiv e-prints, arXiv:2410.21366
Prunier , M., Hlavacek-Larrondo , J., Pillepich , A., Lehle , K., & Nelson , D. 2024, arXiv e-prints, arXiv:2410.21366
2024 arXiv
-
[68]
W., Forman , W
Randall , S. W., Forman , W. R., Giacintucci , S., et al. 2011, , 726, 86
2011
-
[69]
Sadun , A. C. & Morrison , P. 2002, , 123, 2312
2002
-
[70]
Saikia , D. J. 2022, Journal of Astrophysics and Astronomy, 43, 97
2022
-
[71]
1999, , 350, 25
Siebert , J., Kawai , N., & Brinkmann , W. 1999, , 350, 25
1999
-
[72]
Singh , K. P. 2022, Journal of Astrophysics and Astronomy, 43, 85
2022
-
[73]
C., Nulsen , P
Snios , B., Johnson , A. C., Nulsen , P. E. J., et al. 2020, , 891, 173
2020
-
[74]
Snios , B., Nulsen , P. E. J., Wise , M. W., et al. 2018, , 855, 71
2018
-
[75]
D., Bykov , A
Sokoloff , D. D., Bykov , A. A., Shukurov , A., et al. 1998, , 299, 189
1998
-
[76]
& Binney , J
Tabor , G. & Binney , J. 1993, , 263, 323
1993
-
[77]
M., & Urry , C
Tavecchio , F., Maraschi , L., Sambruna , R. M., & Urry , C. M. 2000, , 544, L23
2000
-
[78]
J., Callingham , J
Timmerman , R., van Weeren , R. J., Callingham , J. R., et al. 2022, , 658, A5
2022
-
[79]
N., et al
Tombesi , F., Cappi , M., Reeves , J. N., et al. 2013, , 430, 1102
2013
-
[80]
F., et al
Tombesi , F., Tazaki , F., Mushotzky , R. F., et al. 2014, , 443, 2154
2014
-
[81]
& David , L
Tucker , W. & David , L. P. 1997, , 484, 602
1997
-
[82]
2023, , 944, 216
Ubertosi , F., Gitti , M., Brighenti , F., et al. 2023, , 944, 216
2023
-
[83]
Urry , C. M. & Padovani , P. 1995, , 107, 803
1995
-
[84]
R., Churazov , E., & Scannapieco , E
Werner , N., McNamara , B. R., Churazov , E., & Scannapieco , E. 2019, , 215, 5
2019
-
[85]
& Gaspari , M
Wittor , D. & Gaspari , M. 2020, , 498, 4983
2020
-
[86]
Worrall , D. M. 2009, , 17, 1
2009
-
[87]
S., Isobe , N., et al
Yaji , Y., Tashiro , M. S., Isobe , N., et al. 2010, , 714, 37
2010
-
[88]
2005, , 626, 748
Young , A., Rudnick , L., Katz , D., et al. 2005, , 626, 748
2005
Reviewed August 12, 2026 · model on record in the stance chip above.
Discussion (0). Continue with ORCID to comment.