Improving Reproducibility in Evaluation through Multi-Level Annotator Modeling
Pith reviewed 2026-05-14 19:27 UTC · model grok-4.3
Add this Pith Number to your LaTeX paper
What is a Pith Number?\usepackage{pith}
\pithnumber{Q2XUZPOL}
Prints a linked pith:Q2XUZPOL badge after your title and writes the identifier into PDF metadata. Compiles on arXiv with no extra files. Learn more
The pith
Multi-level bootstrapping models annotator variance to find the N and K needed for statistically significant evaluations.
A machine-rendered reading of the paper's core claim, the machinery that carries it, and where it could break.
Core claim
Leveraging datasets with large numbers of ratings and persistent rater identifiers, the multi-level bootstrapping approach realistically models annotator behavior and quantifies the tradeoffs between the number of items N and the number of responses per item K required to achieve statistical significance.
What carries the argument
Multi-level bootstrapping that resamples ratings at both the item level and the individual annotator level using persistent rater identifiers to capture variance.
If this is right
- Evaluation protocols can optimize the balance of items and annotations per item to reach statistical significance with fewer total ratings.
- Persistent tracking of individual raters becomes a necessary feature for future evaluation datasets.
- Standard small-K practices (three to five annotations) are shown to be insufficient once annotator variance is modeled.
- Reproducibility improves when variance estimates come from multi-level resampling rather than simple averaging.
Where Pith is reading between the lines
- The same bootstrapping technique could be tested on annotation tasks outside AI safety, such as medical image labeling or content moderation.
- Benchmarks that release only aggregated labels would need to add rater metadata to support this style of analysis.
- Real-time annotation platforms could incorporate the method to decide on the fly when additional ratings are no longer improving significance.
Load-bearing premise
Datasets that contain large numbers of ratings per item together with persistent rater identifiers are available and representative of typical evaluation settings.
What would settle it
Apply the bootstrapping procedure to a fresh dataset that lacks persistent rater identifiers, compute the predicted N and K thresholds for significance, then run repeated real-world annotation campaigns at those sizes and check whether the observed stability matches the prediction.
Figures


read the original abstract
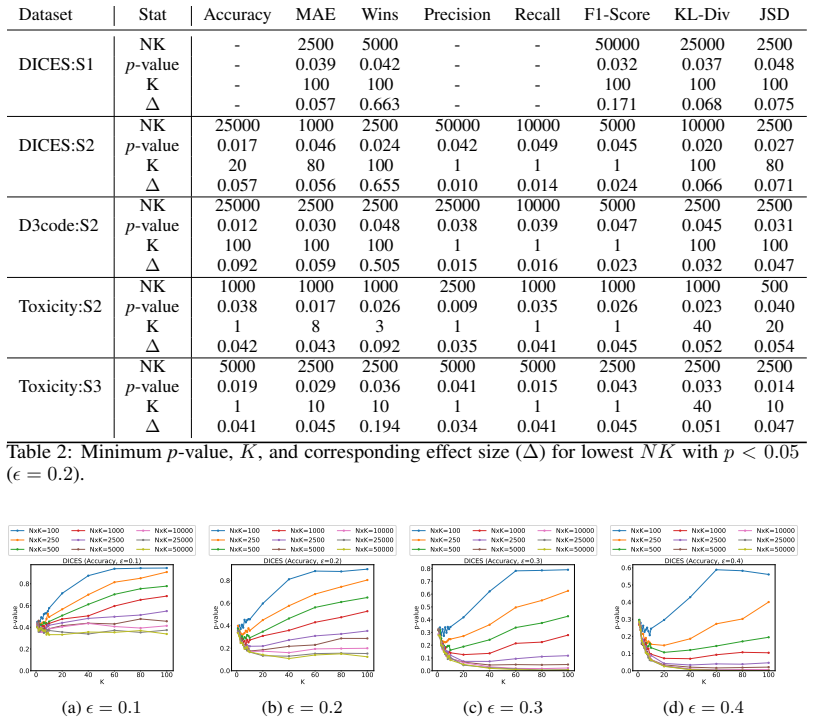
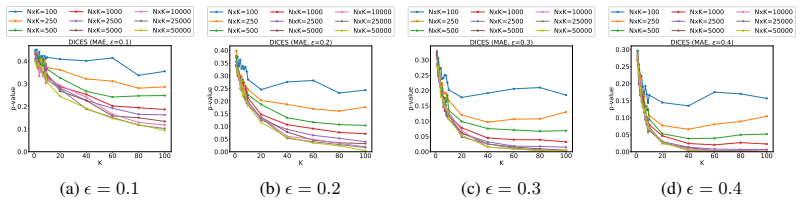
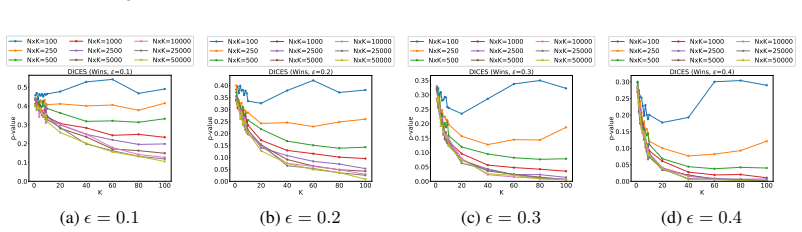
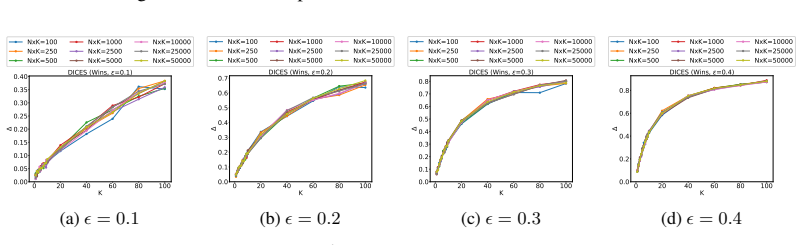
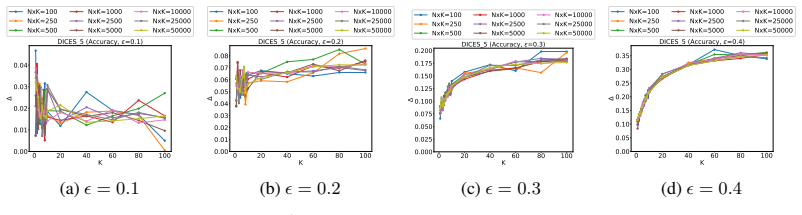
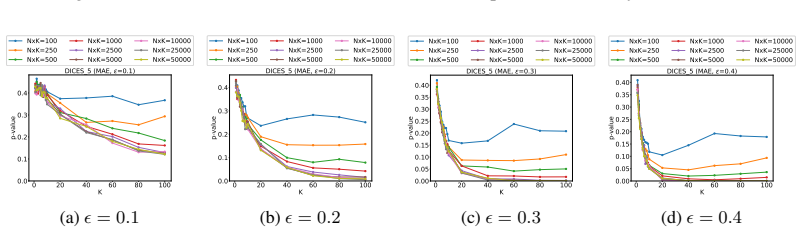
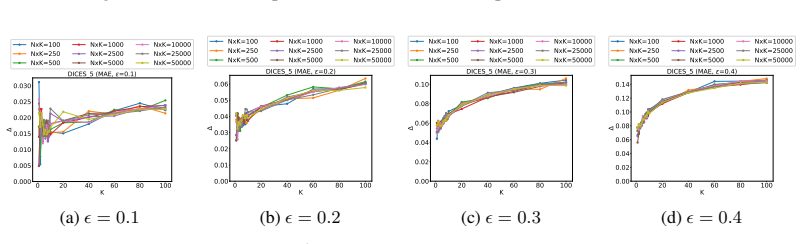
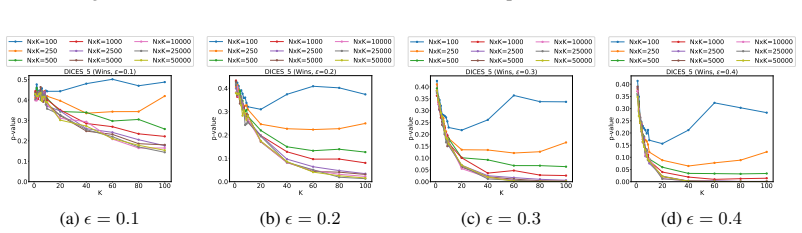
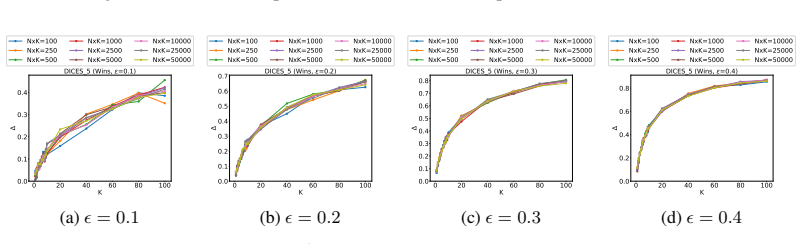
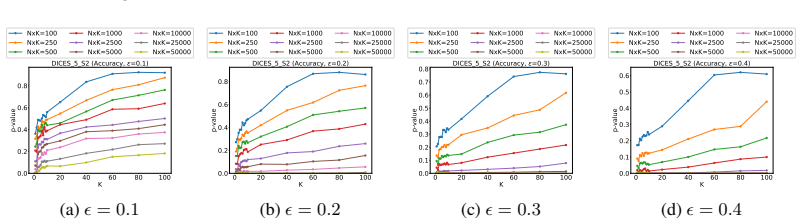
As generative AI models such as large language models (LLMs) become more pervasive, ensuring the safety, robustness, and overall trustworthiness of these systems is paramount. However, AI is currently facing a reproducibility crisis driven by unreliable evaluations and unrepeatable experimental results. While human raters are often used to assess models for utility and safety, they introduce divergent biases and subjective opinions into their annotations. Overcoming this variance is exceptionally challenging because very little data exists to study how experimental repeatability actually improves as the annotator pool grows. Standard evaluation practices typically rely on a small number of annotations per item (often 3 to 5) and lack the persistent rater identifiers necessary to model individual variance across items. In this work, we introduce a multi-level bootstrapping approach to realistically model annotator behavior. Leveraging datasets with a large number of ratings and persistent rater identifiers, we analyze the tradeoffs between the number of items ($N$) and the number of responses per item ($K$) required to achieve statistical significance.
Editorial analysis
A structured set of objections, weighed in public.
Referee Report
Summary. The manuscript introduces a multi-level bootstrapping approach to model annotator behavior and variance in human evaluations of generative AI models. Leveraging datasets with large numbers of ratings per item and persistent rater identifiers, the authors analyze tradeoffs between the number of items (N) and responses per item (K) required to reach statistical significance, with the goal of improving reproducibility in safety and utility assessments.
Significance. If validated, the work could supply practical, data-driven guidelines for annotation study design that reduce the impact of rater variance on evaluation reliability. The use of real persistent-rater datasets to ground the variance model is a clear strength relative to purely synthetic or single-level approaches common in the literature.
major comments (2)
- [Abstract and §3] Abstract and §3 (Method): the multi-level bootstrapping procedure is described only at a high level with no equations, pseudocode, or explicit variance decomposition (e.g., item-level, rater-level, and residual components). This is load-bearing for the central N/K tradeoff claims, as the reported statistical-significance thresholds depend directly on how the bootstrap samples across levels.
- [§4 and §5] §4 (Experiments) and §5 (Results): no held-out validation is reported that compares the bootstrapped significance predictions against actual repeated annotation trials on ordinary small-K (K=3–5) datasets without persistent rater IDs. Without this check, it remains unclear whether the derived tradeoffs generalize or introduce dataset-specific artifacts.
minor comments (2)
- [§5] Ensure the precise definition of 'statistical significance' (p-value threshold, confidence-interval width, or power target) is stated explicitly and used consistently when reporting the N/K curves.
- [Figures] Figure captions should include the exact bootstrap parameters (number of resamples, stratification rules) so readers can reproduce the plotted tradeoffs.
Simulated Author's Rebuttal
We thank the referee for their constructive comments. We address each major comment below and indicate the revisions we will make.
read point-by-point responses
-
Referee: [Abstract and §3] Abstract and §3 (Method): the multi-level bootstrapping procedure is described only at a high level with no equations, pseudocode, or explicit variance decomposition (e.g., item-level, rater-level, and residual components). This is load-bearing for the central N/K tradeoff claims, as the reported statistical-significance thresholds depend directly on how the bootstrap samples across levels.
Authors: We agree that a more formal description is needed. In the revised manuscript we will add the explicit equations for the multi-level bootstrap, including the variance decomposition into item-level, rater-level, and residual components, together with pseudocode that shows the sampling procedure at each level. This will make transparent how the bootstrap produces the reported N/K significance thresholds. revision: yes
-
Referee: [§4 and §5] §4 (Experiments) and §5 (Results): no held-out validation is reported that compares the bootstrapped significance predictions against actual repeated annotation trials on ordinary small-K (K=3–5) datasets without persistent rater IDs. Without this check, it remains unclear whether the derived tradeoffs generalize or introduce dataset-specific artifacts.
Authors: We acknowledge the value of such validation. Our work relies on the rare datasets that contain both large K and persistent rater identifiers; ordinary small-K evaluations lack these identifiers, so direct comparison would require new annotation campaigns that are outside the scope of the present study. We will add an explicit limitations paragraph discussing this constraint and its implications for generalizability. revision: partial
- Direct held-out validation against actual repeated trials on small-K datasets without persistent rater IDs, which would require new data collection.
Circularity Check
No circularity detected in bootstrapping-based tradeoff analysis
full rationale
The paper's core contribution is a multi-level bootstrapping procedure applied to external datasets that already contain large numbers of ratings and persistent rater identifiers. This procedure is used to empirically measure how statistical significance varies with N and K; the resulting tradeoffs are outputs of the bootstrap on held-out data rather than quantities defined in terms of themselves. No equations, fitted parameters, or self-citations are shown that would make any reported prediction equivalent to its own input by construction. The method therefore remains self-contained against the provided data sources.
Axiom & Free-Parameter Ledger
Reference graph
Works this paper leans on
-
[1]
Reproducibility Checklist , 2023
AAAI. Reproducibility Checklist , 2023. URL https://aaai.org/conference/aaai/aaai-23/reproducibility-checklist/. Accessed: 2024-04-21
work page 2023
-
[2]
ACL. ACL Rolling Review , 2024. URL http://aclrollingreview.org/responsibleNLPresearch/. Accessed: 2024-04-21
work page 2024
-
[3]
Dices dataset: Diversity in conversational ai evaluation for safety
Lora Aroyo, Alex Taylor, Mark D\' az, Christopher Homan, Alicia Parrish, Gregory Serapio-Garc\' a, Vinodkumar Prabhakaran, and Ding Wang. Dices dataset: Diversity in conversational ai evaluation for safety. In A. Oh, T. Neumann, A. Globerson, K. Saenko, M. Hardt, and S. Levine, editors, Advances in Neural Information Processing Systems, volume 36, pages 5...
work page 2023
-
[4]
1,500 scientists lift the lid on reproducibility
Monya Baker. 1,500 scientists lift the lid on reproducibility. Nature, 533 0 (7604): 0 452--454, May 2016. ISSN 1476-4687. doi:10.1038/533452a. URL https://www.nature.com/articles/533452a
-
[5]
Francesco Barile, Shabnam Najafian, Tim Draws, Oana Inel, Alisa Rieger, Rishav Hada, and Nava Tintarev. Toward benchmarking group explanations: Evaluating the effect of aggregation strategies versus explanation. In Perspectives on the Evaluation of Recommender Systems Workshop 2021: co-located with the 15th ACM Conference on Recommender Systems (RecSys 20...
work page 2021
-
[6]
We need to consider disagreement in evaluation
Valerio Basile, Michael Fell, Tommaso Fornaciari, Dirk Hovy, Silviu Paun, Barbara Plank, Massimo Poesio, and Alexandra Uma. We need to consider disagreement in evaluation. In Kenneth Church, Mark Liberman, and Valia Kordoni, editors, Proceedings of the 1st Workshop on Benchmarking: Past, Present and Future, pages 15--21, Online, August 2021. Association f...
-
[7]
Toward a perspectivist turn in ground truthing for predictive computing
Federico Cabitza, Andrea Campagner, and Valerio Basile. Toward a perspectivist turn in ground truthing for predictive computing. Proceedings of the AAAI Conference on Artificial Intelligence, 37 0 (6): 0 6860--6868, Jun. 2023. doi:10.1609/aaai.v37i6.25840. URL https://ojs.aaai.org/index.php/AAAI/article/view/25840
-
[8]
An examination of generative ai response to suicide inquires: content analysis
Laurie O Campbell, Kathryn Babb, Glenn W Lambie, and B Grant Hayes. An examination of generative ai response to suicide inquires: content analysis. JMIR Mental Health, 12: 0 e73623, 2025
work page 2025
-
[9]
Aida Mostafazadeh Davani, Mark Díaz, Dylan Baker, and Vinodkumar Prabhakaran. D3CODE : Disentangling Disagreements in Data across Cultures on Offensiveness Detection and Evaluation , April 2024. URL http://arxiv.org/abs/2404.10857. arXiv:2404.10857 [cs]
-
[10]
Jesse Dodge, Suchin Gururangan, Dallas Card, Roy Schwartz, and Noah A. Smith. Show your work: Improved reporting of experimental results. In Kentaro Inui, Jing Jiang, Vincent Ng, and Xiaojun Wan, editors, Proceedings of the 2019 Conference on Empirical Methods in Natural Language Processing and the 9th International Joint Conference on Natural Language Pr...
-
[11]
The reproducibility crisis is real
Odd Erik Gundersen. The reproducibility crisis is real. AI Magazine, 41 0 (3): 0 103--106, Sep. 2020. doi:10.1609/aimag.v41i3.5318. URL https://ojs.aaai.org/aimagazine/index.php/aimagazine/article/view/5318
-
[12]
State of the art: Reproducibility in artificial intelligence
Odd Erik Gundersen and Sigbjørn Kjensmo. State of the art: Reproducibility in artificial intelligence. Proceedings of the AAAI Conference on Artificial Intelligence, 32 0 (1): 0 1644--1651, Apr. 2018. doi:10.1609/aaai.v32i1.11503. URL https://ojs.aaai.org/index.php/AAAI/article/view/11503
-
[13]
Christopher M Homan, Flip Korn, Deepak Pandita, and Chris Welty. How many ratings per item are necessary for reliable significance testing? In Vera Demberg, Kentaro Inui, and Llu \'i s Marquez, editors, Findings of the A ssociation for C omputational L inguistics: EACL 2026 , pages 4258--4273, Rabat, Morocco, March 2026. Association for Computational Ling...
-
[14]
Artificial intelligence faces reproducibility crisis
Matthew Hutson. Artificial intelligence faces reproducibility crisis. Science, 359 0 (6377): 0 725--726, 2018. doi:10.1126/science.359.6377.725. URL https://www.science.org/doi/abs/10.1126/science.359.6377.725
-
[15]
ICML 2023 Paper Guidelines , 2023
ICML. ICML 2023 Paper Guidelines , 2023. URL https://icml.cc/Conferences/2023/PaperGuidelines. Accessed: 2024-04-21
work page 2023
-
[16]
Reproducibility Guidelines – IJCAI - ECAI 2022, 2022
IJCAI. Reproducibility Guidelines – IJCAI - ECAI 2022, 2022. URL https://ijcai-22.org/reproducibility/. Accessed: 2024-04-21
work page 2022
-
[17]
Leakage and the reproducibility crisis in ml-based science, 2022
Sayash Kapoor and Arvind Narayanan. Leakage and the reproducibility crisis in ml-based science, 2022. URL https://arxiv.org/abs/2207.07048
-
[18]
Designing toxic content classification for a diversity of perspectives
Deepak Kumar, Patrick Gage Kelley, Sunny Consolvo, Joshua Mason, Elie Bursztein, Zakir Durumeric, Kurt Thomas, and Michael Bailey. Designing toxic content classification for a diversity of perspectives. In Seventeenth Symposium on Usable Privacy and Security (SOUPS 2021), pages 299--318, 2021. URL https://www.usenix.org/conference/soups2021/presentation/kumar
work page 2021
-
[19]
Community perspective on replicability in natural language processing
Margot Mieskes, Kar \"e n Fort, Aur \'e lie N \'e v \'e ol, Cyril Grouin, and Kevin Cohen. Community perspective on replicability in natural language processing. In Ruslan Mitkov and Galia Angelova, editors, Proceedings of the International Conference on Recent Advances in Natural Language Processing (RANLP 2019), pages 768--775, Varna, Bulgaria, Septembe...
-
[20]
Dealing with Disagreements: Looking Beyond the Majority Vote in Subjective Annotations
Aida Mostafazadeh Davani, Mark D \'i az, and Vinodkumar Prabhakaran. Dealing with disagreements: Looking beyond the majority vote in subjective annotations. Transactions of the Association for Computational Linguistics, 10: 0 92--110, 2022. doi:10.1162/tacl_a_00449. URL https://aclanthology.org/2022.tacl-1.6/
-
[21]
PaperInformation / PaperChecklist , 2021
NeurIPS. PaperInformation / PaperChecklist , 2021. URL https://neurips.cc/Conferences/2021/PaperInformation/PaperChecklist. Accessed: 2024-04-21
work page 2021
-
[22]
Forest vs tree: The (n, k) trade-off in reproducible ml evaluation
Deepak Pandita, Flip Korn, Chris Welty, and Christopher M Homan. Forest vs tree: The (n, k) trade-off in reproducible ml evaluation. Proceedings of the AAAI Conference on Artificial Intelligence, 40 0 (29): 0 24736--24744, Mar. 2026. doi:10.1609/aaai.v40i29.39659. URL https://ojs.aaai.org/index.php/AAAI/article/view/39659
-
[23]
Problems and Opportunities in Training Deep Learning Software Systems : An Analysis of Variance
Hung Viet Pham, Shangshu Qian, Jiannan Wang, Thibaud Lutellier, Jonathan Rosenthal, Lin Tan, Yaoliang Yu, and Nachiappan Nagappan. Problems and Opportunities in Training Deep Learning Software Systems : An Analysis of Variance . In 2020 35th IEEE / ACM International Conference on Automated Software Engineering ( ASE ) , pages 771--783, September 2020. URL...
-
[24]
On releasing annotator-level labels and information in datasets
Vinodkumar Prabhakaran, Aida Mostafazadeh Davani, and Mark Diaz. On releasing annotator-level labels and information in datasets. In Claire Bonial and Nianwen Xue, editors, Proceedings of the Joint 15th Linguistic Annotation Workshop (LAW) and 3rd Designing Meaning Representations (DMR) Workshop, pages 133--138, Punta Cana, Dominican Republic, November 20...
-
[25]
A step toward quantifying independently reproducible machine learning research
Edward Raff. A step toward quantifying independently reproducible machine learning research. In H. Wallach, H. Larochelle, A. Beygelzimer, F. d Alch\' e -Buc, E. Fox, and R. Garnett, editors, Advances in Neural Information Processing Systems, volume 32, Vancouver, Canada, 2019. Curran Associates, Inc. URL https://proceedings.neurips.cc/paper_files/paper/2...
work page 2019
-
[26]
Soft metrics for evaluation with disagreements: an assessment
Giulia Rizzi, Elisa Leonardelli, Massimo Poesio, Alexandra Uma, Maja Pavlovic, Silviu Paun, Paolo Rosso, and Elisabetta Fersini. Soft metrics for evaluation with disagreements: an assessment. In Gavin Abercrombie, Valerio Basile, Davide Bernadi, Shiran Dudy, Simona Frenda, Lucy Havens, and Sara Tonelli, editors, Proceedings of the 3rd Workshop on Perspect...
work page 2024
-
[27]
`just what do you think you ' re doing, dave?' a checklist for responsible data use in NLP
Anna Rogers, Timothy Baldwin, and Kobi Leins. `just what do you think you ' re doing, dave?' a checklist for responsible data use in NLP . In Marie-Francine Moens, Xuanjing Huang, Lucia Specia, and Scott Wen-tau Yih, editors, Findings of the Association for Computational Linguistics: EMNLP 2021, pages 4821--4833, Punta Cana, Dominican Republic, November 2...
-
[28]
Shi, J., Zhong, Y ., Xu, N., Li, Y ., and Xu, C
Harald Semmelrock, Tony Ross-Hellauer, Simone Kopeinik, Dieter Theiler, Maximilian Haberl, Stefan Thalmann, and Dominik Kowald. Reproducibility in machine-learning-based research: Overview, barriers, and drivers. AI Magazine, 46: 0 e70002, 2025. https://doi.org/10.1002/aaai.70002
-
[29]
Cheap and fast--but is it good? evaluating non-expert annotations for natural language tasks
Rion Snow, Brendan O’connor, Dan Jurafsky, and Andrew Y Ng. Cheap and fast--but is it good? evaluating non-expert annotations for natural language tasks. In Proceedings of the 2008 conference on empirical methods in natural language processing, pages 254--263, 2008
work page 2008
-
[30]
KhudaBukhsh , and Christopher Homan
Tharindu Cyril Weerasooriya , Alexander Ororbia , Raj Bhensadadia , Ashiqur R. KhudaBukhsh , and Christopher Homan . Disagreement Matters : Preserving Label Diversity by Jointly Modeling Item and Annotator Label Distributions with DisCo . Annual Meeting of the Association for Computational Linguistics, 2023. doi:10.18653/v1/2023.findings-acl.287. S2ID: cc...
-
[31]
Shira Wein, Christopher Homan, Lora Aroyo, and Chris Welty. Follow the leader(board) with confidence: Estimating p-values from a single test set with item and response variance. In Anna Rogers, Jordan Boyd-Graber, and Naoaki Okazaki, editors, Findings of the Association for Computational Linguistics: ACL 2023, pages 3138--3161, Toronto, Canada, July 2023....
discussion (0)
Sign in with ORCID, Apple, or X to comment. Anyone can read and Pith papers without signing in.