Dwarf and Intermediate-Mass Galaxies in MaNGA: Evidence for Different Evolutionary Trends
Pith reviewed 2026-05-20 04:39 UTC · model grok-4.3
The pith
Dwarf galaxies and intermediate-mass galaxies follow separate evolutionary trends below 10^10 solar masses
A machine-rendered reading of the paper's core claim, the machinery that carries it, and where it could break.
Core claim
By separating dwarf galaxies at log(M*/M⊙) ≤ 9.5 from intermediate-mass galaxies at 9.5 < log(M*/M⊙) < 10, the study finds that dwarfs remain predominantly star-forming with only weak dependence on local environment, whereas intermediate-mass galaxies show stronger trends toward quenching in denser environments. Dwarf ellipticals and lenticulars host systematically younger stellar populations than their intermediate-mass counterparts, indicating reduced quenching efficiency and more gradual environmental processing in the dwarf regime. This distinction is absent among spiral galaxies, whose properties appear insensitive to the dwarf versus intermediate-mass classification.
What carries the argument
The stellar mass division at log(M*/M⊙) = 9.5 that distinguishes dwarf from intermediate-mass galaxies, tracked through specific star formation rate, local environmental density, morphological types, and the D4000 index as a measure of long-term stellar aging.
If this is right
- Galaxy evolution models must treat dwarfs and intermediate-mass systems separately to capture the differing roles of environment in quenching.
- Early-type galaxies in the dwarf regime experience more gradual stellar aging than those just above the mass threshold.
- Studies of low-mass spirals can continue to group them without this split, but early-types require the distinction.
- Unified low-mass samples in surveys will mask key differences unless subdivided at this mass scale.
Where Pith is reading between the lines
- Simulations of galaxy formation could be refined by incorporating mass-dependent responses to environment around this threshold to better match observed quenching rates.
- The pattern suggests shallower gravitational potentials in dwarfs may allow them to retain gas longer despite external influences.
- Extending similar splits to higher-redshift samples could test whether these divergent trends appear early in cosmic time.
Load-bearing premise
The specific mass threshold of 9.5 in log solar masses marks a physically meaningful transition between distinct evolutionary behaviors rather than an arbitrary cut that could be shifted without altering the observed trends.
What would settle it
Repeating the full analysis after shifting the mass boundary to 9.0 or 9.8 and finding that the differences in environmental quenching trends and D4000 ages between the new groups remain identical or disappear would show the 9.5 value is not a special divider.
Figures


read the original abstract
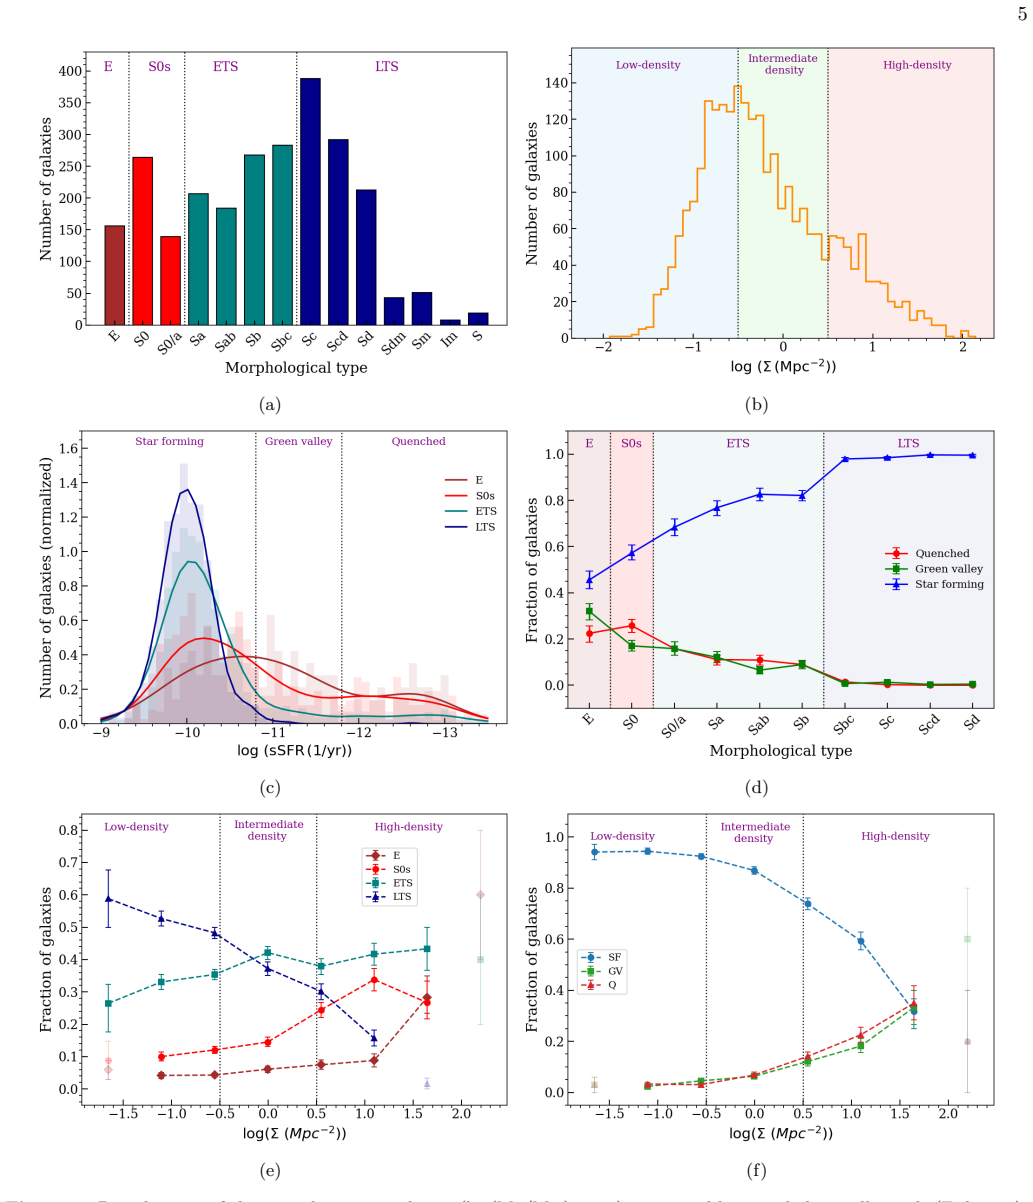
We investigate the interplay between morphology, specific star formation rate (sSFR), and local environment using a sample of 7,408 galaxies from the SDSS-IV MaNGA survey. Our analysis spans stellar masses from dwarf to massive galaxies, enabling a unified view of how stellar mass and environment regulate galaxy evolution. Galaxies are classified by morphology (ellipticals (E), lenticulars (S0s), early-type spirals (ETS), and late-type spirals (LTS)) and local environmental density, with star formation activity traced using sSFR. Low-mass galaxies ($\log (M_{\star}/M_{\odot}) < 10$) are predominantly star-forming and dominated by LTS, whereas high-mass galaxies ($\log (M_{\star}/M_{\odot}) \geq 10$) are dominated by ETS and are largely quenched. By separating dwarf ($\log (M_{\star}/M_{\odot}) \leq 9.5$) and intermediate-mass galaxies ($9.5 < \log (M_{\star}/M_{\odot}) < 10$), we find that dwarf galaxies remain predominantly star-forming with only weak environmental dependence, whereas intermediate-mass galaxies exhibit clearer environmental trends toward quenching. Using the D4000 index as a tracer of long-term stellar population aging, we further show that dwarf E and S0s host systematically younger stellar populations than their intermediate-mass counterparts, implying reduced quenching efficiency and more gradual environmental processing in the dwarf regime. This distinction is not evident among spiral galaxies, whose stellar population properties are comparatively insensitive to the dwarf versus non-dwarf classification. Overall, these results indicate that the commonly defined low-mass galaxy population is not homogeneous and that dwarf and intermediate-mass galaxies show systematically different evolutionary trends. Treating them separately is therefore essential for interpreting galaxy evolution in the low-mass regime.
Editorial analysis
A structured set of objections, weighed in public.
Referee Report
Summary. The manuscript analyzes 7408 galaxies from the MaNGA survey spanning dwarf to massive regimes. It classifies galaxies by morphology (E, S0, ETS, LTS), local environmental density, and star-formation activity via sSFR, while using the D4000 index to trace stellar-population aging. The central claim is that the low-mass population (log M*/M⊙ < 10) is inhomogeneous: dwarf galaxies (≤ 9.5) remain predominantly star-forming with only weak environmental dependence and host younger stellar populations in E/S0 types than intermediate-mass galaxies (9.5–10), which show clearer environmental quenching trends. Spiral galaxies show little difference across the dwarf/intermediate split. The authors conclude that dwarf and intermediate-mass galaxies must be treated separately to interpret low-mass galaxy evolution.
Significance. If the reported distinctions are robust, the work is significant for galaxy-evolution studies because it supplies direct observational evidence that the commonly adopted low-mass regime cannot be treated as a single category. The large, uniform MaNGA sample and standard tracers (sSFR, D4000) allow a clean separation of environmental and stellar-population trends, which could refine quenching models and halo-occupation prescriptions specifically in the dwarf regime.
major comments (1)
- [Abstract] Abstract and sample-division description: the threshold log(M*/M⊙) = 9.5 is adopted to separate dwarfs from intermediate-mass galaxies without demonstrated physical motivation (e.g., a break in the stellar-mass function, halo-mass scale, or scaling-relation inflection) or robustness tests against small shifts (9.3 or 9.7). Because the central claim of inhomogeneity rests on this specific partition, the absence of such justification or sensitivity analysis makes the distinction vulnerable to binning artifacts.
minor comments (2)
- Figure captions and axis labels should explicitly state the exact environmental-density metric (e.g., nearest-neighbor or group catalog) and the precise D4000 measurement aperture to aid reproducibility.
- The text should clarify whether the reported environmental trends remain significant after controlling for morphology or after applying the same mass cut to the full sample rather than only the low-mass subset.
Simulated Author's Rebuttal
We thank the referee for their careful reading of our manuscript and for providing constructive comments. We address the major comment point by point below.
read point-by-point responses
-
Referee: [Abstract] Abstract and sample-division description: the threshold log(M*/M⊙) = 9.5 is adopted to separate dwarfs from intermediate-mass galaxies without demonstrated physical motivation (e.g., a break in the stellar-mass function, halo-mass scale, or scaling-relation inflection) or robustness tests against small shifts (9.3 or 9.7). Because the central claim of inhomogeneity rests on this specific partition, the absence of such justification or sensitivity analysis makes the distinction vulnerable to binning artifacts.
Authors: We acknowledge the referee's concern that the choice of the log(M*/M⊙) = 9.5 threshold lacks explicit justification in the current version of the manuscript. This threshold is selected based on the point where the environmental dependence of star formation and the differences in stellar population ages become apparent in our MaNGA sample. It aligns with common definitions in the literature for separating dwarf galaxies from more massive systems. To address this, we will revise the manuscript to include a dedicated paragraph in the introduction or methods section providing the physical motivation, drawing from the break in the stellar mass function around 10^9.5 M⊙ and previous studies on galaxy quenching. Furthermore, we have conducted sensitivity analyses by varying the threshold to 9.3 and 9.7, and the key results regarding the distinct evolutionary trends remain robust. These revisions and additional tests will be incorporated into the revised manuscript. revision: yes
Circularity Check
No significant circularity in observational analysis of MaNGA data
full rationale
The paper conducts a direct statistical analysis of 7,408 galaxies from the MaNGA survey, binning by stellar mass, morphology, local density, sSFR, and D4000 index to compare trends. The division at log(M*/M⊙) = 9.5 is presented as a sample split to test for distinct behaviors in dwarf versus intermediate-mass regimes, with results reported as empirical differences in environmental dependence and stellar population ages. No equations, derivations, or predictions are described that reduce by construction to fitted inputs or self-referential definitions. No load-bearing self-citations or uniqueness theorems are invoked to force the central claim. The analysis remains self-contained as an observational extraction of trends from measured quantities, with the mass threshold functioning as an exploratory partition rather than a derived or tautological element.
Axiom & Free-Parameter Ledger
free parameters (1)
- mass division threshold =
9.5
axioms (2)
- domain assumption D4000 index serves as a reliable tracer of long-term stellar population aging
- domain assumption Specific star formation rate accurately classifies galaxies as star-forming or quenched
Lean theorems connected to this paper
-
IndisputableMonolith/Cost/FunctionalEquation.leanwashburn_uniqueness_aczel unclear?
unclearRelation between the paper passage and the cited Recognition theorem.
By separating dwarf (log(M⋆/M⊙) ≤ 9.5) and intermediate-mass galaxies (9.5 < log(M⋆/M⊙) < 10), we find that dwarf galaxies remain predominantly star-forming with only weak environmental dependence...
-
IndisputableMonolith/Foundation/AbsoluteFloorClosure.leanabsolute_floor_iff_bare_distinguishability unclear?
unclearRelation between the paper passage and the cited Recognition theorem.
Using the D4000 index as a tracer of long-term stellar population aging...
What do these tags mean?
- matches
- The paper's claim is directly supported by a theorem in the formal canon.
- supports
- The theorem supports part of the paper's argument, but the paper may add assumptions or extra steps.
- extends
- The paper goes beyond the formal theorem; the theorem is a base layer rather than the whole result.
- uses
- The paper appears to rely on the theorem as machinery.
- contradicts
- The paper's claim conflicts with a theorem or certificate in the canon.
- unclear
- Pith found a possible connection, but the passage is too broad, indirect, or ambiguous to say the theorem truly supports the claim.
Reference graph
Works this paper leans on
-
[1]
2017, MNRAS, 471, 2687, doi: 10.1093/mnras/stx1688
Bait, O., Barway, S., & Wadadekar, Y. 2017, MNRAS, 471, 2687, doi: 10.1093/mnras/stx1688
-
[2]
A., Acker , A., Frew , D., & et al
Baldry, I. K., Balogh, M. L., Bower, R. G., et al. 2006, MNRAS, 373, 469, doi: 10.1111/j.1365-2966.2006.11081.x Bichang’a, B., Kaviraj, S., Lazar, I., et al. 2024, MNRAS, 532, 613, doi: 10.1093/mnras/stae1441
-
[3]
Blanton, M. R., & Moustakas, J. 2009, ARA&A, 47, 159, doi: 10.1146/annurev-astro-082708-101734
-
[4]
A., Brinchmann, J., Bouch´ e, N., et al
Boogaard, L. A., Brinchmann, J., Bouch´ e, N., et al. 2018, A&A, 619, A27, doi: 10.1051/0004-6361/201833136
-
[5]
Bundy, K., Bershady, M. A., Law, D. R., et al. 2015, ApJ, 798, 7, doi: 10.1088/0004-637X/798/1/7
work page internal anchor Pith review doi:10.1088/0004-637x/798/1/7 2015
-
[6]
Chauhan, R., Subramanian, S., Kudari, D. A., Amrutha, S., & Das, M. 2025, arXiv e-prints, arXiv:2507.14695, doi: 10.48550/arXiv.2507.14695
-
[7]
Conselice, C. J. 2014, ARA&A, 52, 291, doi: 10.1146/annurev-astro-081913-040037
-
[8]
2007, ApJ, 670, 156, doi: 10.1086/521818
Daddi, E., Dickinson, M., Morrison, G., et al. 2007, ApJ, 670, 156, doi: 10.1086/521818
-
[9]
Darvish, B., Martin, C., Gon¸ calves, T. S., et al. 2018, ApJ, 853, 155, doi: 10.3847/1538-4357/aaa5a4
-
[10]
2007, A&A, 468, 33, doi: 10.1051/0004-6361:20077525
Elbaz, D., Daddi, E., Le Borgne, D., et al. 2007, A&A, 468, 33, doi: 10.1051/0004-6361:20077525
-
[11]
Gu, Y., Fang, G., Yuan, Q., Lu, S., & Liu, S. 2021, ApJ, 921, 60, doi: 10.3847/1538-4357/ac1ce0
-
[12]
Harris, C. R., Millman, K. J., van der Walt, S. J., et al. 2020, Nature, 585, 357, doi: 10.1038/s41586-020-2649-2
-
[13]
Hunter, J. D. 2007, Computing In Science & Engineering, 9, 90
work page 2007
-
[14]
Kauffmann, G., Heckman, T. M., Tremonti, C., et al. 2003a, MNRAS, 346, 1055, doi: 10.1111/j.1365-2966.2003.07154.x
-
[15]
doi:10.1046/j.1365-8711.2003.06637.x , eprint =
Kauffmann, G., Heckman, T. M., White, S. D. M., et al. 2003b, MNRAS, 341, 54, doi: 10.1046/j.1365-8711.2003.06292.x
-
[16]
and Glazebrook, Karl and Kacprzak, Glenn G
Kawinwanichakij, L., Papovich, C., Quadri, R. F., et al. 2017, ApJ, 847, 134, doi: 10.3847/1538-4357/aa8b75
-
[17]
Kim, K., Malhotra, S., Rhoads, J. E., et al. 2018, ApJ, 867, 118, doi: 10.3847/1538-4357/aae488
-
[18]
Kormendy, J., & Ho, L. C. 2013, ARA&A, 51, 511, doi: 10.1146/annurev-astro-082708-101811
work page internal anchor Pith review doi:10.1146/annurev-astro-082708-101811 2013
-
[19]
Lacerda, E. A. D., S´ anchez, S. F., Mej´ ıa-Narv´ aez, A., et al. 2022, NewA, 97, 101895, doi: 10.1016/j.newast.2022.101895
-
[20]
White, S. D. M. 2008, MNRAS, 385, 1903, doi: 10.1111/j.1365-2966.2008.13000.x
-
[21]
2023, ApJL, 955, L18, doi: 10.3847/2041-8213/acf470
Li, M., Cai, Z., Bian, F., et al. 2023, ApJL, 955, L18, doi: 10.3847/2041-8213/acf470
-
[22]
Mao, Z., Kodama, T., P´ erez-Mart´ ınez, J. M., et al. 2022, A&A, 666, A141, doi: 10.1051/0004-6361/202243733
-
[23]
2009, ApJ, 707, 250, doi: 10.1088/0004-637X/707/1/250
Martig, M., Bournaud, F., Teyssier, R., & Dekel, A. 2009, ApJ, 707, 250, doi: 10.1088/0004-637X/707/1/250
-
[24]
McGaugh, S. S., Schombert, J. M., & Lelli, F. 2017, ApJ, 851, 22, doi: 10.3847/1538-4357/aa9790
-
[25]
A new sample of AGNs in dwarf galaxies with spatially-resolved spectroscopy
Mezcua, M., & Dom´ ınguez S´ anchez, H. 2024, MNRAS, 528, 5252, doi: 10.1093/mnras/stae292
-
[26]
2025, MNRAS, 536, 295, doi: 10.1093/mnras/stae2615
Mezcua, M., & Dom´ ınguez S´ anchez, H. 2025, MNRAS, 536, 295, doi: 10.1093/mnras/stae2615
-
[27]
Noeske, K. G., Weiner, B. J., Faber, S. M., et al. 2007, ApJL, 660, L43, doi: 10.1086/517926
-
[28]
Peng, Y.-j., Lilly, S. J., Kovaˇ c, K., et al. 2010, ApJ, 721, 193, doi: 10.1088/0004-637X/721/1/193
-
[29]
2014, Serbian Astronomical Journal, 189, 1, doi: 10.2298/SAJ1489001S
Salim, S. 2014, Serbian Astronomical Journal, 189, 1, doi: 10.2298/SAJ1489001S
-
[30]
Salim, S., Boquien, M., & Lee, J. C. 2018, ApJ, 859, 11, doi: 10.3847/1538-4357/aabf3c
-
[31]
Salim, S., Lee, J. C., Janowiecki, S., et al. 2016, ApJS, 227, 2, doi: 10.3847/0067-0049/227/1/2 S´ anchez, S. F., Barrera-Ballesteros, J. K., Lacerda, E., et al. 2022, ApJS, 262, 36, doi: 10.3847/1538-4365/ac7b8f
-
[32]
Secrest, N. J., & Satyapal, S. 2020, ApJ, 900, 56, doi: 10.3847/1538-4357/ab9309
-
[33]
2023, MNRAS, 518, 724, doi: 10.1093/mnras/stac3092
Siudek, M., Mezcua, M., & Krywult, J. 2023, MNRAS, 518, 724, doi: 10.1093/mnras/stac3092
-
[34]
2015, ApJ, 805, 2, doi: 10.1088/0004-637X/805/1/2
Stierwalt, S., Besla, G., Patton, D., et al. 2015, ApJ, 805, 2, doi: 10.1088/0004-637X/805/1/2
-
[35]
2024, A&A, 681, A8, doi: 10.1051/0004-6361/202346536
Subramanian, S., Mondal, C., & Kalari, V. 2024, A&A, 681, A8, doi: 10.1051/0004-6361/202346536
-
[36]
Taylor, M. B. 2005, in Astronomical Society of the Pacific Conference Series, Vol. 347, Astronomical Data Analysis Software and Systems XIV, ed. P. Shopbell, M. Britton, & R. Ebert, 29 V´ azquez-Mata, J. A., Hern´ andez-Toledo, H. M.,
work page 2005
-
[37]
2022, MNRAS, 512, 2222, doi: 10.1093/mnras/stac635
Avila-Reese, V., et al. 2022, MNRAS, 512, 2222, doi: 10.1093/mnras/stac635
-
[38]
A., Bundy, K., Diamond-Stanic, A
Wake, D. A., Bundy, K., Diamond-Stanic, A. M., et al. 2017, AJ, 154, 86, doi: 10.3847/1538-3881/aa7ecc
-
[39]
Waskom, M. L. 2021, Journal of Open Source Software, 6, 3021, doi: 10.21105/joss.03021
discussion (0)
Sign in with ORCID, Apple, or X to comment. Anyone can read and Pith papers without signing in.