Datacubes of Hα, CaII K, CaII H and Hε line profiles of the full solar disk recorded daily at Meudon observatory since 2017 and some typical profiles of solar features
Pith reviewed 2026-05-20 08:23 UTC · model grok-4.3
The pith
Daily full-disk spectroscopic datacubes of Hα, CaII K, CaII H and Hε have been recorded at Meudon since 2017 and released publicly in raw and processed formats.
A machine-rendered reading of the paper's core claim, the machinery that carries it, and where it could break.
Core claim
Spectroscopic datacubes (x, y, λ) of the Hα (6562.8 Å), CaII K (3933.7 Å), CaII H (3968.5 Å) and Hε (3970.1 Å) lines are obtained daily over the entire solar disk, with the stated spectral and spatial resolutions, and are made available without restriction in level-0 TIF and level-1 FITS formats.
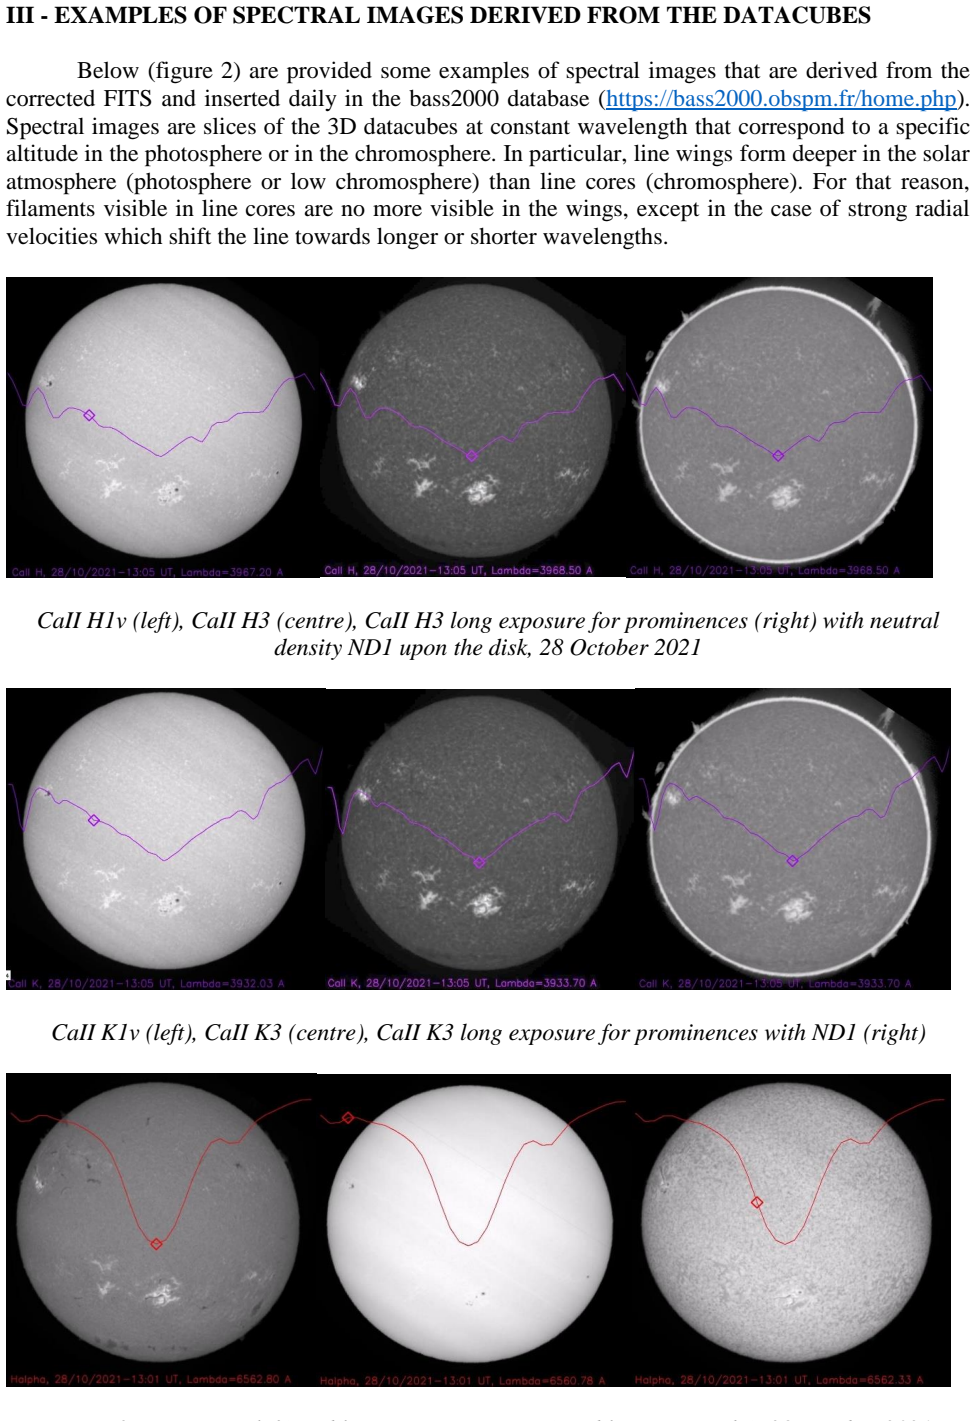
What carries the argument
The spectroheliograph equipped with a fast CCD camera that builds each datacube by scanning the solar disk while recording spectra at every position.
If this is right
- The datacubes allow quantitative extraction of Doppler shifts, line asymmetries and equivalent widths across the whole Sun each day.
- Typical line profiles for quiet Sun, active regions, filaments and prominences are supplied as reference templates for feature identification.
- Public release in standard FITS format supports direct comparison with data from other ground-based or space-borne solar observatories.
- The archive provides a consistent time series that can be used to track day-to-day evolution of chromospheric structures.
Where Pith is reading between the lines
- The daily cadence opens the possibility of building statistical samples of line-profile changes associated with solar flares or filament eruptions.
- Long-term accumulation of the datacubes could reveal systematic variations in chromospheric line parameters over the solar cycle.
- Automated analysis pipelines developed for these data could later be applied to similar full-disk spectroscopy from other telescopes.
Load-bearing premise
The instrument and reduction pipeline maintain the quoted spectral resolutions and spatial sampling on a daily basis despite typical 2-arcsecond seeing.
What would settle it
A side-by-side comparison of line widths or spatial detail in a released datacube against simultaneous spectra or images from an independent high-resolution instrument that shows systematic mismatch beyond the stated 0.15–0.25 Å or 1-arcsec limits.
Figures

read the original abstract
Systematic observations of the Sun are performed at Meudon observatory since 1908 under the form of monochromatic images. However, a major technical improvement occurred in 2017; since this date, spectroscopic datacubes are obtained daily with the spectroheliograph and a fast CCD camera. Line profiles of H$\alpha$ (6562.8 A), CaII K (3933.7 A), CaII H (3968.5 A) and H$\epsilon$ (3970.1 A in the wing of CaII H) are recorded over the full solar disk under the form of 3D FITS files (x, y, $\lambda$). The optical spectral resolution is 0.15 A for Calcium and H$\epsilon$ (0.093 A/pixel), and 0.25 A for H$\alpha$ (0.155 A/pixel); the spatial sampling is about 1 arc sec (the usual seeing is 2 arcsec). Datacubes are freely available since July 2017 in raw TIF (level 0) or processed FITS (level 1) format. Access to observations and typical line profiles associated to solar features are presented.
Editorial analysis
A structured set of objections, weighed in public.
Referee Report
Summary. The manuscript describes a daily full-disk solar spectroscopic observing program at Meudon observatory that began in 2017. Using the existing spectroheliograph and a fast CCD camera, it records 3D datacubes (x, y, λ) of line profiles in Hα (6562.8 Å), Ca II K (3933.7 Å), Ca II H (3968.5 Å), and Hε (3970.1 Å). Key parameters stated are optical spectral resolutions of 0.15 Å for the calcium lines and Hε (0.093 Å/pixel) and 0.25 Å for Hα (0.155 Å/pixel), with ~1 arcsec spatial sampling under typical 2-arcsec seeing. Data are released publicly in raw TIF (level 0) and processed FITS (level 1) formats, with examples of typical profiles for solar features also presented.
Significance. If the stated instrumental performance and data fidelity are verified, the dataset constitutes a valuable, regularly sampled, multi-year record of full-disk chromospheric spectroscopy in four diagnostically important lines. Public release in standard FITS format lowers the barrier for community studies of solar activity cycles, flare statistics, and atmospheric dynamics. The long temporal baseline since 2017 is a particular asset for time-domain solar physics.
major comments (2)
- [Observations and instrument description] The manuscript states the spectral resolutions (0.15 Å for Ca lines/Hε and 0.25 Å for Hα) and spatial sampling (~1 arcsec) but provides no dedicated section or appendix describing how these values were measured or verified on-sky (e.g., via line-width measurements on quiet-Sun or calibration-lamp spectra, or comparison with independent instruments). This information is load-bearing for the central claim that the datacubes are scientifically usable at the quoted performance levels under routine 2-arcsec seeing conditions.
- [Data processing and formats] No quantitative information is supplied on data quality, calibration steps, or error characterization for the transition from raw TIF (level 0) to processed FITS (level 1). Users cannot assess flat-fielding, wavelength calibration accuracy, stray-light correction, or the presence of artifacts without these details, which directly affects the reliability of the released level-1 products.
minor comments (2)
- [Abstract and throughout] The abstract and main text use slightly inconsistent wavelength notations (e.g., “A” versus “Å”); standardize to Å throughout.
- [Figures showing typical profiles] Figure captions for the example line profiles should explicitly state the solar feature, date, and exact pixel location to allow direct comparison with the datacubes.
Simulated Author's Rebuttal
We thank the referee for their constructive review and for recognizing the potential value of this long-term spectroscopic dataset. We address the two major comments point by point below, providing additional technical detail where it exists in our records and revising the manuscript to improve clarity and usability for the community.
read point-by-point responses
-
Referee: [Observations and instrument description] The manuscript states the spectral resolutions (0.15 Å for Ca lines/Hε and 0.25 Å for Hα) and spatial sampling (~1 arcsec) but provides no dedicated section or appendix describing how these values were measured or verified on-sky (e.g., via line-width measurements on quiet-Sun or calibration-lamp spectra, or comparison with independent instruments). This information is load-bearing for the central claim that the datacubes are scientifically usable at the quoted performance levels under routine 2-arcsec seeing conditions.
Authors: We agree that the original manuscript would benefit from an explicit description of how the quoted performance figures were obtained. The spectral resolutions are the nominal values set by the spectroheliograph slit width and grating dispersion (0.093 Å/pixel for the Ca/Hε channel and 0.155 Å/pixel for Hα). On-sky verification was performed by measuring the FWHM of narrow absorption lines in quiet-Sun regions and by comparison with contemporaneous spectra from the Meudon solar tower. Spatial sampling is fixed by the known focal length and CCD pixel size, yielding ~1 arcsec per pixel. We have added a new subsection (2.2) and Appendix A that document these measurements, including example line profiles and the effect of 2-arcsec seeing on the delivered resolution. revision: yes
-
Referee: [Data processing and formats] No quantitative information is supplied on data quality, calibration steps, or error characterization for the transition from raw TIF (level 0) to processed FITS (level 1). Users cannot assess flat-fielding, wavelength calibration accuracy, stray-light correction, or the presence of artifacts without these details, which directly affects the reliability of the released level-1 products.
Authors: We acknowledge that the original text lacked quantitative detail on the level-0 to level-1 pipeline. The current processing applies dark subtraction, flat-fielding constructed from daily disk-averaged spectra, and wavelength calibration referenced to standard solar line centers. We have expanded Section 3 with a step-by-step description of these operations and added estimates of wavelength calibration repeatability (~0.01 Å rms from repeated quiet-Sun measurements). However, a complete stray-light model and full error budget are not yet available for the present data release; we have therefore noted this limitation explicitly and indicated that more advanced corrections will be implemented in future versions of the archive. revision: partial
Circularity Check
No significant circularity: purely descriptive data-release note
full rationale
The manuscript contains no derivations, equations, predictions, or model fits. It is a factual description of routine solar observations, instrumental parameters, data formats, and public availability since 2017. No load-bearing claims reduce to self-citations, fitted inputs, or self-definitions. All statements are externally verifiable against the observatory's operations and public data archive.
Axiom & Free-Parameter Ledger
Reference graph
Works this paper leans on
-
[1]
Datacubes of Hα, CaII K, CaII H and Hε line profiles of the full solar disk recorded daily at Meudon observatory since 2017 and some typical profiles of solar features Jean-Marie Malherbe Emeritus astronomer, Observatoire de Paris, PSL Research University, LIRA, France Email: Jean-Marie.Malherbe@obspm.fr; ORCID: https://orcid.org/0000-0002-4180-3729 12 Ma...
work page 2017
-
[2]
Access to observations and typical line profiles associated to solar features are presented
format . Access to observations and typical line profiles associated to solar features are presented. KEYWORDS Sun, photosphere, chromosphere, line profiles, Calcium, Hydrogen, datacubes, systematic observations I – INTRODUCTION Systematic observations of the Sun started at Meudon in 1908 with Deslandres’s spectroheliograph (Malherbe, 2024a). D’Azambuja w...
work page 1908
-
[3]
We finally chose a compromise between the spectral FOV, the throughput of the camera and the volume of the data. CaII K, CaII H and Hε (in the red wing of CaII H) are observed simultaneously and we keep 100 spectral points in the line profiles (2048 x 2048 x 100 datacubes); 40 points are available for Hα (2048 x 2048 x 40 datacubes). Exposure times vary f...
work page 2048
-
[4]
The spatial sampling is 1 arcsec/pixel, this is well adapted to the usual Meudon seeing of 2 arcsec
Hence, this is a low spectral resolution system (in comparison to large solar spectrographs and telescopes providing 10 times better spectral sampling), but as a counterpart, the spectroheliograph sees the full sol ar disk and prominences around. The spatial sampling is 1 arcsec/pixel, this is well adapted to the usual Meudon seeing of 2 arcsec. Long expo...
work page 1908
-
[5]
II - DESCRIPTION OF THE DATACUBES (RAW/TIF AND PROCESSED/FITS DATA) Raw/TIF (level
are systematically produced daily since July 2017 (of course weather permitted) and available on line. II - DESCRIPTION OF THE DATACUBES (RAW/TIF AND PROCESSED/FITS DATA) Raw/TIF (level
work page 2017
-
[6]
For that reason, the precision of the line profiles is the best as there is no interpolation
data (λ, y, x) are not corrected from anything, such as dark current, line curvature and inclination, or solar P and coelostat angles to have the north up . For that reason, the precision of the line profiles is the best as there is no interpolation. They are available in yearly/monthly catalogues, in 3D 16 bit unsigned integer TIF format, here: https://b...
work page 2048
-
[7]
are provided some examples of spectral images that are derived from the corrected FITS and inserted daily in the bass2000 database ( https://bass2000.obspm.fr/home.php). Spectral images are slices of the 3D datacubes at constant wavelength that correspond to a specific altitude in the photosphere or in the chromosphere. In particular, line wings form deep...
work page 2021
-
[8]
on 10 May 2024 prior to a series of major flares in AR 3664 (X1 on 9 May at 17:30 UT, X4 on 10 May at 06:30 UT, X9 on 14 May at 16:45 UT). The 10 May flare is at the origin of the large solar disturbances and aurorae visible in many places and at low latitudes on 11 May. Figure 3 shows monoc hromatic images of AR 3664 which produced the flares, revealing ...
work page 2024
-
[9]
Hε is in emission in the facula, and in absorption in the filament
with the spectroheliograph, with small facular emission in CaII H3 and K3. Hε is in emission in the facula, and in absorption in the filament. K2 and H2 peaks appear in the facula. Figure 6 : line profiles of 10 May 2024, 06 :25 UT, CaII H (top) and K (middle) profiles of points 3 (left) & 5 (right). Black line: profiles at disk centre. Blue line: facula ...
work page 2024
-
[10]
with the spectroheliograph, again in emission in CaII H3 and in Hε. Figure 7 : line profiles of 3 October 2024, 13:49 UT, CaII H line profiles of points 1 (top) & 2 (bottom). Black line: profiles at disk centre. Blue line: bright point profiles. CaII H Hε CaII H Hε Figure 8 displays other line profiles observed in filaments on 3 October 2024 (points 3 and...
work page 2024
-
[11]
It is visible in absorption both in CaII H3 and in Hε
and the northern filament of 10 October 202 4 with the spectroheliograph . It is visible in absorption both in CaII H3 and in Hε. However, only densest parts appear in Hε. Figure 8 : filament of 3 October 2024, 13:49 UT, CaII H profiles (top) and images (CaII H3 and Hε, middle). Black line: profiles at disk centre. Blue line: filament. Bottom: images only...
work page 2024
-
[12]
We also looked at data of 6 November 2017, prior to a large solar flare (X17) and focused on bright points in the active region of Figure 9, and this corroborates what we saw with other events. There is a strong emission in CaII H3 together with emission of H ε which appear both in monochromatic images and spectra. For comparison, the Hα line is not so re...
work page 2017
-
[13]
CaII H3 and Hε images (top). Typical line profile showing emission of CaII H and Hε (right) in a dense prominence. There was also a huge prominence south west of the Sun in CaII H, but it has no signature in Hε. Hα CaII H3 Hε V – CONCLUSION Hα (6562.8 A), CaII K (3933.7 A), CaII H (3968.5 A) and Hε (3970.1 A in the wing of CaII H) line profiles over the f...
discussion (0)
Sign in with ORCID, Apple, or X to comment. Anyone can read and Pith papers without signing in.