REVIEW 2 major objections 8 minor 56 references
Unveiling the Local Environment of FRB 20220912A: Sub-arcsecond $4-26$ GHz Radio Continuum Mapping
T0 review · 2 major / 8 minor · reviewed 2026-07-08 · glm-5.2
Pith's one-line read FRB 20220912A sits inside a 75–190 pc star-forming knot, not a compact engine
desk verdict New VLA detection of extended radio source coincident with FRB 20220912A — characterized as a 75–190 pc star-forming region, not a compact PRS read the letter →
The pith
A machine-rendered reading of the paper's core claim, the machinery that carries it, and where it could break.
The reading
What carries the argument
The argument hinges on a cross-resolution comparison: the VLA A-configuration detects the source at sub-arcsecond scales (0.13–1.2 arcsec beams across C through K bands), while VLBI at 50 mas resolution recovers nothing. The flux predicted by extrapolating the VLA spectral fit to 1.4 GHz exceeds the VLBI 5σ upper limit, which means the emission must be distributed over scales larger than VLBI can recover. The spectral energy distribution is modeled as a power law (S_ν ∝ ν^α), and the steep index is verified to be intrinsic by showing that Galactic refractive interstellar scintillation would produce negligible modulation for a source of this angular size. The star-formation rate surface密度 is
What would settle it
Detection of a compact component at the FRB position in higher-sensitivity VLBI imaging at L-band or higher frequencies would directly contradict the claim that the source is extended star formation rather than a compact PRS.
Extended reading notes
Core claim
The radio continuum source coincident with FRB 20220912A is an extended (75–190 pc) star-forming region with a steep non-thermal spectrum and high star-formation rate surface density, not a compact central-engine-powered persistent radio source. The key diagnostic is the combination of three independent observations: the source is detected by the VLA at sub-arcsecond resolution, it is completely resolved out (non-detected) in archival VLBI data even when tapered to 50 mas, and its spectral index (α ≈ −0.73) matches the canonical value for non-thermal star-forming emission rather than the flat or inverted spectra of known PRSs. The VLBI non-detection sets a lower size limit of 75 pc; the VLAK
Load-bearing premise
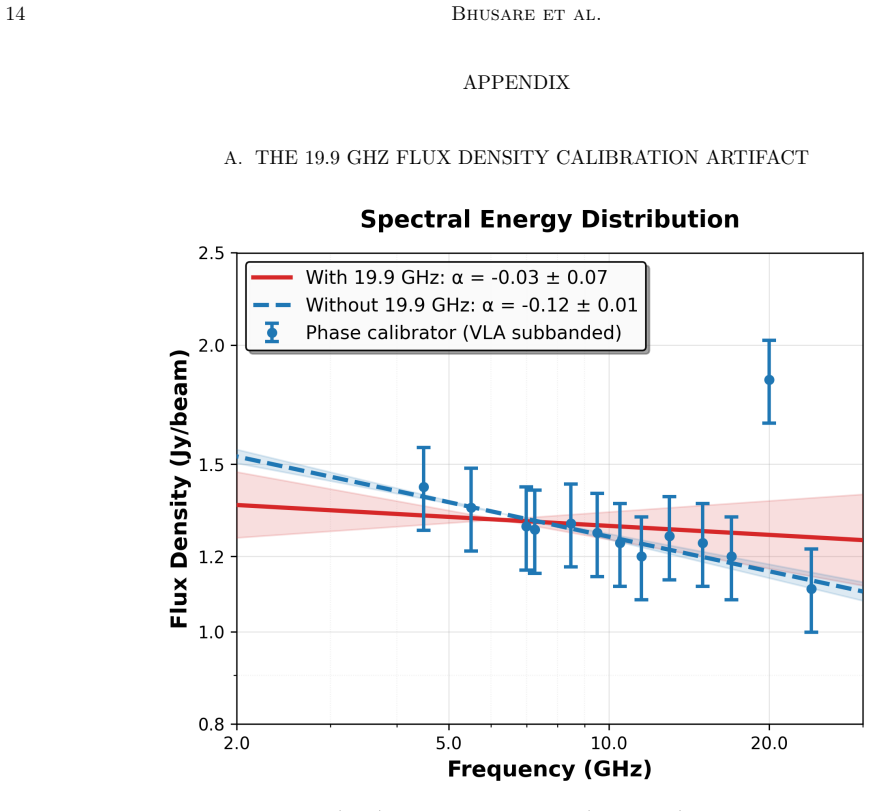
The steep spectral index (α ≈ −0.73) is intrinsic to the source rather than an artifact of flux-scale systematics or multi-component emission blended within the VLA beam. The spectral fit rests on nine data points across C, X, and Ku bands, with two non-detections at higher frequencies and one anomalous point at 19.9 GHz attributed to a calibration artifact near the 22.2 GHz water vapor line.
Editorial analysis
A structured set of objections, weighed in public.
Referee Report
Summary. This paper presents VLA A-configuration 4–26 GHz radio continuum observations of the field of the hyperactive repeater FRB 20220912A. The authors detect a previously unreported radio source spatially coincident with the FRB position (offset ~300 mas from the host nucleus), measure a steep spectral index (α ≈ −0.73 excluding a calibration artifact at 19.9 GHz), and use the absence of a VLBI detection at 1.4 GHz to argue that the source is resolved out on >50 mas scales, implying a physical size of 75–190 pc. Combining the steep spectrum, low brightness temperature (Tb < 100 K), and high star-formation rate surface density (Σ_SFR ≳ 13 M☉ yr⁻¹ kpc⁻²), the authors conclude the emission is a compact star-forming region rather than a compact PRS, supporting a young magnetar progenitor scenario. The astrometric analysis is careful, the chance-coincidence probability is convincingly low, and the RISS analysis correctly demonstrates scintillation is negligible for a 75+ pc source.
Significance. The paper addresses a timely question: whether the radio environments of repeating FRBs are compact central-engine-powered PRSs or extended star-forming regions. The result that FRB 20220912A resides in an extended star-forming knot rather than a compact PRS is a useful contribution to the growing diversity of FRB local environments. The multi-frequency VLA dataset is well-suited to the problem, and the authors provide a falsifiable prediction: future sub-arcsecond IFU observations should reveal Hα/[OIII] emission at the FRB position. The comparison table (Table 3) contextualizing FRB 20220912A against known PRS-associated FRBs is a helpful synthesis. The careful astrometric verification without self-calibration and the explicit treatment of the 19.9 GHz calibration artifact (Appendix A) are commendable methodological choices.
major comments (2)
- §6.1: The VLBI resolved-out argument—the basis for the 75 pc lower limit on the source size—depends on extrapolating the 4–15 GHz power-law spectrum to 1.4 GHz. The paper does not discuss the possibility of spectral curvature from free-free absorption, which is common in star-forming regions at GHz frequencies and below. If free-free optical depth at 1.4 GHz is significant, the true 1.4 GHz flux of the compact component could fall below the 30 µJy VLBI limit, making the VLBI non-detection consistent with a compact source and dissolving the 75 pc lower limit. The authors should discuss this possibility explicitly, estimate the emission measure that would be required to suppress the 1.4 GHz flux below the VLBI threshold, and assess whether such conditions are plausible for a 75–190 pc scale region. At minimum, the 75 pc lower limit should be presented with this caveat.
- §5.2 and §6.1: The spectral index fit uses 9 detected sub-bands but excludes two non-detections (16.9 and 23.9 GHz) and the 19.9 GHz artifact. The paper states the 23.9 GHz upper limit is 'significantly displaced above the extrapolated curve' but does not quantitatively demonstrate consistency of the non-detections with the best-fit model. A survival analysis or at least an explicit check that the upper limits are consistent with the α ≈ −0.73 model would strengthen the spectral characterization. Additionally, the C-band sub-bands (4 of the 9 data points) are obtained with an elongated beam (0.65″ × 0.26″) and the C-band astrometric offset is large (∆RA = −164 mas; Table 1), raising a contamination concern. The authors note that excluding C-band still yields α ≈ −0.7, but this check is described only qualitatively in §6.1; the corresponding fit parameters and uncertainty should be tablu.
minor comments (8)
- §5.1: The chance coincidence probability calculation uses a 340 mas radius and a source count from a 10 GHz survey. Since the source is detected across multiple bands, the effective search trials are larger than one; a brief note on this would be appropriate.
- Table 1 caption: the footnote on C-band notes that 'extended emission may contribute to the flux density,' but the table reports ∆RA/∆Dec values that appear to use the C-band position. Clarify whether the C-band astrometric offset affects the spatial coincidence claim or only the flux density.
- §5.4, Eq. (2): The Garn et al. (2009) relation is used without discussion of its applicable frequency range or systematic uncertainty. A brief note on the scatter in this relation would help contextualize the SFR uncertainty.
- Figure 3: The archival low-frequency points (orange squares) are plotted but their role in the spectral fit is unclear. The text states they are from large-beam observations that could not separate the compact source from host galaxy emission. If they are not used in the fit, this should be stated explicitly on the figure or in the caption.
- §6.2: The brightness temperature calculation uses the synthesized beam dimensions as an upper limit on the source size. For the 1.4 GHz Tb estimate assuming a 75 pc source, clarify which flux density and beam parameters are used.
- Table 3: The 'Size (Extended)' entry for FRB 20220912A lists '75–190 pc' while the 'Size (Compact)' column shows '[–]'. For consistency with other rows, consider noting that the compact component upper limit is <190 pc.
- §2: The sentence beginning 'While the net RM is low, the local environment could still be complex' is somewhat convoluted; consider revising for clarity.
- References: Several arXiv preprints are cited without journal references where published versions may exist (e.g., Bruni et al. 2024a). Please update where possible.
Simulated Author's Rebuttal
We thank the referee for a careful and constructive report. Both major comments identify legitimate gaps in our analysis that we will address in the revised manuscript. We summarize our planned revisions below.
read point-by-point responses
-
Referee: §6.1: The VLBI resolved-out argument depends on extrapolating the 4–15 GHz power-law spectrum to 1.4 GHz. The paper does not discuss the possibility of spectral curvature from free-free absorption, which is common in star-forming regions at GHz frequencies and below. If free-free optical depth at 1.4 GHz is significant, the true 1.4 GHz flux of the compact component could fall below the 30 µJy VLBI limit, making the VLBI non-detection consistent with a compact source and dissolving the 75 pc lower limit. The authors should discuss this possibility explicitly, estimate the emission measure that would be required to suppress the 1.4 GHz flux below the VLBI threshold, and assess whether such conditions are plausible for a 75–190 pc scale region. At minimum, the 75 pc lower limit should be presented with this caveat.
Authors: We agree that this is an important caveat that we should have addressed explicitly. Free-free absorption is indeed common in star-forming regions and could in principle suppress the 1.4 GHz flux below the VLBI 5σ limit of 30 µJy, weakening the resolved-out argument and the 75 pc lower limit. We will add a dedicated discussion in §6.1 of the revised manuscript. Our quantitative assessment will proceed as follows. The free-free optical depth is τ_ff ≈ 3.28 × 10⁻⁷ × (T_e / 10⁴ K)^{-1.35} × (ν / 1 GHz)^{-2.1} × EM, where EM is the emission measure in pc cm⁻⁶. To suppress the extrapolated 1.4 GHz flux density of ~111 µJy (using α = -0.50) below 30 µJy requires a suppression factor of ~2.7, corresponding to τ_ff ≳ 1.0 at 1.4 GHz. For T_e = 10⁴ K, this implies EM ≳ 3 × 10⁶ pc cm⁻⁶. For a 75–190 pc path length, this corresponds to an rms electron density of n_e ≳ 130–200 cm⁻³. While such densities are not unprecedented in compact HII regions, they are characteristic of ultra-compact or hyper-compact HII regions (scales ≲ 0.1 pc) rather than 75–190 pc scale structures. For a region of this size, the required EM would imply an ionizing photon rate of ~10⁵²–10⁵³ s⁻¹, which would require an exceptionally massive stellar cluster. Moreover, if free-free absorption were significant at 1.4 GHz, we would also expect curvature in our 4–15 GHz spectrum, which we do not observe. Nevertheless, we acknowledge that we cannot fully rule out this scenario, and we will present the 75 pc lower limit with this explicit caveat in the revised text. We will also note that the upper limit of 190 pc (from the VLA beam size at 19.9 GHz) is independent of the VLBI argument and remains robust. revision: yes
-
Referee: §5.2 and §6.1: The spectral index fit uses 9 detected sub-bands but excludes two non-detections (16.9 and 23.9 GHz) and the 19.9 GHz artifact. The paper states the 23.9 GHz upper limit is 'significantly displaced above the extrapolated curve' but does not quantitatively demonstrate consistency of the non-detections with the best-fit model. A survival analysis or at least an explicit check that the upper limits are consistent with the α ≈ −0.73 model would strengthen the spectral characterization. Additionally, the C-band sub-bands (4 of the 9 data points) are obtained with an elongated beam (0.65″ × 0.26″) and the C-band astrometric offset is large (∆RA = −164 mas; Table 1), raising a contamination concern. The authors note that excluding C-band still yields α ≈ −0.7, but this check is described only qualitatively in §6.1; the corresponding fit parameters and uncertainty should be tablu.
Authors: We agree on both points. (1) We will add an explicit quantitative consistency check for the two non-detections. For the 16.9 GHz upper limit of 34.25 µJy: the α = -0.73 model predicts ~28 µJy at 16.9 GHz, which is below the 5σ upper limit, so this non-detection is consistent. For the 23.9 GHz upper limit of 47.5 µJy: the model predicts ~22 µJy, again well below the upper limit. We will state these values explicitly in §5.2 and note that both upper limits are consistent with the best-fit power law. We will also perform a simple survival analysis (e.g., using the Kaplan-Meier estimator or a maximum-likelihood fit incorporating censored data points via the Astronomy SURVival analysis package or an equivalent method) to verify that including the upper limits does not significantly change the inferred spectral index. (2) We will tabulate the spectral index fit excluding C-band data points alongside the full fit in a revised table, including the best-fit α, its uncertainty, and the reduced χ². As the referee notes, we already state qualitatively that the result is α ≈ -0.7; we will now provide the quantitative parameters. This will also address the contamination concern by demonstrating that the steep spectrum is not driven by the C-band measurements with their elongated beam and larger astrometric offset. revision: yes
Circularity Check
No significant circularity; derivation is self-contained with one minor self-citation for archival context
full rationale
The paper's central claims are derived from independent data and external relations, not from circular definitions or self-citation chains. (1) The spectral index α ≈ −0.73 is fitted from the paper's own new VLA flux density measurements (Table 2, 9 data points), a standard data-to-parameter step. (2) The VLBI resolved-out argument uses an independent dataset (D. M. Hewitt et al. 2023) — the VLBI non-detection is an observational fact, not a derived result, and Hewitt is a co-author but the VLBI data was independently published. (3) The SFR calculation uses an externally published relation (Garn et al. 2009, different authors) with measured flux densities and the fitted spectral index. (4) The Σ_SFR uses the SFR divided by the synthesized beam area, an observational constraint. The paper transparently acknowledges in Appendix B that 'the SFR remains flat by construction' because S_ν × ν^(−α) is constant when α is fitted from S_ν ∝ ν^α — but this flatness is not presented as a prediction; it is explicitly flagged as by-construction, and the meaningful output is the weighted mean SFR value. The one self-citation (Y. Bhusare et al. 2025, first author = present first author) provides archival low-frequency flux measurements shown for comparison in Figure 3, but the paper's main spectral index is independently derived from its own new VLA data, and the archival points are explicitly noted as potentially contaminated by host-galaxy emission (§2). This self-citation is not load-bearing for the central conclusions. No step in the derivation chain reduces to its own inputs by construction.
Assumptions & free parameters
free parameters (1)
- Spectral index α =
-0.73 ± 0.17 (preferred, excluding 19.9 GHz); -0.50 ± 0.19 (including 19.9 GHz)
assumptions (4)
- domain assumption Radio-luminosity-to-SFR relation (Garn et al. 2009, Eq. 2)
- domain assumption NE2001 Galactic electron density model (Cordes & Lazio 2002)
- domain assumption The VLBI non-detection implies the source is resolved out on scales >50 mas
- domain assumption The 19.9 GHz flux excess is a calibration artifact, not intrinsic
Cite this review
Pith. "Pith review of Unveiling the Local Environment of FRB 20220912A: Sub-arcsecond $4-26$ GHz Radio Continuum Mapping." pith.science (2026). https://pith.science/paper/VKB7ZBCQ
@misc{pith2026260705950,
  author       = {Pith},
  title        = {Pith review of: Unveiling the Local Environment of FRB 20220912A: Sub-arcsecond $4-26$ GHz Radio Continuum Mapping},
  year         = {2026},
  howpublished = {\url{https://pith.science/paper/VKB7ZBCQ}},
  note         = {Machine review of arXiv:2607.05950}
}
abstract
The local environments of repeating fast radio bursts (FRBs) provide critical clues to their progenitors. While some active repeaters (e.g., FRB~20121102A, FRB~20190520B) are embedded in compact persistent radio sources (PRS), others appear to reside in cleaner environments. We present a high-resolution, multi-frequency (4$-$26 GHz) continuum study of the hyperactive repeater FRB 20220912A using the Karl G. Jansky Very Large Array (VLA). We report the discovery of a previously unknown radio source distinct from the compact PRSs seen in other FRBs, spatially coincident with the FRB position and offset by $\approx 300$~mas ($\approx 450$~pc) from the host galaxy's center. The absence of continuum emission in archival milliarcsecond-resolution VLBI observations indicates that the source is resolved out, ruling out a hyper-compact ($< 1$~pc) central-engine-powered origin. We constrain the physical diameter of the emitting region between 75~pc and 190~pc. We further demonstrate that the source is characterized by a steep non-thermal spectral index ($\alpha \approx -0.73$) and a remarkably high star-formation rate surface density $\Sigma_{\text{SFR}} \gtrsim 13~M_{\odot}~\text{yr}^{-1}~\text{kpc}^{-2}$. We argue that this emission is best explained as a compact star-forming region within the host galaxy. This association with a site of ongoing star formation provides strong observational support for the hypothesis that young magnetars, formed after the deaths of massive stars, are the progenitors of at least some repeating FRBs.
Figures


Figures from the paper (3 more)


Reference graph
Works this paper leans on
-
[1]
Radio Monitoring Campaign of Active Repeater FRB 20220912A with CHIME
Abbott, T. C., Pearlman, A. B., Kaspi, V. M., et al. 2026, arXiv e-prints, arXiv:2604.09098, doi: 10.48550/arXiv.2604.09098
work page Pith review arXiv doi:10.48550/arxiv.2604.09098 2026
-
[2]
Bannister, K. W., Deller, A. T., Phillips, C., et al. 2019, Science, 365, 565, doi: 10.1126/science.aaw5903
-
[3]
Bassa, C. G., Tendulkar, S. P., Adams, E. A. K., et al. 2017, ApJL, 843, L8, doi: 10.3847/2041-8213/aa7a0c
-
[4]
2023, ApJL, 958, L19, doi: 10.3847/2041-8213/ad083f
Bhandari, S., Marcote, B., Sridhar, N., et al. 2023, ApJL, 958, L19, doi: 10.3847/2041-8213/ad083f
-
[5]
Tendulkar, S. P. 2025a, PASP, 137, 084202, doi: 10.1088/1538-3873/adf7dc
-
[6]
Tendulkar, S. P. 2025b, arXiv e-prints, arXiv:2506.23861, doi: 10.48550/arXiv.2506.23861
-
[7]
Bhardwaj, M., Gaensler, B. M., Kaspi, V. M., et al. 2021, ApJL, 910, L18, doi: 10.3847/2041-8213/abeaa6
-
[8]
Bhardwaj, M., Michilli, D., Kirichenko, A. Y., et al. 2024, ApJL, 971, L51, doi: 10.3847/2041-8213/ad64d1
Show all 56 references
-
[9]
P., Hessels, J
Bhardwaj, M., Snelders, M. P., Hessels, J. W. T., et al. 2025c, ApJL, 992, L35, doi: 10.3847/2041-8213/ae0b68
-
[10]
2025, ApJ, 993, 234, doi: 10.3847/1538-4357/ae0451
Bhusare, Y., Maan, Y., & Kumar, A. 2025, ApJ, 993, 234, doi: 10.3847/1538-4357/ae0451
2025 doi
-
[11]
2022, The Astronomer’s Telegram, 15806, 1 12Bhusare et al
Bhusare, Y., Kumar, A., Maan, Y., et al. 2022, The Astronomer’s Telegram, 15806, 1 12Bhusare et al
2022
-
[12]
D., Ravi, V., Belov, K
Bochenek, C. D., Ravi, V., Belov, K. V., et al. 2020, Nature, 587, 59, doi: 10.1038/s41586-020-2872-x
2020 doi
-
[13]
2024a, A nebular origin for the persistent radio emission of fast radio bursts, https://arxiv.org/abs/2312.15296
Bruni, G., Piro, L., Yang, Y.-P., et al. 2024a, A nebular origin for the persistent radio emission of fast radio bursts, https://arxiv.org/abs/2312.15296
-
[14]
P., et al
Bruni, G., Piro, L., Yang, Y. P., et al. 2024b, Discovery of a PRS associated with FRB 20240114A, https://arxiv.org/abs/2412.01478
- [15]
-
[16]
J., Wharton, R
Chatterjee, S., Law, C. J., Wharton, R. S., et al. 2017, Nature, 541, 58–61, doi: 10.1038/nature20797 CHIME/FRB Collaboration, Andersen, B. C., Bandura, K. M., et al. 2020, Nature, 587, 54, doi: 10.1038/s41586-020-2863-y CHIME/FRB Collaboration, Amiri, M., Andersen, B. C., et ...
2017 doi
-
[17]
S., Simha, S., Mannings, A., et al
Chittidi, J. S., Simha, S., Mannings, A., et al. 2021, ApJ, 922, 173, doi: 10.3847/1538-4357/ac2818
2021 doi
-
[18]
Condon, J. J. 1992, ARA&A, 30, 575, doi: 10.1146/annurev.aa.30.090192.003043
1992 doi
-
[19]
M., Scholz, P., Pearlman, A
Cook, A. M., Scholz, P., Pearlman, A. B., et al. 2024, ApJ, 974, 170, doi: 10.3847/1538-4357/ad6a13
2024 doi
- [20]
-
[21]
2024, ApJ, 961, 44, doi: 10.3847/1538-4357/ad0cbd
Dong, Y., Eftekhari, T., Fong, W.-f., et al. 2024, ApJ, 961, 44, doi: 10.3847/1538-4357/ad0cbd
2024 doi
-
[22]
I., Crowther, P
Doran, E. I., Crowther, P. A., de Koter, A., et al. 2013, A&A, 558, A134, doi: 10.1051/0004-6361/201321824
2013 doi
-
[23]
2024, ApJ, 974, 296, doi: 10.3847/1538-4357/ad7a64
Feng, Y., Li, D., Zhang, Y.-K., et al. 2024, ApJ, 974, 296, doi: 10.3847/1538-4357/ad7a64
2024 doi
-
[24]
A., Riley, J
Garn, T., Green, D. A., Riley, J. M., & Alexander, P. 2009, Monthly Notices of the Royal Astronomical Society, 397, 1101, doi: 10.1111/j.1365-2966.2009.15073.x
2009 doi
-
[25]
C., Fong, W.-f., Deller, A
Gordon, A. C., Fong, W.-f., Deller, A. T., et al. 2025, ApJ, 993, 119, doi: 10.3847/1538-4357/ae0298
2025 doi
-
[26]
2010, ApJ, 723, 1019, doi: 10.1088/0004-637X/723/2/1019
Heyer, M. 2010, ApJ, 723, 1019, doi: 10.1088/0004-637X/723/2/1019
2010 doi
-
[27]
E., Prochaska, J
Heintz, K. E., Prochaska, J. X., Simha, S., et al. 2020, ApJ, 903, 152, doi: 10.3847/1538-4357/abb6fb
2020 doi
-
[28]
M., Bhandari, S., Marcote, B., et al
Hewitt, D. M., Bhandari, S., Marcote, B., et al. 2023, Milliarcsecond Localisation of the Hyperactive Repeating FRB 20220912A, https://arxiv.org/abs/2312.14490
2023 arXiv
-
[29]
L., Drout, M
Ibik, A. L., Drout, M. R., Gaensler, B. M., et al. 2024, ApJ, 976, 199, doi: 10.3847/1538-4357/ad808e Jim´ enez-Andrade, E. F., Murphy, E. J., Momjian, E., et al. 2024, ApJ, 972, 89, doi: 10.3847/1538-4357/ad5b5c
2024 doi
-
[30]
Kennicutt, Jr., R. C. 1998, ARA&A, 36, 189, doi: 10.1146/annurev.astro.36.1.189
1998 doi
-
[31]
2022, Nature, 602, 585, doi: 10.1038/s41586-021-04354-w
Kirsten, F., Marcote, B., Nimmo, K., et al. 2022, Nature, 602, 585, doi: 10.1038/s41586-021-04354-w
2022 doi
-
[32]
C., Hewitt, D
Konijn, D. C., Hewitt, D. M., Hessels, J. W. T., et al. 2024, MNRAS, 534, 3331, doi: 10.1093/mnras/stae2296
2024 doi
-
[33]
2025, arXiv e-prints, arXiv:2512.21889, doi: 10.48550/arXiv.2512.21889
Kumar, A., Maan, Y., Lal, B., et al. 2025, arXiv e-prints, arXiv:2512.21889, doi: 10.48550/arXiv.2512.21889
2025 doi
-
[34]
2025, ApJ, 992, 127, doi: 10.3847/1538-4357/adff5c
Liu, W., Bhardwaj, M., & Margalit, B. 2025, ApJ, 992, 127, doi: 10.3847/1538-4357/adff5c
2025 doi
-
[35]
R., Bailes, M., McLaughlin, M
Lorimer, D. R., Bailes, M., McLaughlin, M. A., Narkevic, D. J., & Crawford, F. 2007, Science, 318, 777, doi: 10.1126/science.1147532
2007 doi
-
[36]
G., Fong, W.-f., Simha, S., et al
Mannings, A. G., Fong, W.-f., Simha, S., et al. 2021, ApJ, 917, 75, doi: 10.3847/1538-4357/abff56
2021 doi
-
[37]
Marcote, B., Paragi, Z., Hessels, J. W. T., et al. 2017, ApJL, 834, L8, doi: 10.3847/2041-8213/834/2/L8
2017 doi
-
[38]
Margalit, B., & Metzger, B. D. 2018, ApJL, 868, L4, doi: 10.3847/2041-8213/aaedad
2018 doi
-
[39]
2022, The Astronomer’s Telegram, 15679, 1
McKinven, R., & CHIME/FRB Collaboration. 2022, The Astronomer’s Telegram, 15679, 1
2022
-
[40]
M., Bhandari, S., Drout, M
Moroianu, A. M., Bhandari, S., Drout, M. R., et al. 2026, ApJL, 996, L16, doi: 10.3847/2041-8213/ae28c7
2026 doi
-
[41]
2025, LMFIT: Non-Linear Least-Squares Minimization and Curve-Fitting for Python, 1.3.4 Zenodo, doi: 10.5281/zenodo.598352
Newville, M., Otten, R., Nelson, A., et al. 2025, LMFIT: Non-Linear Least-Squares Minimization and Curve-Fitting for Python, 1.3.4 Zenodo, doi: 10.5281/zenodo.598352
2025 doi
-
[42]
2022, Nature, 606, 873–877, doi: 10.1038/s41586-022-04755-5
Niu, C.-H., Aggarwal, K., Li, D., et al. 2022, Nature, 606, 873–877, doi: 10.1038/s41586-022-04755-5
2022 doi
-
[43]
2024, A&A, 690, A219, doi: 10.1051/0004-6361/202450271
Pelliciari, D., Bernardi, G., Pilia, M., et al. 2024, A&A, 690, A219, doi: 10.1051/0004-6361/202450271
2024 doi
-
[44]
2021, A&A, 656, L15, doi: 10.1051/0004-6361/202141903 Planck Collaboration, Aghanim, N., Akrami, Y., et al
Piro, L., Bruni, G., Troja, E., et al. 2021, A&A, 656, L15, doi: 10.1051/0004-6361/202141903 Planck Collaboration, Aghanim, N., Akrami, Y., et al. 2020, A&A, 641, A6, doi: 10.1051/0004-6361/201833910
2021 doi
-
[45]
M., Acharya, S
Rahaman, S. M., Acharya, S. K., Beniamini, P., & Granot, J. 2025, ApJ, 988, 276, doi: 10.3847/1538-4357/ade70c
2025 doi
-
[46]
2022, The Astronomer’s Telegram, 15791, 1
Rajwade, K., Wharton, R., Majid, W., et al. 2022, The Astronomer’s Telegram, 15791, 1
2022
-
[47]
2023, The Astrophysical Journal Letters, 949, L3, doi: 10.3847/2041-8213/acc4b6
Ravi, V., Catha, M., Chen, G., et al. 2023, The Astrophysical Journal Letters, 949, L3, doi: 10.3847/2041-8213/acc4b6
2023 doi
-
[48]
Rickett, B. J. 1990, ARA&A, 28, 561, doi: 10.1146/annurev.aa.28.090190.003021
1990 doi
-
[49]
2025, ApJL, 979, L21, doi: 10.3847/2041-8213/ad9ddc Local environment of FRB 20220912A13
Shah, V., Shin, K., Leung, C., et al. 2025, ApJL, 979, L21, doi: 10.3847/2041-8213/ad9ddc Local environment of FRB 20220912A13
2025 doi
-
[50]
Z., Farah, W., Pollak, A
Sheikh, S. Z., Farah, W., Pollak, A. W., et al. 2024, MNRAS, 527, 10425, doi: 10.1093/mnras/stad3630
2024 doi
-
[51]
R., Stil, J
Taylor, A. R., Stil, J. M., & Sunstrum, C. 2009, ApJ, 702, 1230, doi: 10.1088/0004-637X/702/2/1230
2009 doi
-
[52]
P., Gil de Paz, A., Kirichenko, A
Tendulkar, S. P., Gil de Paz, A., Kirichenko, A. Y., et al. 2021, ApJL, 908, L12, doi: 10.3847/2041-8213/abdb38
2021 doi
-
[53]
Walker, M. A. 1998, MNRAS, 294, 307, doi: 10.1046/j.1365- 8711.1998.01238.x10.1111/j.1365-8711.1998.01238.x
1998 doi
-
[54]
2022, ApJL, 928, L16, doi: 10.3847/2041-8213/ac5f46
Yang, Y.-P., Lu, W., Feng, Y., Zhang, B., & Li, D. 2022, ApJL, 928, L16, doi: 10.3847/2041-8213/ac5f46
2022 doi
-
[55]
2023, ApJ, 959, 89, doi: 10.3847/1538-4357/ad0545
Zhang, X., Yu, W., Law, C., et al. 2023, ApJ, 959, 89, doi: 10.3847/1538-4357/ad0545
2023 doi
-
[56]
2023, ApJ, 955, 142, doi: 10.3847/1538-4357/aced0b 14Bhusare et al
Zhang, Y.-K., Li, D., Zhang, B., et al. 2023, ApJ, 955, 142, doi: 10.3847/1538-4357/aced0b 14Bhusare et al. APPENDIX A.THE 19.9 GHZ FLUX DENSITY CALIBRATION ARTIFACT Figure 5.Spectral energy distribution (SED) of the phase calibrator (J2322+509). Blue points represent the meas...
2023 doi
Reviewed July 8, 2026 · model on record in the stance chip above.
Discussion (0). Sign in to comment.