REVIEW 2 major objections 4 minor 48 references
NICER observes a secondary peak in the decay of a thermonuclear burst from 4U 1608-52
T0 review · 2 major / 4 minor · reviewed 2026-08-14 · deepseek-v4-flash
Pith's one-line read NICER's soft X-ray view of a thermonuclear burst from 4U 1608-52 shows a secondary peak and a dip in bolometric flux, ruling out photospheric expansion, absorption, and scattering as causes, implying the double-peaked structure is…
desk verdict A robust first detection of a soft-X-ray secondary peak in a 4U 1608-52 burst, with an absorption exclusion that needs a quantified upper limit before the intrinsic interpretation is fully persuasive. read the letter →
The pith
A machine-rendered reading of the paper's core claim, the machinery that carries it, and where it could break.
The reading
What carries the argument
The load-bearing tool is the variable persistent flux spectral model, TBabs x (bbodyrad + fa x persistent), applied to 63 time-resolved spectra of the burst. It separates the burst's own blackbody emission from a scalar multiple of the pre-burst persistent accretion spectrum, allowing the blackbody temperature, radius, and bolometric flux to be tracked independently of changes in the persistent level. The key comparison is the bolometric light curve, which keeps the dip even after the persistent component is removed, together with the 0.75 s time offset between the temperature maximum and the flux minimum. That offset, plus the absence of any absorption improvement in a 0.7 s dip spectrum, is what rules out photospheric expansion and obscuration and points to the burning itself.
What would settle it
If a future observation of a similar burst with higher count rate at the dip shows an absorption feature or a variable column density, or if allowing the persistent spectral shape to evolve removes the bolometric dip, then the intrinsic-burning claim would be overturned.
Extended reading notes
Core claim
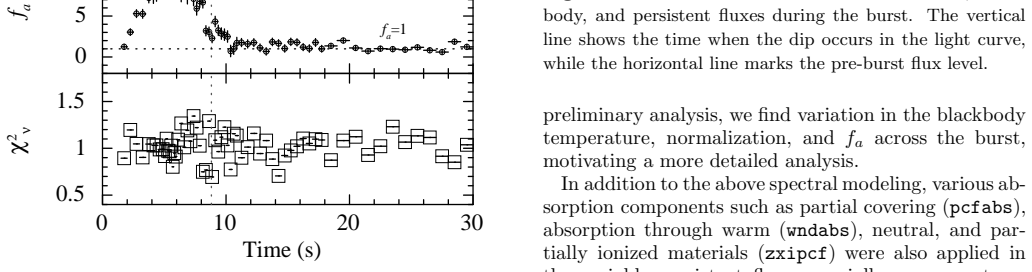
The paper reports the first detection below 1.5 keV of a secondary peak in an Eddington-limited thermonuclear burst from 4U 1608-52. Time-resolved spectroscopy with a variable persistent flux model, TBabs x (bbodyrad + fa x persistent), describes the burst as a cooling blackbody plus a scaled version of the pre-burst accretion spectrum; the scale factor fa rises to about 13 at the first peak and returns to unity within about nine seconds. The bolometric flux shows the same dip as the count-rate light curve, at about 3.5 sigma significance, and the dip trails the maximum blackbody temperature (about 3.2 keV) by roughly 0.75 seconds. Because the dip appears in bolometric flux and is offset from the temperature peak, and because absorption models do not improve the fit, the authors argue that the feature is astrophysical and intrinsic, not an artifact of the passband, photospheric expansion, or obscuration. They interpret the second peak as enhanced emission in the cooling tail, possibly from stalled thermonuclear flame spreading or re-burning of fresh or leftover fuel.
Load-bearing premise
The analysis assumes that the persistent emission from the accretion flow keeps the same spectral shape during the burst and only changes in brightness, so any change in its shape would be misattributed to the burst itself.
Editorial extensions
If this is right
- Double-peaked structure in a non-PRE burst can reflect the nuclear burning process itself, so future bursts with dips should not be assumed to be PRE or absorption events.
- The variable persistent flux method is required for NICER burst spectroscopy: a fixed persistent spectrum fails to fit the peak, and fa traces the burst's effect on the accretion flow, returning to unity within about nine seconds.
- The 0.75 s lag between the temperature maximum and the bolometric dip provides a timing signature that can be searched for in other bursts.
- Models of thermonuclear flame spreading and re-burning now have a concrete event with measured temperature and flux evolution to reproduce.
Reading between the lines
- If similar intrinsic double peaks show up in other NICER bursts, the fraction of such events could be measured and compared with accretion state; the burst here occurred in the lower banana branch, suggesting a state dependence worth testing.
- The simultaneous drop of fa and bolometric flux at the dip hints that disk reprocessing responds to the burst intensity; reflection and irradiation modeling of the dip could separate this response from photospheric changes, a test the paper does not perform.
- The observed 0.75 s lag may carry information about the speed of a stalled burning front across the neutron star surface; combining future burst oscillation searches with the lag could yield a propagation speed estimate.
Signed reviews
Editorial analysis
A structured set of objections, weighed in public.
Referee Report
Summary. This paper reports a NICER observation of a double-peaked type-I X-ray burst from 4U 1608-52 on 2017 September 28, claimed to be the first detection of such a secondary peak below 1.5 keV. The 0.3-12 keV light curve shows a primary peak, a dip, and a secondary peak about 5 s later, and the re-brightening appears in soft and hard bands. Time-resolved spectroscopy is performed with an absorbed blackbody plus a variable persistent component, TBabs × (bbodyrad + fa × persistent), with fa a free scaling factor. The authors report that the blackbody temperature reaches a maximum of about 3 keV before the dip, that the bolometric 0.1-100 keV flux shows a dip at (8.8±0.3)×10^-8 erg s^-1 cm^-2 with 3.5σ significance, and that the dip is offset from the temperature maximum by about 0.75 s. On this basis they argue that the dip is not due to photospheric radius expansion and that fits with partial-covering or ionized absorption models give no evidence for absorption; they conclude that the double-peaked structure is intrinsic to the thermonuclear burning and discuss flame spreading, re-burning, and rp-process waiting-point scenarios.
Significance. If the intrinsic interpretation is correct, this is a rare low-energy observation of a double-peaked, non-PRE burst whose bolometric flux genuinely dips, making it a useful test for flame-spreading and re-burning models. The paper's strengths are the NICER soft-energy coverage, the time-resolved spectral decomposition with a variable persistent component, the explicit time-offset argument against PRE, and the comparison with earlier EXOSAT and RXTE events. The analysis uses standard public data and widely used spectral fitting tools, and the presentation of the light curve and spectral evolution is clear. The main weakness is that the paper's central exclusion of absorption/scattering and its claim that the dip is intrinsic rest on a null spectral test without reported upper limits and on a scalar fa model of the persistent emission, so the conclusions are currently stronger than the evidence supports.
major comments (2)
- [Section 3.3 and Section 4] The claim that the dip is not caused by absorption or scattering rests on a null result: fitting pcfabs, wndabs, and zxipcf to a single 0.7 s dip spectrum is described only as "not significantly better" and "no evidence for increased absorption," with no upper limit reported on the additional column density or on the partial-covering fraction. The bolometric dip is a roughly 37% drop in flux (from 1.4×10^-7 to 8.8×10^-8 erg s^-1 cm^-2), so an absorbing/scattering medium capable of producing it would be optically thick at the relevant energies; the absence of a statistically significant Δχ² improvement from one short spectrum is not a quantitative exclusion. Please report 90% or 95% confidence upper limits on the added NH (and on the covering fraction where applicable) for each absorption model, and adjust the Section 4 statement that "absorption/scattering of X-ray photons is not a satisfying solution" to match the actual constraint.
- [Section 3.3, Figures 5-6] The central interpretation assumes that the persistent emission during the burst is exactly the pre-burst spectrum multiplied by a single scalar factor fa. If the persistent component changes spectral shape during the burst, for example through disk irradiation or reflection, the inferred blackbody temperature, radius, and the decomposition of the bolometric flux shown in Figure 6 can all be biased. The manuscript acknowledges the degeneracy in theoretical modeling (Worpel et al. 2015; Degenaar et al. 2018) but then concludes in Section 4 that the dip is intrinsic to the nuclear burning. Please state explicitly whether the blackbody component alone shows a dip and a secondary peak; if it does not, the bolometric dip is not independent of the fa model, and the intrinsic-burning conclusion should be softened or supported with a test that allows the persistent component's spectral shape to vary. The sentence "Such a drop can also be seen in the evolving persistent level" makes this ambiguity concrete and should be clarified.
minor comments (4)
- [Figure 3 caption] The hard color (HC) and soft color (SC) are defined with the same band ratio "(1.1-2.0)/(0.5-1.1) keV" in the caption; the hard color should presumably be (3.8-6.8)/(2.0-3.8) keV as stated in the main text.
- [Acknowledgments] The acknowledgments contain a garbled phrase "Marie Sk/suppress lodowska-Curie"; this should read "Marie Skłodowska-Curie."
- [Figure 6 caption] The caption does not identify which line or symbol style corresponds to the blackbody, persistent, and bolometric fluxes; please add that information so the reader can follow the time evolution of each component.
- [Section 3.1] The paper quotes a 3.5σ significance for the bolometric dip but does not quantify the significance of the dip in the 0.3-12 keV count-rate light curve; reporting the significance relative to a smooth decay model would strengthen the detection claim.
Circularity Check
No significant circularity; this is an observational analysis whose conclusion is an interpretation of the data, not a quantity forced by the fitted inputs.
full rationale
The paper reports a NICER observation of a double-peaked thermonuclear burst and fits time-resolved spectra with a blackbody plus a scaled persistent-emission component. The central claim, that the dip and secondary peak are intrinsic to the thermonuclear burning rather than caused by photospheric expansion, absorption, or scattering, is not a fitted parameter renamed as a prediction. The dip is directly visible in the count-rate light curve, and the bolometric flux dip is a separately derived spectral quantity; neither is defined in terms of the conclusion. The variable persistent flux method is taken from Worpel et al. (2013, 2015), independent published work, and the scale factor fa is a freely fitted nuisance parameter, not the discovery claim. The exclusion of absorption and scattering rests on null detections in a single 0.7 s spectrum, and the skeptic correctly notes that no upper limit on the additional column density is reported; however, that is a limitation in statistical sensitivity and evidentiary strength, not a circularity. No load-bearing self-citation chain appears: citations to NICER team publications are for instrument response, calibration, and prior burst phenomenology, and they do not supply the interpretation by definition. Accordingly, the analysis is self-contained in the sense relevant to circularity, and the score is 0.
Assumptions & free parameters
free parameters (4)
- fa (persistent flux scaling factor) =
varies up to ~13; returns to ~1 in ~9 s
- Blackbody temperature kT_bb =
peaks at ~3.2 +/- 0.4 keV
- Blackbody normalization / radius R_bb =
max ~12 +/- 2 km at assumed distance 4 kpc
- Interstellar column density N_H =
(0.98 +/- 0.03) x 10^22 cm^-2
assumptions (4)
- domain assumption Burst emission can be modeled as a blackbody plus a scaled persistent spectrum
- domain assumption The persistent spectrum shape remains constant during the burst and only its normalization changes
- domain assumption The interstellar absorption column from the persistent phase applies to the burst emission
- domain assumption NICER count rates are not affected by pile-up or dead-time in a way that creates the dip
Cite this review
Pith. "Pith review of NICER observes a secondary peak in the decay of a thermonuclear burst from 4U 1608-52." pith.science (2026). https://pith.science/paper/VLP7Z2B6
@misc{pith2026190803373,
  author       = {Pith},
  title        = {Pith review of: NICER observes a secondary peak in the decay of a thermonuclear burst from 4U 1608-52},
  year         = {2026},
  howpublished = {\url{https://pith.science/paper/VLP7Z2B6}},
  note         = {Machine review of arXiv:1908.03373}
}
abstract
We report for the first time below 1.5 keV, the detection of a secondary peak in an Eddington-limited thermonuclear X-ray burst observed by the Neutron Star Interior Composition Explorer (NICER) from the low-mass X-ray binary 4U 1608-52. Our time-resolved spectroscopy of the burst is consistent with a model consisting of a varying-temperature blackbody, and an evolving persistent flux contribution, likely attributed to the accretion process. The dip in the burst intensity before the secondary peak is also visible in the bolometric flux. Prior to the dip, the blackbody temperature reached a maximum of $\approx3$ keV. Our analysis suggests that the dip and secondary peak are not related to photospheric expansion, varying circumstellar absorption, or scattering. Instead, we discuss the observation in the context of hydrodynamical instabilities, thermonuclear flame spreading models, and re-burning in the cooling tail of the burst.
Figures


Figures from the paper (3 more)


Reference graph
Works this paper leans on
-
[1]
Arnaud, K. A. 1996, in Astronomical Society of the Pacific Conference Series, Vol. 101, Astronomical Data Analysis Software and Systems V, ed. G. H. Jacoby & J. Barnes, 17
1996
- [2]
-
[3]
Bagnoli, T., in’t Zand, J. J. M., Patruno, A., & Watts, A. L. 2014, MNRAS, 437, 2790
work page 2014
-
[4]
Ballantyne, D. R. 2004, MNRAS, 351, 57
work page 2004
- [5]
-
[6]
Bhattacharyya, S., & Strohmayer, T. E. 2006, ApJL, 636, L121
work page 2006
-
[7]
Bult, P., Altamirano, D., Arzoumanian, Z., et al. 2018, ApJL, 860, L9
work page 2018
-
[8]
Cavecchi, Y., Patruno, A., Haskell, B., et al. 2011, ApJL, 740, L8
work page 2011
Show all 48 references
-
[9]
2012, ApJL, 752, L34
Chen, Y.-P., Zhang, S., Zhang, S.-N., Li, J., & Wang, J.-M. 2012, ApJL, 752, L34
2012
-
[10]
R., Belloni, T., et al
Degenaar, N., Ballantyne, D. R., Belloni, T., et al. 2018, SSRv, 214, 15
2018
-
[11]
2007, A&A Rv , 15, 1
Done, C., Gierli´ nski, M., & Kubota, A. 2007, A&A Rv , 15, 1
2007
-
[12]
1983, PASJ, 35, 17
Ebisuzaki, T., Hanawa, T., & Sugimoto, D. 1983, PASJ, 35, 17
1983
-
[13]
L., Thielemann, F.-K., & Wiescher, M
Fisker, J. L., Thielemann, F.-K., & Wiescher, M. 2004, ApJL, 608, L61
2004
-
[14]
Witry, J. W. L. 2018, ApJL, 867, L28
2018
-
[15]
Y., & Gottwald, M
Fujimoto, M. Y., & Gottwald, M. 1989, MNRAS, 236, 545
1989
-
[16]
1988, A&A, 199, L9
Paradijs, J. 1988, A&A, 199, L9
1988
-
[17]
K., & Keek, L
Galloway, D. K., & Keek, L. 2017, ArXiv e-prints , arXiv:1712.06227 [astro-ph.HE] , ads
2017 arXiv
-
[18]
K., Muno, M
Galloway, D. K., Muno, M. P., Hartman, J. M., Psaltis, D., & Chakrabarty, D. 2008, ApJS, 179, 360
2008
-
[19]
2017, Nature Astronomy , 1, 895
Gendreau, K., & Arzoumanian, Z. 2017, Nature Astronomy , 1, 895
2017
-
[20]
C., et al
Gendreau, K. C., et al. 2016, in Proc. SPIE, Vol. 9905, Space Telescopes and Instrumentation 2016: Ultraviolet to Gamma Ray, 99051H
2016
-
[21]
1976, ApJL, 209, L61
Grindlay, J., & Gursky, H. 1976, ApJL, 209, L61
1976
-
[22]
E., & Liller, W
Grindlay, J. E., & Liller, W. 1978, ApJL, 220, L127 8 Jaisawal et al. G¨ uver, T.,¨Ozel, F., Cabrera-Lavers, A., & Wroblewski, P. 2010, ApJ, 712, 964
1978
-
[23]
2016, ApJ, 819, 47
He, C.-C., & Keek, L. 2016, ApJ, 819, 47
2016
-
[24]
A., & Sunyaev, R
Inogamov, N. A., & Sunyaev, R. A. 1999, Astronomy Letters , 25, 269 in’t Zand, J. J. M., Galloway, D. K., Marshall, H. L., et al. 2013, A&A, 553, A83
1999
-
[25]
B., Radeva, Y., et al
Jahoda, K., Markwardt, C. B., Radeva, Y., et al. 2006, ApJS, 163, 401
2006
-
[26]
Kajava, J. J. E., Koljonen, K. I. I., N¨ attil¨ a, J., Suleimanov, V., & Poutanen, J. 2017, MNRAS, 472, 78
2017
-
[27]
2017, ApJ, 842, 113
Keek, L., & Heger, A. 2017, ApJ, 842, 113
2017
-
[28]
Keek, L., in’t Zand, J. J. M., Kuulkers, E., et al. 2008, A&A, 479, 177
2008
-
[29]
R., in’t Zand, J
Kuulkers, E., den Hartog, P. R., in’t Zand, J. J. M., et al. 2003, A&A, 399, 663
2003
-
[30]
Kuulkers, E., Homan, J., van der Klis, M., Lewin, W. H. G., & M´ endez, M. 2002, A&A, 382, 947
2002
-
[31]
I., & Sunyaev, R
Lapidus, I. I., & Sunyaev, R. A. 1985, MNRAS, 217, 291
1985
-
[32]
Lewin, W. H. G., Vacca, W. D., & Basinska, E. M. 1984, ApJL, 277, L57
1984
-
[33]
Lewin, W. H. G., van Paradijs, J., & Taam, R. E. 1993, SSRv, 62, 223
1993
-
[34]
1984, PASJ, 36, 741
Mitsuda, K., Inoue, H., Koyama, K., et al. 1984, PASJ, 36, 741
1984
-
[35]
P., Chakrabarty, D., Galloway, D
Muno, M. P., Chakrabarty, D., Galloway, D. K., & Savov, P. 2001, ApJL, 553, L157 ¨Ozel, F., Psaltis, D., G¨ uver, T., et al. 2016, ApJ, 820, 28
2001
-
[36]
1989, A&A, 208, 146
Paradijs, J. 1989, A&A, 208, 146
1989
-
[37]
Poutanen, J., N¨ attil¨ a, J., Kajava, J. J. E., et al. 2014, MNRAS, 442, 3777
2014
-
[38]
2012, in Proc
Prigozhin, G., Gendreau, K., Foster, R., et al. 2012, in Proc. SPIE, Vol. 8453, High Energy, Optical, and Infrared Detectors for Astronomy V, 845318
2012
-
[39]
2002, ApJ, 566, 1018
Spitkovsky, A., Levin, Y., & Ushomirsky, G. 2002, ApJ, 566, 1018
2002
-
[40]
2003, ArXiv Astrophysics e-prints , astro-ph/0301544, ads
Strohmayer, T., & Bildsten, L. 2003, ArXiv Astrophysics e-prints , astro-ph/0301544, ads
2003 arXiv
-
[41]
2012, A&A, 545, A120
Suleimanov, V., Poutanen, J., & Werner, K. 2012, A&A, 545, A120
2012
-
[42]
Matilsky, T. A. 1976, ApJL, 209, L125 van Straaten, S., van der Klis, M., & M´ endez, M. 2003, ApJ, 596, 1155
1976
-
[43]
2002, ApJ, 568, 901
Kaaret, P. 2002, ApJ, 568, 901
2002
-
[44]
Walker, M. A. 1992, ApJ, 385, 642
1992
-
[45]
2000, ApJ, 542, 914
Wilms, J., Allen, A., & McCray, R. 2000, ApJ, 542, 914
2000
-
[46]
K., & Price, D
Worpel, H., Galloway, D. K., & Price, D. J. 2013, ApJ, 772, 94
2013
-
[47]
K., & Price, D
Worpel, H., Galloway, D. K., & Price, D. J. 2015, ApJ, 801, 60
2015
-
[48]
2009, MNRAS, 398, 368
Homan, J. 2009, MNRAS, 398, 368
2009
Reviewed August 14, 2026 · model on record in the stance chip above.
Discussion (0). Continue with ORCID to comment.