REVIEW 5 major objections 7 minor 37 references
Decoding Neighborhood Environments with Large Language Models
T0 review · 5 major / 7 minor · reviewed 2026-08-15 · deepseek-v4-flash
Pith's one-line read Off-the-shelf LLMs, combined by majority vote, can decode neighborhood environmental indicators from street-view images at over 88% accuracy with no training, the paper argues.
desk verdict The 88% headline is an agreement rate with one annotator, so the central number is provisional; the benchmark is still genuinely new and referee-worthy. read the letter →
The pith
A machine-rendered reading of the paper's core claim, the machinery that carries it, and where it could break.
The reading
What carries the argument
The mechanism is a constrained parallel prompt plus majority voting. The parallel prompt concatenates six closed yes/no questions about the indicators into a single request with a fixed response format, so the model answers each question independently in one pass; this avoids the complex grammar that sequential follow-up prompts introduce. The yes/no answers from the three best-performing models are then fused by majority rule, and the paper reports this combination as the training-free decoder. The supervised reference point is a YOLOv11 (Nano) object detector trained on the same 1,927 labeled objects, which supplies the accuracy ceiling of 99.1% mAP50 against which the LLM pipeline is judged.
What would settle it
Take a random subset of 300 labeled images, have three independent raters re-annotate them under a written rulebook, and measure agreement; if the original labels disagree with the majority re-annotation on more than a few percent of objects, recompute the 88.5% voting accuracy on the corrected labels, and the central claim would be falsified if the corrected accuracy falls clearly below the reported figure.
Extended reading notes
Core claim
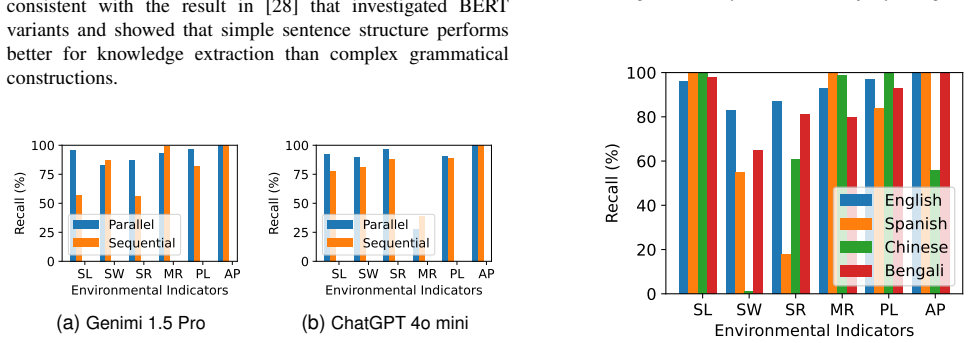
The paper's central claim is that zero-shot inference from off-the-shelf LLMs, combined through majority voting, is a usable tool for decoding neighborhood environmental indicators at scale. On 1,200 street-view images, the best single models scored between 84% and 88% average accuracy; voting across Gemini, Claude, and Grok-2 lifted average accuracy to 88.5%, with per-indicator scores of 92.86% for streetlights, 84.91% for sidewalks, 68.19% for single-lane roads, 97.07% for multilane roads, and 95.15% for both powerlines and apartments. The parallel prompt, which asks all six yes/no questions in one request, outperformed sequential prompts, and English prompts outperformed Spanish, Chinese, and Bengali versions. The authors read this as evidence that LLMs can complement supervised models when no labeled training data are available.
Load-bearing premise
The whole accuracy comparison rests on one undergraduate student's manual labels for 1,927 objects across 1,200 images being correct ground truth, with no second annotator or adjudication; if those labels contain systematic errors, both the YOLO baseline and the LLM scores inherit them.
Editorial extensions
If this is right
- Neighborhood audits for sidewalks, streetlights, and powerlines could be run on large image collections with API calls instead of a trained detection pipeline and human labelers.
- English-only deployment would be most accurate; non-English prompts caused 15–20 percentage-point drops, so multilingual settings need prompt adaptation before the method is used there.
- The method is already usable for multilane roads, powerlines, and apartments, with per-indicator accuracy above 95%, but single-lane road detection at 68% is not reliable enough without further prompting or multi-frame input.
- A no-training LLM pipeline could make neighborhood-health studies easier to reproduce in new regions, since the same prompts can be applied to any street-view dataset.
Reading between the lines
- A testable extension is a two-stage prompt for roads—first ask whether a road is present, then ask how many lanes—which would likely cure the single-lane-road failure mode that drags down the majority vote.
- Because the paper's labels were produced by one annotator, a multi-annotator re-labeling of a subset would show whether the 88.5% figure is stable; both the YOLO baseline and the LLM numbers should be treated as provisional until then.
- The reported language gap suggests the visual grounding of these models is English-centric; translating only the prompt words, not the visual concepts, loses recall, so future zero-shot pipelines should test bilingual prompts or image captions.
- If LLM accuracy continues to improve, majority voting could eventually replace supervised detectors for routine screening, but the per-call cost and latency that the paper cites mean a practical large-scale pipeline would likely distill the LLM votes into a smaller local model.
Signed reviews
Editorial analysis
A structured set of objections, weighed in public.
Referee Report
Summary. The paper proposes using off-the-shelf vision-capable large language models (ChatGPT 4o mini, Gemini 1.5 Pro, Claude 3.7, Grok-2) as zero-shot decoders of six neighborhood environmental indicators (streetlight, sidewalk, single-lane road, multilane road, powerline, apartment) from Google Street View images. It trains a YOLOv11 Nano baseline on 1,200 manually labeled images, reports high detection performance (99.1% average mAP50), and compares the four LLMs under parallel and sequential prompts, different prompt languages, and sampling-temperature/top-p settings. By majority voting across the three top-scoring LLMs, the paper claims 88.5% average accuracy, and concludes that LLMs can decode neighborhood environments without training effort.
Significance. The core idea is timely and practically relevant: if reliable, zero-shot LLM-based neighborhood auditing would substantially lower the barrier to large-scale built-environment assessment for public-health research. The paper is commendable for evaluating four commercial LLMs and per-class metrics, and the YOLO baseline provides a useful supervised reference. However, the headline numbers are vulnerable because all accuracy figures are agreements with a single annotator's labels and the majority-voting protocol is underspecified; the contribution currently reads as a promising feasibility study rather than a validated benchmark.
major comments (5)
- [Section IV-A and Section IV-C2] The ground truth for all experiments consists of labels produced by one undergraduate research student, with no second annotator, adjudication, or inter-rater reliability statistic (e.g., Cohen's kappa). The sentence in Section IV-A that 'the researcher checked the labels multiple times to ensure consistency' does not validate the labels. Consequently, every per-indicator accuracy in Tables III–VI and the 88.5% majority-voting average is an agreement rate with this single label set, and any labeling error or systematic bias directly shifts the reported numbers. An independent annotation subsample (e.g., 10–20% of images) with reported agreement is required before the word 'accuracy' can be used for the LLM results.
- [Section IV-B1] The paper states that indicators are 'randomly split' 70/20/10, which suggests a split at the object level rather than the image level. Because the 1,200 images contain multiple indicator objects (1,927 objects total), object-level splitting can put instances from the same image in both training and test sets, causing data leakage and inflating the YOLO mAP50. The split must be performed at the image level, with all objects from one image confined to a single partition, and the reported detection results should be recomputed accordingly.
- [Section IV-C2 and Figure 5] The majority-voting protocol is not fully specified. The text says the final prediction is reached 'when at least two models agree' but does not define the prediction for the three-way-disagreement case, nor does it state whether the reported accuracies are computed over all 1,200 images or only over the agreed subset. In addition, the 'top three' models are selected using the same test images on which the ensemble accuracy is then reported, so the 88.5% figure is not an out-of-sample estimate. Specify the complete voting rule and evaluate the ensemble on a held-out split or with a pre-registered model selection.
- [Abstract and Section IV-B1] The abstract's 'average accuracy of 99.13%' for YOLOv11 is in fact the average mAP50 from Table I (0.991; the per-class unrounded values average to 99.13%). Object-detection mAP50 is not classification accuracy, and the abstract's phrasing misrepresents the metric. Furthermore, the abstract and contribution list mention 'fine-tuning,' but no LLM fine-tuning is performed anywhere in the paper; the experiments cover prompt, language, and sampling-parameter tuning only. Revise the abstract and contributions to remove the fine-tuning claim and to label mAP50 as mAP50 (or 'detection accuracy' with a definition).
- [Section IV-C1] The interpretation of the prompting experiment is internally inconsistent. The paper defines sequential prompting as asking about each indicator individually and parallel prompting as the concatenated 'and' version, but the discussion concludes that 'LLMs don't perform well with complex grammatical prompts when using sequential prompts.' Since Figure 4 shows parallel prompts outperforming sequential ones, it is the parallel prompt that is more complex grammatically; the sentence should refer to parallel prompts, and the connection to the cited work on simple sentence structure needs to be re-examined.
minor comments (7)
- [Table I] The table heading 'Overall Accuracy' should be 'Overall Detection Performance' because the columns include precision, recall, F1, and mAP50; the abstract's 99.13% should be reconciled with the table's reported 99.1% average mAP50.
- [Throughout] There are typos, including 'Genimi' in Figure 4 and Section IV-C2, and 'YOlOv11' in Section III-A; these should be corrected.
- [Appendix B] The text says the appendix lists prompts in Spanish, simplified Chinese, and Bengali, but only the Spanish prompt is reproduced; the other two prompts should be added.
- [Section IV-B1] The statement that 'The samples for each indicator are evenly distributed' is contradicted by the label counts (streetlight 206, sidewalk 444, single-lane road 346, multilane road 505, powerline 301, apartment 125); clarify that class proportions were preserved in each split rather than implying balanced classes.
- [Section IV-C2] The per-class majority-voting accuracies listed (92.86, 84.91, 68.19, 97.07, 95.15, 95.15) average to approximately 88.9%, not the stated 88.5%; the rounding convention should be stated.
- [Section IV-C] The LLM 'accuracy' metric is not defined in the main text; specify that it is (TP+TN)/(TP+FP+TN+FN) per indicator and clarify whether it is computed per image or per indicator.
- [Section IV-B3] The comparison with prior work uses different indicators, datasets, and metrics (e.g., F1 versus accuracy); the claim of a 'significant improvement' over state-of-the-art should be tempered or supported by a controlled comparison on the same benchmark.
Circularity Check
No circularity: the LLM and YOLO evaluations are external benchmarks against human labels, with no fitted parameter or self-citation carrying the central claim.
full rationale
The paper's central comparisons are empirical benchmarks against human-provided labels. The YOLOv11 baseline is trained on a 70/20/10 split of the labeled images and evaluated on the held-out test split, while the LLM evaluations compare zero-shot and prompted responses to the same labels. Neither quantity is defined in terms of the model outputs or fitted parameters: the labels are produced by a human annotator (Section IV-A), and the reported accuracy metrics are standard agreement rates. The majority-voting result of 88.5% is an average over per-image comparisons, not a re-statement of any input. Prompt, language, and temperature comparisons are ablation studies on the same benchmark; selecting the top three LLMs from the test-set accuracy could inflate the reported ensemble number, but that is a statistical selection-bias concern, not a circular derivation. No load-bearing claim depends on a self-citation: the references to prior GSV and neighborhood-environment work (e.g., references [6], [22], [23]) are external, and none of the cited authors overlap with the present author list. The acknowledged limitation that human labeling error could impact model reliability is an honest validity caveat, not evidence of circularity.
Assumptions & free parameters
assumptions (4)
- domain assumption Manual labels from one undergraduate student are accurate ground truth for six environmental indicators.
- domain assumption Google Street View images from four cardinal directions at 50-foot intervals capture the neighborhood environment.
- domain assumption A single API call per image per model gives a stable estimate of LLM accuracy.
- domain assumption Image-level presence of an indicator is directly comparable between YOLO object detections and LLM yes/no answers.
Cite this review
Pith. "Pith review of Decoding Neighborhood Environments with Large Language Models." pith.science (2026). https://pith.science/paper/WJWR52NS
@misc{pith2026250508163,
  author       = {Pith},
  title        = {Pith review of: Decoding Neighborhood Environments with Large Language Models},
  year         = {2026},
  howpublished = {\url{https://pith.science/paper/WJWR52NS}},
  note         = {Machine review of arXiv:2505.08163}
}
read the original abstract
Neighborhood environments include physical and environmental conditions such as housing quality, roads, and sidewalks, which significantly influence human health and well-being. Traditional methods for assessing these environments, including field surveys and geographic information systems (GIS), are resource-intensive and challenging to evaluate neighborhood environments at scale. Although machine learning offers potential for automated analysis, the laborious process of labeling training data and the lack of accessible models hinder scalability. This study explores the feasibility of large language models (LLMs) such as ChatGPT and Gemini as tools for decoding neighborhood environments (e.g., sidewalk and powerline) at scale. We train a robust YOLOv11-based model, which achieves an average accuracy of 99.13% in detecting six environmental indicators, including streetlight, sidewalk, powerline, apartment, single-lane road, and multilane road. We then evaluate four LLMs, including ChatGPT, Gemini, Claude, and Grok, to assess their feasibility, robustness, and limitations in identifying these indicators, with a focus on the impact of prompting strategies and fine-tuning. We apply majority voting with the top three LLMs to achieve over 88% accuracy, which demonstrates LLMs could be a useful tool to decode the neighborhood environment without any training effort.
Figures


Figures from the paper (2 more)

Reference graph
Works this paper leans on
-
[1]
Physical activity and the human body in the (increasingly smart) built environment,
S. Ulijaszek, “Physical activity and the human body in the (increasingly smart) built environment,” Obesity reviews, vol. 19, pp. 84–93, 2018
work page 2018
-
[2]
M. Javanmardi, D. Huang, P. Dwivedi, S. Khanna, K. Brunisholz, R. Whitaker, Q. Nguyen, and T. Tasdizen, “Analyzing associations between chronic disease prevalence and neighborhood quality through google street view images,” IEEE Access , vol. 8, pp. 6407–6416, 2019
work page 2019
-
[3]
Q. C. Nguyen, J. M. Keralis, P. Dwivedi, A. E. Ng, M. Javanmardi, S. Khanna, Y . Huang, K. D. Brunisholz, A. Kumar, and T. Tasdizen, “Leveraging 31 million google street view images to characterize built environments and examine county health outcomes,” Public Health Reports, vol. 136, no. 2, pp. 201–211, 2021
work page 2021
-
[4]
Neighborhood environ- ments: disparities in access to healthy foods in the us,
N. I. Larson, M. T. Story, and M. C. Nelson, “Neighborhood environ- ments: disparities in access to healthy foods in the us,” American journal of preventive medicine , vol. 36, no. 1, pp. 74–81, 2009
work page 2009
-
[5]
L. Phan, W. Yu, J. M. Keralis, K. Mukhija, P. Dwivedi, K. D. Brunisholz, M. Javanmardi, T. Tasdizen, and Q. C. Nguyen, “Google street view derived built environment indicators and associations with state-level obesity, physical activity, and chronic disease mortality in the united states,” International Journal of Environmental Research and Public Health,...
work page 2020
-
[6]
Google street view images as predictors of patient health outcomes, 2017–2019,
Q. C. Nguyen, T. Belnap, P. Dwivedi, A. H. N. Deligani, A. Kumar, D. Li, R. Whitaker, J. Keralis, H. Mane, X. Yue et al. , “Google street view images as predictors of patient health outcomes, 2017–2019,” Big Data and Cognitive Computing , vol. 6, no. 1, p. 15, 2022
work page 2017
-
[7]
B. Giles-Corti and R. J. Donovan, “The relative influence of individual, social and physical environment determinants of physical activity,” Social science & medicine , vol. 54, no. 12, pp. 1793–1812, 2002
work page 2002
-
[8]
Does neighborhood collective efficacy for families change over time? the boston neighborhood survey,
N. M. Schmidt, E. J. Tchetgen Tchetgen, A. Ehntholt, J. Almeida, Q. C. Nguyen, B. E. Molnar, D. Azrael, and T. L. Osypuk, “Does neighborhood collective efficacy for families change over time? the boston neighborhood survey,” Journal of community psychology, vol. 42, no. 1, pp. 61–79, 2014
work page 2014
Show all 37 references
-
[9]
Deep metric learning based on scalable neighborhood components for remote sensing scene characterization,
J. Kang, R. Fernandez-Beltran, Z. Ye, X. Tong, P. Ghamisi, and A. Plaza, “Deep metric learning based on scalable neighborhood components for remote sensing scene characterization,” IEEE Transactions on Geo- science and Remote Sensing , vol. 58, no. 12, pp. 8905–8918, 2020. 6
2020
-
[10]
Developing a reliable audit instrument to measure the physical environment for physical activity,
T. J. Pikora, F. C. Bull, K. Jamrozik, M. Knuiman, B. Giles-Corti, and R. J. Donovan, “Developing a reliable audit instrument to measure the physical environment for physical activity,” American journal of preventive medicine, vol. 23, no. 3, pp. 187–194, 2002
2002
-
[11]
Multi- task classification for improved health outcome prediction based on environmental indicators,
M. Alirezaei, Q. C. Nguyen, R. Whitaker, and T. Tasdizen, “Multi- task classification for improved health outcome prediction based on environmental indicators,” IEEE Access , vol. 11, pp. 73 330–73 339, 2023
2023
-
[12]
Openai api reference - chat,
OpenAI, “Openai api reference - chat,” 2025, accessed: 2025-02-24. [Online]. Available: https://platform.openai.com/docs/api-reference/chat
2025
-
[13]
Deepseek,
DeepSeek, “Deepseek,” https://www.deepseek.com, 2025, accessed: 2025-03-15
2025
-
[14]
Google DeepMind, “Gemini,” https://deepmind.google/technologies/ gemini/, 2023, accessed: 2024-03-15
2023
-
[15]
Chatgpt-powered hierarchical comparisons for image classification,
Z. Ren, Y . Su, and X. Liu, “Chatgpt-powered hierarchical comparisons for image classification,” Advances in neural information processing systems, vol. 36, pp. 69 706–69 718, 2023
2023
-
[16]
Good at captioning, bad at counting: Benchmarking gpt-4v on earth observation data,
C. Zhang and S. Wang, “Good at captioning, bad at counting: Benchmarking gpt-4v on earth observation data,” arXiv preprint arXiv:2401.17600, 2024
2024 arXiv
-
[17]
Yolov11,
Ultralytics, “Yolov11,” https://github.com/ultralytics/ultralytics, ac- cessed: 2025-04-04
2025
-
[18]
Claude ai,
Anthropic, “Claude ai,” https://www.anthropic.com, 2023, accessed: 2025-04-04
2023
-
[19]
Grok 2 by xai,
xAI, “Grok 2 by xai,” https://x.ai/blog/grok-2, 2024, accessed: 2025-04- 04
2024
-
[20]
A review of urban physical environment sensing using street view imagery in public health studies,
Y . Kang, F. Zhang, S. Gao, H. Lin, and Y . Liu, “A review of urban physical environment sensing using street view imagery in public health studies,” Journal of Urban Health , vol. 97, no. 2, pp. 261–275, 2020. [Online]. Available: https://www.tandfonline.com/doi/ full/10.1080...
2020
-
[21]
Curb detection for road and sidewalk detection,
M. Cheng, Y . Zhang, Y . Su, J. M. Alvarez, and H. Kong, “Curb detection for road and sidewalk detection,” IEEE Transactions on V ehicular Technology, vol. 67, no. 11, pp. 10 330–10 342, 2018
2018
-
[22]
Health and the built environment in united states cities: measuring associations using google street view- derived indicators of the built environment,
J. M. Keralis, M. Javanmardi, S. Khanna, P. Dwivedi, D. Huang, T. Tasdizen, and Q. C. Nguyen, “Health and the built environment in united states cities: measuring associations using google street view- derived indicators of the built environment,” BMC public health , vol. 20, ...
2020
-
[23]
Google street view-derived neighborhood characteristics in california associated with coronary heart disease, hypertension, diabetes,
T. T. Nguyen, Q. C. Nguyen, A. D. Rubinsky, T. Tasdizen, A. H. N. Deligani, P. Dwivedi, R. Whitaker, J. D. Fields, M. C. DeRouen, H. Mane, C. R. Lyles, K. D. Brunisholz, and K. Bibbins- Domingo, “Google street view-derived neighborhood characteristics in california associated ...
2021
-
[24]
Learning transferable visual models from natural language supervision,
A. Radford, J. W. Kim, C. Hallacy, A. Ramesh, G. Goh, S. Agarwal, G. Sastry, A. Askell, P. Mishkin, J. Clark et al. , “Learning transferable visual models from natural language supervision,” in International conference on machine learning . PmLR, 2021, pp. 8748–8763
2021
-
[25]
Qwen technical report,
J. Bai, S. Bai, Y . Chu, Z. Cui, K. Dang, X. Deng, Y . Fan, W. Ge, Y . Han, F. Huang et al. , “Qwen technical report,” arXiv preprint arXiv:2309.16609, 2023
2023 arXiv
-
[26]
Qwen2. 5-vl technical report,
S. Bai, K. Chen, X. Liu, J. Wang, W. Ge, S. Song, K. Dang, P. Wang, S. Wang, J. Tang et al. , “Qwen2. 5-vl technical report,” arXiv preprint arXiv:2502.13923, 2025
2025 arXiv
-
[27]
Llms as visual explainers: Advancing image classification with evolving visual descriptions,
S. Han, L. Zhuo, Y . Liao, and S. Liu, “Llms as visual explainers: Advancing image classification with evolving visual descriptions,” arXiv preprint arXiv:2311.11904, 2023
2023 arXiv
-
[28]
Decoding prompt syntax: Analysing its impact on knowledge retrieval in large language models,
S. Linzbach, T. Tressel, L. Kallmeyer, S. Dietze, and H. Jabeen, “Decoding prompt syntax: Analysing its impact on knowledge retrieval in large language models,” in Companion Proceedings of the ACM Web Conference 2023, 2023, pp. 1145–1149
2023
-
[29]
English prompts are better for nli- based zero-shot emotion classification than target-language prompts,
P. Bareiß, R. Klinger, and J. Barnes, “English prompts are better for nli- based zero-shot emotion classification than target-language prompts,” in Companion Proceedings of the ACM Web Conference 2024 , 2024, pp. 1318–1326
2024
-
[30]
Data-free multi-label image recognition via llm-powered prompt tun- ing,
S. Yang, Z. Shang, Y . Wang, D. Deng, H. Chen, Q. Cheng, and X. Wu, “Data-free multi-label image recognition via llm-powered prompt tun- ing,” arXiv preprint arXiv:2403.01209 , 2024
2024 arXiv
-
[31]
Presence-only geographical priors for fine-grained image classification,
O. Mac Aodha, E. Cole, and P. Perona, “Presence-only geographical priors for fine-grained image classification,” in Proceedings of the IEEE/CVF International Conference on Computer Vision , 2019, pp. 9596–9606
2019
-
[32]
Exploiting weakly supervised visual patterns to learn from partial annotations,
K. Kundu and J. Tighe, “Exploiting weakly supervised visual patterns to learn from partial annotations,” Advances in Neural Information Processing Systems, vol. 33, pp. 561–572, 2020
2020
-
[33]
Learning a deep embedding model for zero-shot learning,
L. Zhang, T. Xiang, and S. Gong, “Learning a deep embedding model for zero-shot learning,” in Proceedings of the IEEE conference on computer vision and pattern recognition , 2017, pp. 2021–2030
2017
-
[34]
Large language models are good prompt learners for low-shot image classification,
Z. Zheng, J. Wei, X. Hu, H. Zhu, and R. Nevatia, “Large language models are good prompt learners for low-shot image classification,” in Proceedings of the IEEE/CVF Conference on Computer Vision and Pattern Recognition, 2024, pp. 28 453–28 462
2024
-
[35]
Labelme: a database and web-based tool for image annotation,
B. C. Russell, A. Torralba, K. P. Murphy, and W. T. Freeman, “Labelme: a database and web-based tool for image annotation,” International journal of computer vision , vol. 77, pp. 157–173, 2008
2008
-
[36]
Exploring temperature effects on large language models across various clinical tasks,
D. Patel, P. Timsina, G. Raut, R. Freeman, M. A. Levin, G. N. Nadkarni, B. S. Glicksberg, and E. Klang, “Exploring temperature effects on large language models across various clinical tasks,” medRxiv, 2024. [Online]. Available: https://www.medrxiv.org/content/early/2024/07/22/...
2024
-
[37]
The effect of sampling temperature on problem solving in large language models,
M. Renze and E. Guven, “The effect of sampling temperature on problem solving in large language models,” in Findings of the Association for Computational Linguistics: EMNLP 2024 . Miami, Florida: Association for Computational Linguistics, November 2024, pp. 7346–7356. [Online]...
2024
Reviewed August 15, 2026 · model on record in the stance chip above.
Discussion (0). Continue with ORCID to comment.