Somewhere Over the Desktop: A Research Agenda for Ubiquitous Analytics
Pith reviewed 2026-06-27 08:24 UTC · model grok-4.3
The pith
Spatial computing, generative AI, and open web standards converge to enable data sensemaking on distributed devices.
A machine-rendered reading of the paper's core claim, the machinery that carries it, and where it could break.
Core claim
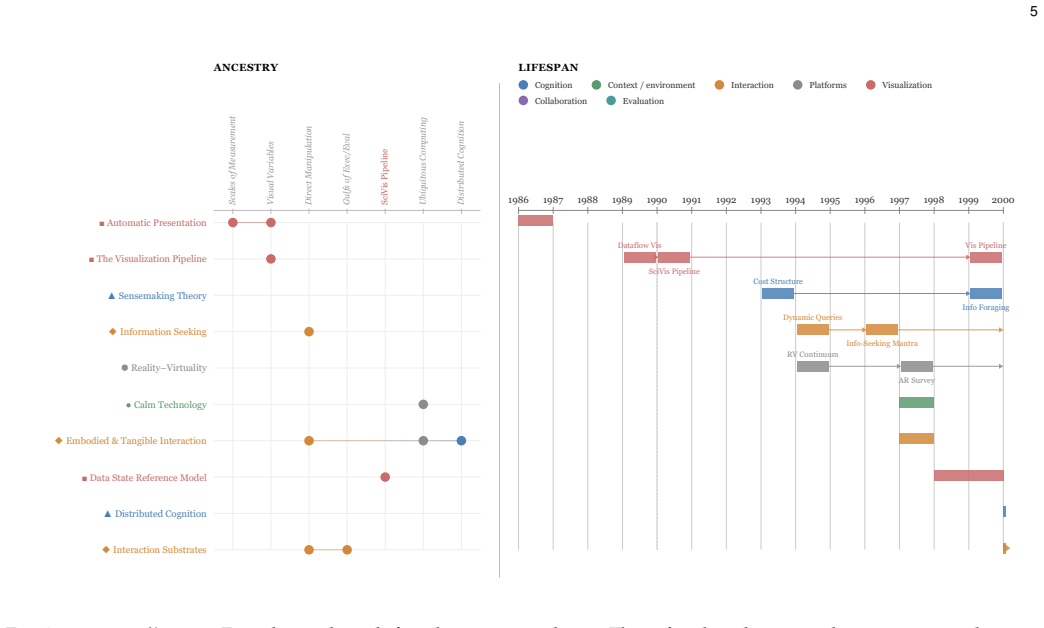
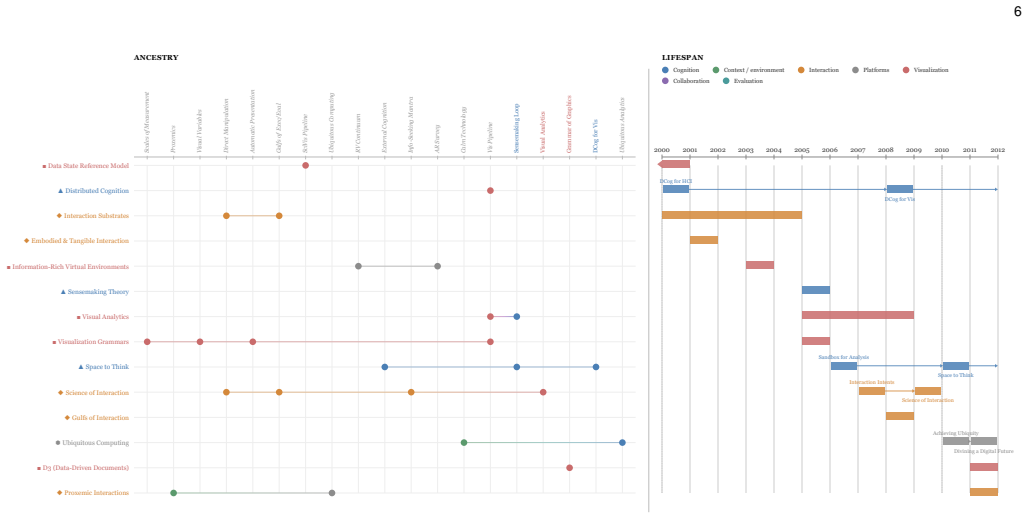
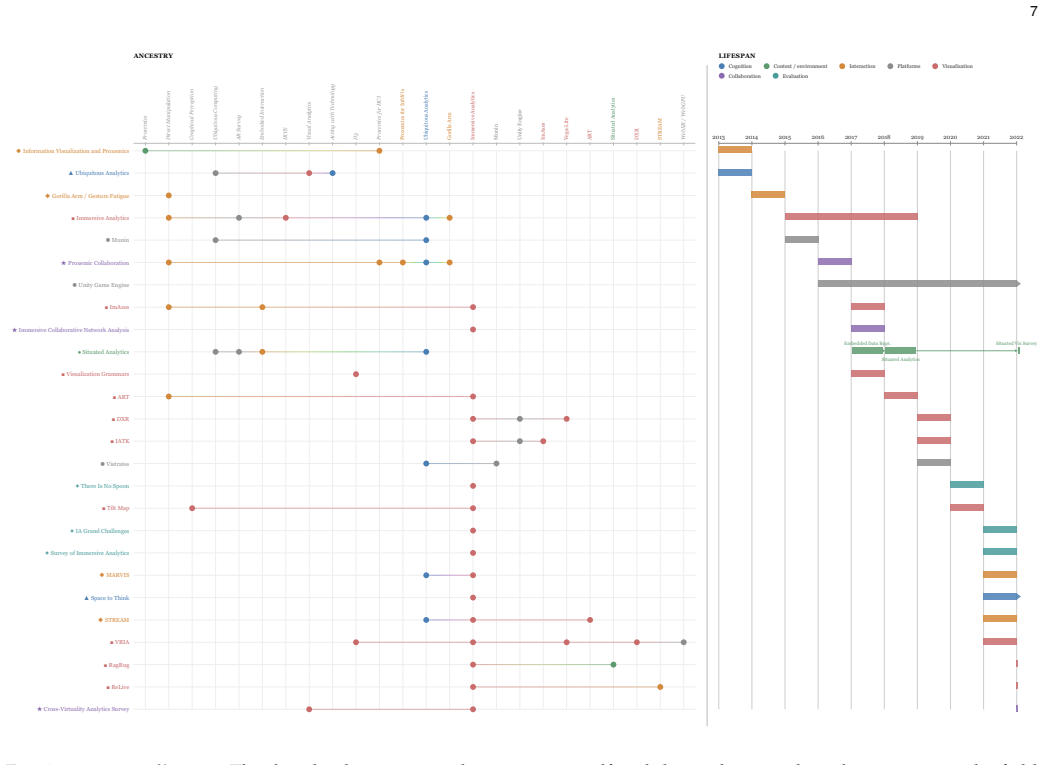
Ubiquitous analytics has matured to the point where its intellectual history can be read as a structured genealogy of foundations, contributions, and lineages. The authors organize this genealogy into clusters spanning cognition, context, interaction, platforms, visualization, collaboration, and evaluation. Crossing these clusters yields a total of 42 future research challenges that address the convergence of spatial computing, generative AI, and open web standards.
What carries the argument
A structured genealogy of foundations, contributions, and lineages organized into seven clusters that are crossed to produce 42 research challenges.
If this is right
- Data sensemaking becomes possible anytime and anywhere using physically distributed, networked devices.
- Agentic AI can operate on the same spatial substrates as the human user.
- Evidence-based alternatives from research can prevent proprietary platforms from locking in design conventions.
- Visualization and collaboration gain new capabilities in spatial and wearable environments.
- Evaluation methods must adapt to distributed, multi-device spatial settings.
Where Pith is reading between the lines
- The agenda could extend analytics tools to everyday physical environments such as homes or collaborative workspaces.
- It connects visualization research directly to emerging standards in wearable and augmented displays.
- A testable extension would involve building an open prototype for one challenge and measuring changes in sensemaking speed or accuracy.
- Distributed device networks raise privacy issues that may need dedicated follow-on challenges.
Load-bearing premise
Proprietary platforms are settling design conventions that will calcify without evidence-based alternatives from the research community.
What would settle it
An observation that design conventions in Android XR, Meta Horizon OS, or Apple visionOS have incorporated open research contributions or that open alternatives have achieved measurable adoption in spatial analytics tools.
Figures


read the original abstract
Spatial computing, generative AI, and open web standards are converging. Three spatial operating systems -- Android XR, Meta Horizon OS, and Apple visionOS -- now ship with platform-level scene understanding. Wearable displays span the range from full headsets to slim smartglasses. Agentic AI operates on the same spatial substrates as the human user. This convergence enables new opportunities for \textit{ubiquitous analytics} (UA): the use of many, physically distributed, networked devices to support data sensemaking anytime and anywhere. But proprietary platforms are settling design conventions that will calcify without evidence-based alternatives. UA has now matured to the point where its intellectual history can be read as a structured genealogy of foundations, contributions, and lineages. We trace this genealogy and organize it into clusters spanning cognition, context, interaction, platforms, visualization, collaboration, and evaluation. Finally, we cross these clusters with each other, yielding a total of 42 future research challenges.
Editorial analysis
A structured set of objections, weighed in public.
Referee Report
Summary. The paper claims that spatial computing (e.g., Android XR, Meta Horizon OS, Apple visionOS), generative AI, and open web standards are converging to enable ubiquitous analytics (UA): the use of many physically distributed, networked devices to support data sensemaking anytime and anywhere. It traces UA's intellectual genealogy, organizes it into seven clusters (cognition, context, interaction, platforms, visualization, collaboration, evaluation), and derives 42 cross-cluster research challenges. The paper warns that proprietary platforms risk calcifying design conventions without evidence-based research alternatives.
Significance. If the synthesis holds, the paper supplies a structured research agenda that could usefully guide HCI and visualization work on multi-device sensemaking. The explicit enumeration of 42 challenges is a concrete contribution that offers the community specific directions rather than vague calls for more research. The paper's organization across seven clusters provides a useful map of the intellectual lineage.
major comments (2)
- [Abstract] Abstract: the claim that UA 'has now matured to the point where its intellectual history can be read as a structured genealogy' and that the 42 challenges 'follow rigorously from the synthesis' is not supported by any description of the method used to identify the seven clusters, validate them, or perform the cross-cluster derivation; this methodology is load-bearing for the central contribution.
- [Abstract] Abstract: the enabling claim that the three technologies 'converge' to support UA via 'agentic AI [operating] on the same spatial substrates' is asserted without concrete examples, citations, or evidence of interaction between scene understanding, generative models, and open standards; this underpins the motivation for the entire agenda.
minor comments (1)
- [Abstract] Abstract: 'agentic AI' is introduced without a brief definition or reference; adding one sentence would improve readability for the broader HCI audience.
Simulated Author's Rebuttal
We thank the referee for the detailed and constructive review. The two major comments identify important gaps in the abstract's grounding and methodological transparency. We agree that both points require revision and outline specific changes below.
read point-by-point responses
-
Referee: [Abstract] Abstract: the claim that UA 'has now matured to the point where its intellectual history can be read as a structured genealogy' and that the 42 challenges 'follow rigorously from the synthesis' is not supported by any description of the method used to identify the seven clusters, validate them, or perform the cross-cluster derivation; this methodology is load-bearing for the central contribution.
Authors: We agree that the abstract's claims about a 'structured genealogy' and challenges that 'follow rigorously from the synthesis' require explicit methodological support, as this underpins the paper's central contribution. The current manuscript describes the clusters and challenges in the body but does not detail the derivation process in the abstract or provide a dedicated methods subsection. In revision we will (1) shorten the abstract's methodological claim and (2) add a new subsection (likely 1.3) that explains the process: a systematic literature review of foundational papers in each domain, thematic clustering validated through author consensus and alignment with prior surveys, and systematic cross-cluster pairing to generate the 42 challenges. This will make the synthesis reproducible and address the load-bearing concern. revision: yes
-
Referee: [Abstract] Abstract: the enabling claim that the three technologies 'converge' to support UA via 'agentic AI [operating] on the same spatial substrates' is asserted without concrete examples, citations, or evidence of interaction between scene understanding, generative models, and open standards; this underpins the motivation for the entire agenda.
Authors: The referee is correct that the abstract asserts convergence of spatial computing, generative AI, and open standards without citations or concrete interaction examples. While the body of the manuscript discusses these technologies, the abstract must be self-contained. We will revise the abstract to include brief citations to platform documentation (Apple visionOS scene understanding, Meta Horizon OS spatial APIs, Android XR) and recent work on agentic models operating over spatial representations, plus one concrete example of interaction (e.g., scene-understanding output feeding generative models that produce device-agnostic visualization specifications via open web standards). This grounds the motivation without lengthening the abstract excessively. revision: yes
Circularity Check
No significant circularity detected
full rationale
The paper is a position and synthesis piece that traces an intellectual genealogy of ubiquitous analytics across seven clusters and proposes 42 research challenges. It advances no derivations, equations, predictions, fitted parameters, or formal propositions. All claims rest on external literature synthesis rather than any self-referential reduction or internal construction, making the work self-contained against external benchmarks.
Axiom & Free-Parameter Ledger
axioms (1)
- domain assumption The field of ubiquitous analytics has matured to the point where its intellectual history can be read as a structured genealogy of foundations, contributions, and lineages.
Reference graph
Works this paper leans on
-
[1]
Ubiquitous analytics: Interacting with big data anywhere, anytime
N. Elmqvist and P . Irani, “Ubiquitous analytics: Interacting with big data anywhere, anytime.”IEEE Computer, vol. 46, no. 4, pp. 86–89, 2013
2013
-
[2]
The computer for the 21st Century,
M. Weiser, “The computer for the 21st Century,”Scientific Ameri- can, vol. 265, no. 3, pp. 94–104, 1991
1991
-
[3]
Data analytics anywhere and everywhere,
N. Elmqvist, “Data analytics anywhere and everywhere,”Commu- nications of the ACM, vol. 66, no. 12, pp. 52–63, 2023
2023
-
[4]
Hutchins,Cognition in the Wild
E. Hutchins,Cognition in the Wild. Cambridge, MA, USA: MIT Press, 1995
1995
-
[5]
Distributed cogni- tion: toward a new foundation for human-computer interaction research,
J. D. Hollan, E. L. Hutchins, and D. Kirsh, “Distributed cogni- tion: toward a new foundation for human-computer interaction research,”ACM Transactions on Computer-Human Interaction, vol. 7, no. 2, pp. 174–196, 2000
2000
-
[6]
Is native na¨ıve? comparing native game engines and WebXR as immersive analytics development platforms,
P . W. S. Butcher, A. Batch, D. Saffo, B. MacIntyre, N. Elmqvist, and P . D. Ritsos, “Is native na¨ıve? comparing native game engines and WebXR as immersive analytics development platforms,”IEEE Computer Graphics & Applications, vol. 44, no. 3, pp. 91–98, 2024
2024
-
[7]
What’s the situation with situated visualization? a survey and perspectives on situatedness,
N. Bressa, H. Korsgaard, A. Tabard, S. Houben, and J. Vermeulen, “What’s the situation with situated visualization? a survey and perspectives on situatedness,”IEEE Transactions on Visualization and Computer Graphics, vol. 28, no. 1, pp. 107–117, 2022
2022
-
[8]
Grand challenges in immersive analytics,
B. Ens, B. Bach, M. Cordeil, U. Engelke, M. Serrano, W. Wil- lett, A. Prouzeau, C. Anthes, W. B ¨uschel, C. Dunne, T. Dwyer, J. Grubert, J. H. Haga, N. Kirshenbaum, D. Kobayashi, T. Lin, M. Olaosebikan, F. Pointecker, D. Saffo, N. Saquib, D. Schmalstieg, D. A. Szafir, M. Whitlock, and Y. Yang, “Grand challenges in immersive analytics,” inProceedings of th...
2021
-
[9]
Visualization beyond the desktop—the next big thing,
J. Roberts, P . Ritsos, S. K. Badam, D. Brodbeck, J. Kennedy, and N. Elmqvist, “Visualization beyond the desktop—the next big thing,”IEEE Computer Graphics & Applications, vol. 34, no. 6, pp. 26–34, Nov 2014
2014
-
[10]
Achieving ubiquity: The new third wave,
C. Harrison, J. Wiese, and A. K. Dey, “Achieving ubiquity: The new third wave,”IEEE Multimedia, vol. 17, no. 3, pp. 8–12, 2010
2010
-
[11]
Immersive analytics,
T. Chandler, M. Cordeil, T. Czauderna, T. Dwyer, J. Glowacki, C. Goncu, M. Klapperstueck, K. Klein, F. Schreiber, and E. Wilson, “Immersive analytics,” inProceedings of the International Symposium on Big Data Visual Analytics. Piscataway, NJ, USA: IEEE, 2015, pp. 1–8
2015
-
[12]
Marriott, F
K. Marriott, F. Schreiber, T. Dwyer, K. Klein, N. H. Riche, T. Itoh, W. Stuerzlinger, and B. H. Thomas, Eds.,Immersive Analytics, ser. Lecture Notes in Computer Science. Berlin, Germany: Springer International Publishing, 2018, vol. 11190
2018
-
[13]
Situated analytics: Demonstrating immersive analyt- ical tools with Augmented Reality,
N. A. M. ElSayed, B. H. Thomas, K. Marriott, J. Piantadosi, and R. T. Smith, “Situated analytics: Demonstrating immersive analyt- ical tools with Augmented Reality,”Journal of Visual Languages & Computing, vol. 36, pp. 13–23, 2016
2016
-
[14]
Embedded data represen- tations,
W. Willett, Y. Jansen, and P . Dragicevic, “Embedded data represen- tations,”IEEE Transactions on Visualization and Computer Graphics, vol. 23, no. 1, pp. 461–470, 2017
2017
-
[15]
B. Lee, R. Dachselt, P . Isenberg, and E. K. Choe,Mobile Data Visualization, ser. AK Peters Visualization Series. Boca Raton, FL, USA: Chapman and Hall/CRC Press, 2022
2022
-
[16]
External cognition: how do graphical representations work?
M. Scaife and Y. Rogers, “External cognition: how do graphical representations work?”International Journal of Human-Computer Studies, vol. 45, no. 2, pp. 185–213, 1996
1996
-
[17]
Distributed cognition as a theoretical framework for information visualization,
Z. Liu, N. J. Nersessian, and J. T. Stasko, “Distributed cognition as a theoretical framework for information visualization,”IEEE Transactions on Visualization and Computer Graphics, vol. 14, no. 6, pp. 1173–1180, 2008. 13
2008
-
[18]
Instrumental interaction: an interaction model for designing post-WIMP user interfaces,
M. Beaudouin-Lafon, “Instrumental interaction: an interaction model for designing post-WIMP user interfaces,” inProceedings of the ACM Conference on Human Factors in Computing Systems. New York, NY, USA: ACM, 2000, pp. 446–453
2000
-
[19]
Designing interaction, not interfaces,
——, “Designing interaction, not interfaces,” inProceedings of the ACM Conference on Advanced Visual Interfaces. New York, NY, USA: ACM, 2004, pp. 15–22
2004
-
[20]
Interaction substrates: Combining power and simplicity in interactive systems,
W. E. Mackay and M. Beaudouin-Lafon, “Interaction substrates: Combining power and simplicity in interactive systems,” inPro- ceedings of the ACM Conference on Human Factors in Computing Systems. New York, NY, USA: ACM, 2025, pp. 6871:1–687:16
2025
-
[21]
Cognitive engineering,
D. A. Norman, “Cognitive engineering,” inUser Centered System Design: New Perspectives on Human-Computer Interaction, D. A. Norman and S. W. Draper, Eds. Hillsdale, NJ, USA: Lawrence Erlbaum Associates, 1986, pp. 31–61
1986
-
[23]
Grand challenges for HCI researchers,
B. Shneiderman, C. Plaisant, M. S. Cohen, S. Jacobs, N. Elmqvist, and N. Diakopoulos, “Grand challenges for HCI researchers,” Interactions, vol. 23, no. 5, pp. 24–25, 2016
2016
-
[24]
J. J. Thomas and K. A. Cook, Eds.,Illuminating the Path: The Re- search and Development Agenda for Visual Analytics. Los Alamitos, CA, USA: IEEE Computer Society, 2005
2005
-
[25]
Top scientific visualization research problems,
C. R. Johnson, “Top scientific visualization research problems,” IEEE Computer Graphics & Applications, vol. 24, no. 4, pp. 13–17, 2004
2004
-
[26]
Guidelines for snowballing in systematic literature studies and a replication in software engineering,
C. Wohlin, “Guidelines for snowballing in systematic literature studies and a replication in software engineering,” inProceedings of the ACM Conference on Evaluation and Assessment in Software Engineering. New York, NY, USA: ACM, 2014
2014
-
[27]
Connectivity in a citation network: The development of dna theory,
N. P . Hummon and P . Dereian, “Connectivity in a citation network: The development of dna theory,”Social Networks, vol. 11, no. 1, pp. 39–63, 1989
1989
-
[28]
The reality of the situation: A survey of situated analytics,
S. Shin, A. Batch, P . W. S. Butcher, P . D. Ritsos, and N. Elmqvist, “The reality of the situation: A survey of situated analytics,”IEEE Transactions on Visualization and Computer Graphics, vol. 30, no. 8, pp. 5147–5164, 2024
2024
-
[29]
Bertin,S´ emiologie graphique : Les diagrammes - Les r´ eseaux - Les cartes, les r´eimpressions ed
J. Bertin,S´ emiologie graphique : Les diagrammes - Les r´ eseaux - Les cartes, les r´eimpressions ed. Paris, France: Editions de l’Ecole des Hautes Etudes en Sciences, 1967
1967
-
[30]
UpSet: Visualization of intersecting sets,
A. Lex, N. Gehlenborg, H. Strobelt, R. Vuillemot, and H. Pfister, “UpSet: Visualization of intersecting sets,”IEEE Transactions on Visualization and Computer Graphics, vol. 20, no. 12, pp. 1983–1992, 2014
1983
-
[31]
GeneaQuilts: A system for exploring large genealogies,
A. Bezerianos, P . Dragicevic, J. Fekete, J. Bae, and B. Watson, “GeneaQuilts: A system for exploring large genealogies,”IEEE Transactions on Visualization and Computer Graphics, vol. 16, no. 6, pp. 1073–1081, 2010
2010
-
[32]
On the theory of scales of measurement,
S. S. Stevens, “On the theory of scales of measurement,”Science, vol. 103, no. 2684, pp. 677–680, 1946
1946
-
[33]
Graphical perception: Theory, experimentation and application to the development of graphical methods,
W. S. Cleveland and R. McGill, “Graphical perception: Theory, experimentation and application to the development of graphical methods,”Journal of the American Statistical Association, vol. 79, no. 387, pp. 531–554, Sep. 1984
1984
-
[34]
Automating the design of graphical presentations of relational information,
J. Mackinlay, “Automating the design of graphical presentations of relational information,”ACM Transactions on Graphics, vol. 5, no. 2, pp. 110–141, Apr. 1986
1986
-
[35]
S. K. Card, J. D. Mackinlay, and B. Shneiderman, Eds.,Readings in Information Visualization: Using Vision to Think. San Francisco, CA, USA: Morgan Kaufmann Publishers, 1999
1999
-
[36]
A taxonomy of visualization techniques using the data state reference model,
E. H. Chi, “A taxonomy of visualization techniques using the data state reference model,” inProceedings of the IEEE Symposium on Information Visualization. Los Alamitos, CA, USA: IEEE Computer Society, 2000, pp. 69–75
2000
-
[37]
Direct manipulation: A step beyond program- ming languages,
B. Shneiderman, “Direct manipulation: A step beyond program- ming languages,”Computer, vol. 16, no. 8, pp. 57–69, 1983
1983
-
[38]
Dynamic queries for visual information seeking,
——, “Dynamic queries for visual information seeking,”IEEE Software, vol. 11, no. 6, pp. 70–77, Nov. 1994
1994
-
[39]
The eyes have it: A task by data type taxonomy for information visualizations,
——, “The eyes have it: A task by data type taxonomy for information visualizations,” inProceedings of the IEEE Symposium on Visual Languages. Piscataway, NJ, USA: IEEE, 1996, pp. 336– 343
1996
-
[40]
The intelligent use of space,
D. Kirsh, “The intelligent use of space,”Artificial Intelligence, vol. 73, no. 1-2, pp. 31–68, 1995
1995
-
[41]
L. S. Vygotsky,Mind in Society: The Development of Higher Psycho- logical Processes. Boston, MA, USA: Harvard University Press, 1978
1978
-
[42]
B. A. Nardi, Ed.,Context and Consciousness: Activity Theory and Human-Computer Interaction. Cambridge, MA, USA: MIT Press, 1995
1995
-
[43]
Kaptelinin and M
V . Kaptelinin and M. Czerwinski, Eds.,Beyond the Desktop Metaphor: Design Integrated Digital Work Environments. Cambridge, MA, USA: MIT Press, 2009
2009
-
[44]
Information foraging,
P . Pirolli and S. Card, “Information foraging,”Psychological Review, vol. 106, pp. 643–675, 1999
1999
-
[45]
The ultimate display,
I. E. Sutherlandet al., “The ultimate display,” inProceedings of the IFIP Congress, vol. 2, 1965, pp. 506–508
1965
-
[46]
A Taxonomy of Mixed Reality Visual Displays,
P . Milgram and F. Kishino, “A Taxonomy of Mixed Reality Visual Displays,”IEICE Transactions on Information Systems, vol. E77-D, no. 12, pp. 1321–1329, 1994, pp. 1321–1329
1994
-
[47]
A survey of augmented reality,
R. T. Azuma, “A survey of augmented reality,”Presence: Teleopera- tors and Virtual Environments, vol. 6, no. 4, pp. 355–385, 1997
1997
-
[48]
D. Keim, G. Andrienko, J.-D. Fekete, C. G ¨org, J. Kohlhammer, and G. Melancon,Visual Analytics: Definition, Process, and Challenges, ser. LNCS. Springer International Publishing, 2008, vol. 4950, ch. 7, pp. 154–175
2008
-
[49]
The sensemaking process and leverage points for analyst technology as identified through cognitive task analysis,
P . Pirolli and S. Card, “The sensemaking process and leverage points for analyst technology as identified through cognitive task analysis,” inProceedings of the International Conference on Intelligence Analysis, vol. 5, 2005, pp. 2–4
2005
-
[50]
The cost structure of sensemaking,
D. M. Russell, M. J. Stefik, P . Pirolli, and S. K. Card, “The cost structure of sensemaking,” inProceedings of the ACM Conference on Human Factors in Computing Systems. New York, NY, USA: ACM, 1993, pp. 269–276
1993
-
[51]
Toward a deeper understand- ing of the role of interaction in information visualization,
J. S. Yi, Y. ah Kang, and J. Stasko, “Toward a deeper understand- ing of the role of interaction in information visualization,”IEEE Transactions on Visualization and Computer Graphics, vol. 13, no. 6, pp. 1224–1231, 2007
2007
-
[52]
The science of interaction,
W. A. Pike, J. Stasko, R. Chang, and T. A. O’Connell, “The science of interaction,”Information Visualization, vol. 8, no. 4, pp. 263–274, Dec. 2009
2009
-
[53]
A framework of interaction costs in information visual- ization,
H. Lam, “A framework of interaction costs in information visual- ization,”IEEE Transactions on Visualization and Computer Graphics, vol. 14, no. 6, pp. 1149–1156, 2008
2008
-
[54]
Wilkinson,The Grammar of Graphics, second edition ed., ser
L. Wilkinson,The Grammar of Graphics, second edition ed., ser. Statistics and computing. Springer, 2005
2005
-
[55]
D3: Data-driven docu- ments,
M. Bostock, V . Ogievetsky, and J. Heer, “D3: Data-driven docu- ments,”IEEE Transactions on Visualization and Computer Graphics, vol. 17, no. 6, pp. 2301–2309, 2011
2011
-
[56]
Vega-Lite: A grammar of interactive graphics,
A. Satyanarayan, D. Moritz, K. Wongsuphasawat, and J. Heer, “Vega-Lite: A grammar of interactive graphics,”IEEE Transactions on Visualization and Computer Graphics, vol. 23, no. 1, pp. 341–350, 2017
2017
-
[57]
The sandbox for analysis: Concepts and evaluation,
W. Wright, D. Schroh, P . Proulx, A. Skaburskis, and B. Cort, “The sandbox for analysis: Concepts and evaluation,” inProceedings of the ACM Conference on Human Factors in Computing Systems. New York, NY, USA: ACM, 2006, pp. 801–810
2006
-
[58]
Space to think: Large, high- resolution displays for sensemaking,
C. Andrews, A. Endert, and C. North, “Space to think: Large, high- resolution displays for sensemaking,” inProceedings of the ACM Conference on Human Factors in Computing Systems. New York, NY, USA: ACM, 2010, pp. 55–64
2010
-
[59]
Information-rich virtual environments: theory, tools, and research agenda,
D. A. Bowman, C. North, J. Chen, N. F. Polys, P . S. Pyla, and U. Yilmaz, “Information-rich virtual environments: theory, tools, and research agenda,” inProceedings of the ACM Symposium on Virtual Reality Software and Technology. New York, NY, USA: ACM, 2003, pp. 81–90
2003
-
[60]
Proxemic interactions: the new ubicomp?
S. Greenberg, N. Marquardt, T. Ballendat, R. Diaz-Marino, and M. Wang, “Proxemic interactions: the new ubicomp?”Interactions, vol. 18, no. 1, pp. 42–50, 2011
2011
-
[61]
E. T. Hall,The Hidden Dimension. Garden City, NY, USA: Anchor Books, 1966
1966
-
[62]
Situated analytics,
B. H. Thomas, G. F. Welch, P . Dragicevic, N. Elmqvist, P . Irani, Y. Jansen, D. Schmalstieg, A. Tabard, N. A. M. ElSayed, R. T. Smith, and W. Willett, “Situated analytics,” inImmersive Analytics, ser. Lecture Notes in Computer Science, vol. 11190. Berlin, Germany: Springer, 2018, pp. 185–220
2018
-
[63]
DXR: A toolkit for building immersive data visualizations,
R. Sicat, J. Li, J. Choi, M. Cordeil, W.-K. Jeong, B. Bach, and H. Pfis- ter, “DXR: A toolkit for building immersive data visualizations,” IEEE Transactions on Visualization and Computer Graphics, vol. 25, no. 1, pp. 715–725, 2019. 14
2019
-
[64]
IATK: An immersive analytics toolkit,
M. Cordeil, A. Cunningham, B. Bach, C. Hurter, B. H. Thomas, K. Marriott, and T. Dwyer, “IATK: An immersive analytics toolkit,” inProceedings of the IEEE Conference on Virtual Reality and 3D User Interfaces. Piscataway, NJ, USA: IEEE, 2019, pp. 200–209
2019
-
[65]
VRIA: A web- based framework for creating immersive analytics experiences,
P . W. S. Butcher, N. W. John, and P . D. Ritsos, “VRIA: A web- based framework for creating immersive analytics experiences,” IEEE Transactions on Visualization and Computer Graphics, vol. 27, no. 7, pp. 3213–3225, 2021
2021
-
[66]
Munin: A peer-to-peer middleware for ubiquitous analytics and visualization spaces,
S. K. Badam, E. Fisher, and N. Elmqvist, “Munin: A peer-to-peer middleware for ubiquitous analytics and visualization spaces,” IEEE Transactions on Visualization and Computer Graphics, vol. 21, no. 2, pp. 215–228, 2015
2015
-
[67]
Vistrates: A component model for ubiquitous an- alytics,
S. K. Badam, A. Mathisen, R. R ¨adle, C. N. Klokmose, and N. Elmqvist, “Vistrates: A component model for ubiquitous an- alytics,”IEEE Transactions on Visualization and Computer Graphics, vol. 25, no. 1, pp. 586–596, Jan. 2019
2019
-
[68]
Supporting vi- sual exploration for multiple users in large display environments,
S. K. Badam, F. Amini, N. Elmqvist, and P . Irani, “Supporting vi- sual exploration for multiple users in large display environments,” inProceedings of the IEEE Conference on Visual Analytics Science and Technology. Los Alamitos, CA, USA: IEEE Computer Society, 2016, pp. 1–10
2016
-
[69]
Sensemaking strategies with immersive space to think,
L. Lisle, K. Davidson, J. K. E. Gitre, C. North, and D. A. Bow- man, “Sensemaking strategies with immersive space to think,” in Proceedings of the IEEE Conference on Virtual Reality and 3D User Interfaces. Los Alamitos, CA, USA: IEEE Computer Society, 2021, pp. 529–537
2021
-
[70]
Exploring the evolution of sensemaking strategies in immersive space to think,
K. Davidson, L. Lisle, K. Whitley, D. A. Bowman, and C. North, “Exploring the evolution of sensemaking strategies in immersive space to think,”IEEE Transactions on Visualization and Computer Graphics, vol. 29, no. 12, pp. 5294–5307, 2023
2023
-
[71]
DashSpace: A live collaborative platform for immersive and ubiquitous analytics,
M. Borowski, P . W. S. Butcher, J. B. Kristensen, J. O. Petersen, P . D. Ritsos, C. N. Klokmose, and N. Elmqvist, “DashSpace: A live collaborative platform for immersive and ubiquitous analytics,” IEEE Transactions on Visualization and Computer Graphics, vol. 31, no. 10, pp. 7034–7047, 2025
2025
-
[72]
Spatialstrates: Cross-reality collaboration through spatial hypermedia,
M. Borowski, J. E. S. Grønbæk, P . W. S. Butcher, P . D. Ritsos, C. N. Klokmose, and N. Elmqvist, “Spatialstrates: Cross-reality collaboration through spatial hypermedia,” inProceedings of the ACM Symposium on User Interface Software and Technology. New York, NY, USA: ACM, 2025, pp. 187:1–187:14
2025
-
[73]
Consumed endurance: A metric to quantify arm fatigue of mid- air interactions,
J. D. Hincapi ´e-Ramos, X. Guo, P . Moghadasian, and P . Irani, “Consumed endurance: A metric to quantify arm fatigue of mid- air interactions,” inProceedings of the ACM Conference on Human Factors in Computing Systems. New York, NY, USA: ACM, 2014, pp. 1063–1072
2014
-
[74]
Anu.js: Accelerating web-based immersive analytics,
D. Saffo, B. Lee, F. Lu, C. Y. Wang, and B. MacIntyre, “Anu.js: Accelerating web-based immersive analytics,” inProceedings of the ACM Conference on Human Factors in Computing Systems. New York, NY, USA: ACM, 2026, pp. 852:1–852:18
2026
-
[75]
ImAxes: Immersive axes as embodied affordances for inter- active multivariate data visualisation,
M. Cordeil, A. Cunningham, T. Dwyer, B. H. Thomas, and K. Mar- riott, “ImAxes: Immersive axes as embodied affordances for inter- active multivariate data visualisation,” inProceedings of the ACM Symposium on User Interface Software and Technology. New York, NY, USA: ACM, 2017, pp. 71–83
2017
-
[76]
Immersive collaborative analysis of network connectiv- ity: CAVE-style or head-mounted display?
M. Cordeil, T. Dwyer, K. Klein, B. Laha, K. Marriott, and B. H. Thomas, “Immersive collaborative analysis of network connectiv- ity: CAVE-style or head-mounted display?”IEEE Transactions on Visualization and Computer Graphics, vol. 23, no. 1, pp. 441–450, 2017
2017
-
[77]
A survey on cross-virtuality analytics,
B. Fr ¨ohler, C. Anthes, F. Pointecker, J. Friedl, D. Schwajda, A. Riegler, S. Tripathi, C. Holzmann, M. Brunner, H. Jodlbauer, H. Jetter, and C. Heinzl, “A survey on cross-virtuality analytics,” Computer Graphics Forum, vol. 41, no. 1, pp. 465–494, 2022
2022
-
[78]
Through their eyes and in their shoes: Providing group awareness during collabora- tion across virtual reality and desktop platforms,
D. Saffo, A. Batch, C. Dunne, and N. Elmqvist, “Through their eyes and in their shoes: Providing group awareness during collabora- tion across virtual reality and desktop platforms,” inProceedings of the ACM Conference on Human Factors in Computing Systems. New York, NY, USA: ACM, 2023, pp. 383:1–383:15
2023
-
[79]
There is no spoon: Evaluating performance, space use, and presence with expert domain users in immersive analytics,
A. Batch, A. Cunningham, M. Cordeil, N. Elmqvist, T. Dwyer, B. H. Thomas, and K. Marriott, “There is no spoon: Evaluating performance, space use, and presence with expert domain users in immersive analytics,”IEEE Transactions on Visualization and Computer Graphics, vol. 26, no. 1, pp. 536–546, 2020
2020
-
[80]
Supporting team-first visual analytics through group activity representations,
S. K. Badam, Z. Zeng, E. Wall, A. Endert, and N. Elmqvist, “Supporting team-first visual analytics through group activity representations,” inProceedings of the Graphics Interface Conference. Canadian Human-Computer Communications Society, 2017, pp. 208–213
2017
-
[81]
A multi- literacy model for interactive visualization literacy: Definitions, literacies, and steps for future research,
G. M. Le ´on, B. Bach, M. Valentim, and N. Elmqvist, “A multi- literacy model for interactive visualization literacy: Definitions, literacies, and steps for future research,” inProceedings of the ACM Conference on Human Factors in Computing Systems. ACM, 2026, pp. 1147:1–1147:16
2026
discussion (0)
Sign in with ORCID, Apple, or X to comment. Anyone can read and Pith papers without signing in.