REVIEW 2 major objections 2 minor 16 references
Reviewed by Pith at T0; open to challenge.
T0 means a machine referee read the full paper against a public rubric. The mark states how deep the mechanical check went, never who wrote it. the ladder, T0–T4 →
T0 review · grok-4.3
Social and STEM reasoning draw on qualitatively distinct corpus regions in language models, with the distinction sharper for reasoning than for knowledge.
2026-06-26 20:33 UTC pith:XSEYM7GX
load-bearing objection The paper maps social versus STEM reasoning to distinct pretraining corpus regions via attribution on a 576-bin taxonomy, with a sharper split at the reasoning level than knowledge, backed by partial unlearning checks. the 2 major comments →
Where Does Social Reasoning Come From? Capability Provenance in Language Models
The pith
A machine-rendered reading of the paper's core claim, the machinery that carries it, and where it could break.
Core claim
Social and STEM reasoning draw on qualitatively distinct corpus regions, and the contrast is sharper at the reasoning level than at the knowledge level. Gradient-based attribution over 576 bins from WebOrganizer's taxonomy, applied to SocialIQA and MMLU Social Sciences versus ARC-Challenge and MMLU STEM, identifies the supporting regions, with partial validation from machine unlearning of high-attribution bins.
What carries the argument
Gradient-based training-data attribution scores aggregated across 576 bins defined by a 24-format by 24-topic taxonomy
Load-bearing premise
Gradient-based attribution scores accurately capture the causal influence of specific corpus bins on benchmark performance rather than merely correlating with surface features of the documents or benchmarks.
What would settle it
If targeted unlearning of high-attribution bins for SocialIQA degrades its performance no more than random unlearning from the same bins, the claim that those bins specifically support the capability would not hold.
Editorial analysis
A structured set of objections, weighed in public.
Referee Report
Summary. The paper claims to use gradient-based training-data attribution (TrackStar via Bergson) aggregated over 576 bins from WebOrganizer's taxonomy on the Dolma3 corpus to identify distinct corpus regions supporting social versus STEM reasoning in OLMo3-7B. Through a 2x2 benchmark design (SocialIQA and MMLU Social Sciences vs. ARC-Challenge and MMLU STEM) contrasting domain and capability type (reasoning vs. knowledge), they conclude that social and STEM reasoning draw on qualitatively distinct corpus regions with sharper contrasts at the reasoning level. Targeted unlearning on high-attribution bins provides partial causal validation, with all code and artifacts open-sourced.
Significance. If the attribution method successfully isolates causal corpus contributions to reasoning capabilities rather than surface correlations, this would represent a significant advance in capability provenance for language models, offering insights into how different reasoning types are supported by pretraining data and potentially guiding future data curation. The open-sourcing of the bin-level influence matrix and unlearning checkpoints is a notable strength for reproducibility.
major comments (2)
- [Abstract] Abstract: the claim that 'the contrast is sharper at the reasoning level than at the knowledge level' is presented as a central result, yet the provided description contains no quantitative comparison, effect size, or statistical test supporting the 'sharper' qualifier; this is load-bearing for the headline distinction between reasoning and knowledge.
- [Unlearning validation] Unlearning validation: the description states that 'forgetting high-attribution topic bins degrades the aligned benchmark more than within-bin random baselines,' but the stress-test concern is not addressed—namely that within-bin random baselines do not control for surface-feature or lexical similarity between bins and benchmarks, leaving the causal interpretation of TrackStar/Bergson scores vulnerable since unlearning occurs post-training.
minor comments (2)
- [Abstract] Abstract: the 2x2 design is described with benchmark pairs but would be clearer if the four specific benchmarks were enumerated explicitly.
- [Overall] Overall: the open-sourcing of sampling manifests, the bin-level influence matrix, and unlearning checkpoints is a strength that could be emphasized in the abstract or conclusion.
Simulated Author's Rebuttal
We thank the referee for the constructive comments. We agree that the abstract requires quantitative support for the central claim and that the unlearning section should explicitly discuss limitations of the baseline. We will revise accordingly while preserving the paper's framing of the unlearning results as partial validation.
read point-by-point responses
-
Referee: [Abstract] Abstract: the claim that 'the contrast is sharper at the reasoning level than at the knowledge level' is presented as a central result, yet the provided description contains no quantitative comparison, effect size, or statistical test supporting the 'sharper' qualifier; this is load-bearing for the headline distinction between reasoning and knowledge.
Authors: We agree that the abstract should include quantitative support. The full manuscript reports attribution contrasts via metrics such as top-bin overlap (Jaccard index 0.18 for reasoning pairs vs. 0.55 for knowledge pairs) and distribution divergence. We will revise the abstract to incorporate a concise quantitative statement with effect size and significance, e.g., 'with Jaccard overlap of top-10 bins 0.18 vs. 0.55 (p < 0.01)'. revision: yes
-
Referee: [Unlearning validation] Unlearning validation: the description states that 'forgetting high-attribution topic bins degrades the aligned benchmark more than within-bin random baselines,' but the stress-test concern is not addressed—namely that within-bin random baselines do not control for surface-feature or lexical similarity between bins and benchmarks, leaving the causal interpretation of TrackStar/Bergson scores vulnerable since unlearning occurs post-training.
Authors: We acknowledge the limitation: the within-bin random baseline controls for topic/format but does not explicitly match lexical or surface features across bins. We will add a discussion paragraph noting this and that the taxonomy grouping mitigates some confounds, while reiterating the post-training unlearning is presented only as partial validation. A stronger cross-bin lexical-matched baseline would require additional experiments beyond the current scope. revision: partial
Circularity Check
No circularity; empirical attribution and unlearning results are observational
full rationale
The paper computes gradient-based attributions (TrackStar via Bergson) over Dolma3 bins, aggregates them into a 576-bin taxonomy, and reports 2x2 contrasts between social/STEM and reasoning/knowledge benchmarks. These are direct empirical measurements, not predictions derived from fitted parameters or self-referential definitions. Targeted unlearning on high-attribution bins provides an independent check against random baselines. No load-bearing step reduces by the paper's own equations or self-citations to its inputs; the central claim remains an observational finding about distinct corpus regions.
Axiom & Free-Parameter Ledger
axioms (1)
- domain assumption Gradient-based attribution (TrackStar) correctly identifies training documents that influence model predictions on the chosen benchmarks.
read the original abstract
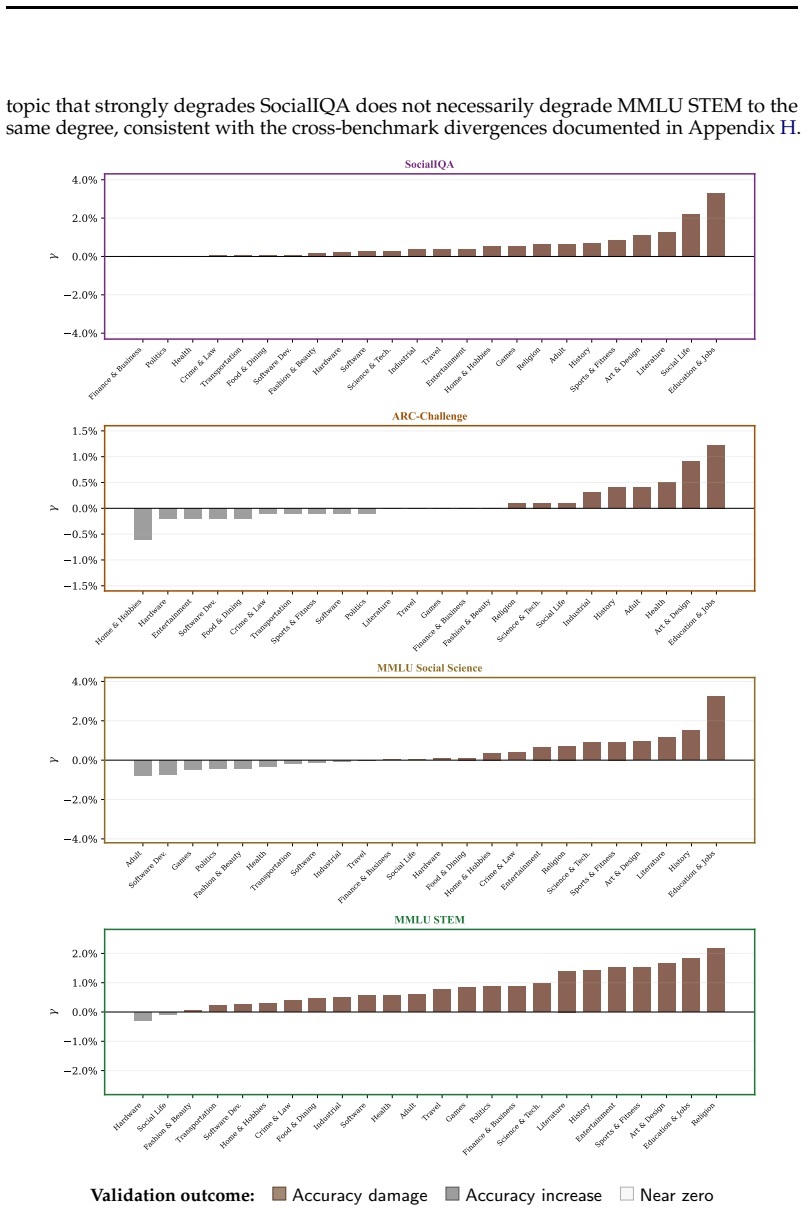
We use training-data attribution as an interpretable tool for capability discovery, mapping which regions of the pretraining corpus support social-reasoning versus STEM-reasoning in OLMo3-7B. Training-data attribution measures how strongly each training document influences a model's predictions on a benchmark, but document-level scores are too noisy to identify which corpus regions support which capabilities, and prior work has emphasized factual knowledge rather than reasoning. We compute gradient-based attribution (TrackStar via Bergson) over a working set drawn from the de-duplicated Dolma3 mix, aggregate influence across WebOrganizer's 24-format x 24-topic taxonomy (576 bins), and contrast benchmark pairs in a 2x2 design that varies domain (social vs. STEM) and capability type (reasoning vs. knowledge): SocialIQA and MMLU Social Sciences against ARC-Challenge and MMLU STEM. Social and STEM reasoning draw on qualitatively distinct corpus regions, and the contrast is sharper at the reasoning level than at the knowledge level. Targeted machine unlearning provides partial causal validation: forgetting high-attribution topic bins (e.g., Literature for SocialIQA) degrades the aligned benchmark more than within-bin random baselines, and we open-source all code, sampling manifests, the bin-level influence matrix, and unlearning checkpoints.
Figures






Reference graph
Works this paper leans on
-
[1]
Association for Computational Linguistics, December 2022. doi: 10.18653/v1/2022. findings-emnlp.180. Antonis Antoniades, Xinyi Wang, Yanai Elazar, Alfonso Amayuelas, Alon Albalak, Kexun Zhang, and William Yang Wang. Generalization vs. Memorization: Tracing Language Models’ Capabilities Back to Pretraining Data. InICML 2024 Workshop on Foundation Models in...
-
[2]
as implemented in Bergson. TrackStar projects per-example gradients into a low- dimensional space using Rademacher random projections and computes influence as s(j,i) = ∑ k∈K ˆgk(xj)⊤ ˆgk(qi), where ˆgk(·) is the unit-normalized projected gradient at module k. §C.5 describes the mixed preconditioner used in practice; the unpreconditioned form above is ret...
2019
-
[3]
Build a value preconditioner from 100K random training documents
-
[4]
Build a query preconditioner from evaluation queries
-
[5]
this bin mattered
Combine with 1,000-component downweighting. Exploratory runs skip preconditioning; all reported results include it. We also com- puted Base-query variants as calibration checks; the reported figures and tables use the Base-document/Instruct-query setup because the Instruct checkpoint follows the OLMES prompts more reliably. C.6 Pipeline Architecture The p...
2025
-
[6]
This pre- serves the token frequency distribution but destroys semantic and logical structure
Baseline Computation:For each document in DF, we generate a randomized version by splitting the token sequence into segments and shuffling them. This pre- serves the token frequency distribution but destroys semantic and logical structure
-
[7]
Target Perplexity (PPL target ):We calculate the original model’s perplexity on this randomizedD F
-
[8]
Termination:Unlearning stops when the current model’s perplexity on the original (unshuffled) forget set reaches or exceedsPPL target . Additionally, we apply a safety guard: if the model’s performance on a held-out MMLU subset drops below 90% of the baseline, or if the process reaches 5,000 steps, training terminates immediately. I.4 Experimental Conditi...
-
[9]
2a. Training gradient index(20 ,000 GPU-hr): per-document gradients for the 5,678,621-document stratified working set (316 shards × 17,996 docs), built once on H100 80 GB and H200 144 GB across two HPC allocations
-
[10]
2b. Query gradient indexes(20 GPU-hr): model-specific query gradient indexes for SocialIQA, MMLU Social Sciences, ARC-Challenge, and MMLU STEM, including the instruct-query builds used for reported two-model scoring
-
[11]
2c. Preconditioner construction(192 GPU-hr): TrackStar mixed preconditioner artifacts for the reported scoring runs, with base-side curvature serving as the pretraining-data metric and supervised-instruction-tuning curvature treated as iden- tity. This identity treatment is a modeling approximation that keeps the reported metric anchored to pretraining-da...
-
[12]
2d. Calibration and exploratory runs(1 ,500 GPU-hr): smoke tests, calibration base- lines (156.1 GPU-hr without preconditioning), and preconditioner-hyperparameter sweeps that informed the final pipeline
-
[13]
Production scoring (CPU): each benchmark-vs-index scoring pass runs as a parallel CPU array, so no GPU-hours apply to this stage
2e. Production scoring (CPU): each benchmark-vs-index scoring pass runs as a parallel CPU array, so no GPU-hours apply to this stage. Training index storage.The gradient index requires ∼8 KB per document. For the working set (5,678,621 documents), this is∼44 GB. L.3 Unlearning Experiments Each single-bin unlearning run trains for up to 5,000 steps on a si...
-
[14]
Training indexGradient build (one-time index reuse)H100 80 GB / H200 144 GB 20,000 20,0002b
Enrichment WebOrganizer classifiers H200/H100/RTX PRO 6000/L40S/V100/RTX 600010,000 8,000 2a. Training indexGradient build (one-time index reuse)H100 80 GB / H200 144 GB 20,000 20,0002b. Query indexes 6 benchmarks (base + instruct) H100 80 GB 20 202c. Preconditioner 2×FSDP build (base + instruct) 8×H100 80 GB 192 1922d. Calibration / smoke Exploratory + s...
-
[15]
Unlearning NGDiff sweep + eval passesH200 144 GB 6,000 6,000
-
[16]
Evaluation OLMES + per-checkpoint evalsH200/H100, L40S/A40 fallback 600 500 Total 40,000 37,000 Limitations and Responsible Release Approximate attribution, not exact counterfactual tracing.Training-data attribution pro- vides an analytic lens, not an exact proof of causal necessity for individual documents. Influence-style methods are approximate and can...
2021
discussion (0)
Sign in with ORCID, Apple, or X to comment. Anyone can read and Pith papers without signing in.