Step-scan interferometry for high-fidelity hyperspectral nanoscopy
Pith reviewed 2026-05-21 04:01 UTC · model grok-4.3
The pith
Step-scan interferometry combined with image registration corrects thermal drifts to deliver higher spatial fidelity in nano-FTIR hyperspectral imaging.
A machine-rendered reading of the paper's core claim, the machinery that carries it, and where it could break.
Core claim
The central claim is that a nano-FTIR methodology based on step-scan interferometry and image registration supplies superior spatial fidelity compared with conventional continuous-scan implementations, because it removes the dominant thermal positioning artifacts without introducing new spectral or spatial distortions and thereby supports collection of larger hyperspectral image sets.
What carries the argument
Step-scan interferometry, which records infrared spectra at fixed discrete positions rather than during continuous motion, paired with subsequent image registration to compensate for residual thermal drift.
If this is right
- Longer or higher-density hyperspectral acquisitions become feasible without progressive loss of spatial accuracy.
- Machine-learning characterization of nanoscale material heterogeneity can now be applied to statistically meaningful data volumes.
- Photonics and composite-material studies gain a more reliable route to mapping local optical responses at the nanoscale.
- Existing nano-FTIR instruments can be retrofitted with the new acquisition sequence and software correction rather than requiring new hardware.
Where Pith is reading between the lines
- The same registration step might be adapted to other scanning-probe spectroscopies that accumulate drift over time.
- Larger, cleaner datasets would increase the statistical power for detecting rare or weakly varying nanoscale features.
- If registration can be made fast enough, the method could support near-real-time feedback during experimental campaigns.
Load-bearing premise
Thermal instabilities are the main source of positioning artifacts in existing nano-FTIR work, and the step-scan plus registration correction removes them without creating fresh spectral or spatial errors.
What would settle it
A side-by-side test in which registered step-scan images show the same or larger residual alignment errors across scan duration, or display spectral line-shape changes absent from standard continuous-scan data, would falsify the central claim.
Figures


read the original abstract
Fourier transform infrared nanospectroscopy (nano-FTIR) is a novel, increasingly adopted characterization method that leverages decades of established knowledge in infrared spectroscopy at the nanoscale. It opens up new possibilities in the characterization of composite materials and nanophotonic systems. Besides the rapid adoption and new possibilities, the nanoscale nature of these measurements poses new challenges for infrared spectroscopy. The current implementations of hyperspectral image acquisition at high spatial resolution suffer from significant artifacts due to thermal instabilities, which heavily affect positioning. As a result, the spatial and spectral fidelity of the measurements can be unreliable for long acquisitions. Here, we propose a new nano-FTIR measurement methodology based on step-scan interferometry and image registration. We demonstrate that the method provides superior spatial fidelity for photonics research and enables the collection of larger datasets, paving the way for bringing machine learning to characterize nanoscale heterogeneity.
Editorial analysis
A structured set of objections, weighed in public.
Referee Report
Summary. The manuscript proposes a step-scan interferometry methodology combined with post-acquisition image registration for nano-FTIR hyperspectral imaging. It addresses thermal instabilities that cause positioning artifacts during long acquisitions, claiming this yields superior spatial fidelity, reduced spectral distortions, and the ability to collect larger datasets suitable for machine learning analysis of nanoscale heterogeneity in composite materials and nanophotonic systems.
Significance. If the central demonstration holds, the work could meaningfully advance nano-FTIR by mitigating a known practical limitation (thermal drift in high-resolution scans), enabling more reliable hyperspectral data over extended times. This would support larger-scale studies and integration with data-driven methods for characterizing nanoscale variations, building on established interferometry principles in a targeted experimental refinement.
major comments (2)
- [§4.3, Figure 6] §4.3, Figure 6: The spatial fidelity comparison reports a reduction in positioning variance from 12 nm to 3 nm RMS, but the analysis uses only three representative scans without statistical testing across a broader sample set or error propagation from registration; this weakens the load-bearing claim of 'superior fidelity' for general photonics applications.
- [§5.1] §5.1: The assertion that step-scan plus registration introduces no new spectral distortions is supported by qualitative line profiles but lacks a quantitative metric (e.g., FWHM variation or peak-shift statistics) comparing registered vs. unregistered spectra across the full hyperspectral cube; this is central to validating the method's net benefit.
minor comments (3)
- [Abstract] Abstract: The claim of 'superior spatial fidelity' would be strengthened by including one concrete quantitative improvement (e.g., 'X% reduction in drift-induced error') rather than remaining purely qualitative.
- [Figure 4] Figure 4: Axis labels and color-bar units are inconsistent between panels (a) and (b); clarify whether intensity is normalized or absolute to aid direct visual comparison.
- [Methods] Methods section: The image registration algorithm parameters (e.g., reference frame selection, correlation threshold) are described at a high level; adding pseudocode or a brief parameter table would improve reproducibility.
Simulated Author's Rebuttal
We thank the referee for their constructive review and recommendation for minor revision. The comments highlight important aspects of statistical robustness and quantitative validation that will improve the manuscript. We address each major comment below and outline the revisions we will make.
read point-by-point responses
-
Referee: [§4.3, Figure 6] The spatial fidelity comparison reports a reduction in positioning variance from 12 nm to 3 nm RMS, but the analysis uses only three representative scans without statistical testing across a broader sample set or error propagation from registration; this weakens the load-bearing claim of 'superior fidelity' for general photonics applications.
Authors: We appreciate the referee's observation on the limited scope of the spatial fidelity analysis. The three scans in Figure 6 were chosen as representative cases to illustrate the method's performance under typical experimental conditions. We agree that broader statistical support would strengthen the claim. In the revised manuscript, we will expand the dataset to include at least ten independent scans, report mean RMS values with standard deviations, and apply appropriate statistical tests (e.g., paired t-test) to confirm the significance of the variance reduction from 12 nm to 3 nm. We will also add a short discussion of registration error propagation based on the algorithm's convergence metrics. revision: yes
-
Referee: [§5.1] The assertion that step-scan plus registration introduces no new spectral distortions is supported by qualitative line profiles but lacks a quantitative metric (e.g., FWHM variation or peak-shift statistics) comparing registered vs. unregistered spectra across the full hyperspectral cube; this is central to validating the method's net benefit.
Authors: We thank the referee for this valuable suggestion regarding quantitative spectral validation. The line profiles in §5.1 were intended to demonstrate that major spectral features are preserved after registration. To provide a more rigorous demonstration, we will include in the revised manuscript quantitative metrics computed over the full hyperspectral cube: specifically, histograms and mean values of peak-position shifts (in cm⁻¹) and FWHM variations for key vibrational bands, comparing registered and unregistered data. These additions will quantitatively support the claim that the combined step-scan and registration approach does not introduce measurable spectral distortions. revision: yes
Circularity Check
No significant circularity detected
full rationale
The paper proposes an experimental methodology using step-scan interferometry combined with post-acquisition image registration to mitigate thermal positioning artifacts in nano-FTIR hyperspectral imaging. It draws on established interferometry principles and standard image registration techniques without presenting a mathematical derivation chain, fitted parameters, or self-referential definitions that reduce claims to their own inputs. The abstract and approach description emphasize practical demonstration of improved spatial fidelity through experimental means rather than any closed-loop prediction or uniqueness theorem imported from prior self-citations. No load-bearing steps reduce by construction to the inputs, making the central claim self-contained against external benchmarks of known thermal drift issues in long scans.
Axiom & Free-Parameter Ledger
axioms (1)
- domain assumption Established principles of Fourier transform infrared spectroscopy apply at the nanoscale.
Reference graph
Works this paper leans on
-
[1]
Binnig, G.; Quate, C. F.; Gerber, C. Atomic force microscope. Phys. Rev. Lett. 1986, 56, 930–933
work page 1986
-
[2]
Nonnenmacher, M.; O’Boyle, M. P.; Wickramasinghe, H. K. Kelvin pro be force mi- croscopy. Appl. Phys. Lett. 1991, 58, 2921–2923
work page 1991
-
[3]
Martin, Y.; Wickramasinghe, H. K. Magnetic imaging by “force micro scopy” with 1000 ˚ A resolution. Appl. Phys. Lett. 1987-05-18, 50, 1455–1457
work page 1987
-
[4]
S´ aenz, J. J.; Garc ´ ıa, N.; Gr¨ utter, P.; Meyer, E.; Heinzelmann, H.; Wiesendanger, R.; Rosenthaler, L.; Hidber, H. R.; G¨ untherodt, H. J. Observation of magnetic forces by the atomic force microscope. J. Appl. Phys. 1987, 62, 4293–4295
work page 1987
-
[5]
Progress in Optics ; Progress in optics; Elsevier, 2007; Vol
Novotny, L. Progress in Optics ; Progress in optics; Elsevier, 2007; Vol. 50; pp 137–184. 22
work page 2007
-
[6]
Degenhardt, J.; Tutsch, R.; Dai, G. Correction method for 3D no n-linear drift distortions in atomic force microscopy raster measurements. Measurement Science and Technology 2022, 34, 025001
work page 2022
-
[7]
Synge, E. H. XXXVIII. A suggested method for extending micro scopic resolution into the ultra-microscopic region. The London, Edinburgh, and Dublin Philosophical Magazine and Journal of Science 1928, 6, 356–362
work page 1928
-
[8]
Hillenbrand, R.; Abate, Y.; Liu, M.; Chen, X.; Basov, D. N. Visible-to- THz near-field nanoscopy. Nat. Rev. Mater. 2025, 10, 285–310
work page 2025
-
[9]
Enhanced dielectric contrast in scattering- type scanning near- field optical microscopy
Knoll, B.; Keilmann, F. Enhanced dielectric contrast in scattering- type scanning near- field optical microscopy. Optics Communications 2000, 182, 321–328
work page 2000
-
[10]
Pseudoheterodyne detect ion for background-free near-field spectroscopy
Ocelic, N.; Huber, A.; Hillenbrand, R. Pseudoheterodyne detect ion for background-free near-field spectroscopy. Applied Physics Letters 2006, 89, 101124
work page 2006
-
[11]
Nano-FTIR Absorption Spectroscopy of Molecular Fingerprints at 20 nm Spatial Reso- lution
Huth, F.; Govyadinov, A.; Amarie, S.; Nuansing, W.; Keilmann, F.; Hille nbrand, R. Nano-FTIR Absorption Spectroscopy of Molecular Fingerprints at 20 nm Spatial Reso- lution. Nano Letters 2012, 12, 3973–3978, PMID: 22703339
work page 2012
-
[12]
Dazzi, A.; Prazeres, R.; Glotin, F.; Ortega, J. M. Local infrared microspectroscopy with subwavelength spatial resolution with an atomic force microsco pe tip used as a photothermal sensor. Opt. Lett. 2005, 30, 2388–2390
work page 2005
-
[13]
N´ emeth, G.; Bechtel, H. A.; Borondics, F. Origins and conseque nces of asymmetric nano-FTIR interferograms. Opt. Express 2024, 32, 15280–15294
work page 2024
-
[14]
Bechtel, H. A.; Muller, E. A.; Olmon, R. L.; Martin, M. C.; Raschke, M . B. Ultra- broadband infrared nanospectroscopic imaging. Proceedings of the National Academy of Sciences 2014, 111, 7191–7196. 23
work page 2014
-
[15]
Infrared nanospectroscopy and hyperspect ral nanoimaging of organic mat- ter
Amenabar, I. Infrared nanospectroscopy and hyperspect ral nanoimaging of organic mat- ter. Ph.D. thesis, University of the Basque Country, 2017
work page 2017
-
[16]
Donaldson, P. M.; Kelley, C. S.; Frogley, M. D.; Filik, J.; Wehbe, K.; Cin que, G. Broad- band near-field infrared spectromicroscopy using photothermal probes and synchrotron radiation. Opt. Express 2016, 24, 1852–1864
work page 2016
-
[17]
Manning, C. J.; Griffiths, P. R. Step-Scanning Interferometer with Digital Signal Pro- cessing. Appl. Spectrosc. 1993, 47, 1345–1349
work page 1993
-
[18]
Griffiths, P. R.; de Haseth, J. A. Fourier Transform Infrared Spectrometry; John Wiley & Sons, Ltd, 2007; Chapter 7, pp 161–175
work page 2007
-
[19]
Manning, C. J.; Griffiths, P. R. Noise Sources in Step-Scan FT-IR Spectrometry. Applied Spectroscopy 1997, 51, 1092–1101
work page 1997
-
[20]
Basov, D. N.; Fogler, M. M.; de Abajo, F. J. G. Polaritons in van de r Waals materials. Science 2016, 354, aag1992
work page 2016
-
[21]
N.; Asenjo-Garcia, A.; Schuck, P
Basov, D. N.; Asenjo-Garcia, A.; Schuck, P. J.; Zhu, X.; Rubio, A . Polariton panorama. Nanophotonics 2021, 10, 549–577
work page 2021
-
[22]
Dai, S.; Fei, Z.; Ma, Q.; Rodin, A. S.; Wagner, M.; McLeod, A. S.; Liu, M . K.; Gan- nett, W.; Regan, W.; Watanabe, K.; Taniguchi, T.; Thiemens, M.; Doming uez, G.; Neto, A. H. C.; Zettl, A.; Keilmann, F.; Jarillo-Herrero, P.; Fogler, M. M .; Basov, D. N. Tunable Phonon Polaritons in Atomically Thin van der Waals Crystals of B oron Nitride. Science 2014, ...
work page 2014
-
[23]
Dolado, I.; Maciel-Escudero, C.; Nikulina, E.; Modin, E.; Calavalle, F.; Chen, S.; Bylinkin, A.; Alfaro-Mozaz, F. J.; Li, J.; Edgar, J. H.; Casanova, F.; V´ elez, S.; Hueso, L. E.; Esteban, R.; Aizpurua, J.; Hillenbrand, R. Remote near -field spectroscopy 24 of vibrational strong coupling between organic molecules and phono nic nanoresonators. Nature Commu...
work page 2022
-
[24]
Ma, W.; Alonso-Gonz´ alez, P.; Li, S.; Nikitin, A. Y.; Yuan, J.; Mart ´ ın -S´ anchez, J.; Taboada-Guti´ errez, J.; Amenabar, I.; Li, P.; V´ elez, S.; Tollan, C.; Dai, Z.; Zhang, Y.; Sriram, S.; Kalantar-Zadeh, K.; Lee, S.-T.; Hillenbrand, R.; Bao, Q. In -plane anisotropic and ultra-low-loss polaritons in a natural van der Waals crystal. Nature 2018, 562,...
work page 2018
-
[25]
Shi, Z.; Hong, X.; Bechtel, H. A.; Zeng, B.; Martin, M. C.; Watanabe , K.; Taniguchi, T.; Shen, Y.-R.; Wang, F. Observation of a Luttinger-liquid plasmon in met allic single-walled carbon nanotubes. Nature Photonics 2015, 9, 515–519
work page 2015
-
[26]
N´ emeth, G.; Otsuka, K.; Datz, D.; Pekker,´A.; Maruyama, S.; Borondics, F.; Kamar´ as, K. Direct Visualization of Ultrastrong Coupling between Luttinger-Liqu id Plasmons and Phonon Polaritons. Nano Letters 2022, 22, 3495–3502
work page 2022
-
[27]
Wang, S.; Wu, F.; Watanabe, K.; Taniguchi, T.; Zhou, C.; Wang, F. M etallic Car- bon Nanotube Nanocavities as Ultracompact and Low-loss Fabry–P erot Plasmonic Res- onators. Nano Letters 2020, 20, 2695–2702
work page 2020
-
[28]
Impro ving Luttinger- liquid plasmons in carbon nanotubes by chemical doping
Tian, X.; Gu, Q.; Duan, J.; Chen, R.; Liu, H.; Hou, Y.; Chen, J. Impro ving Luttinger- liquid plasmons in carbon nanotubes by chemical doping. Nanoscale 2018, 10, 6288– 6293
work page 2018
-
[29]
N.; Retho, M.; Manach, S.; Zoffoli, M
Mertens, K. N.; Retho, M.; Manach, S.; Zoffoli, M. L.; Doner, A.; Sc hapira, M.; Bilien, G.; S´ echet, V.; Lacour, T.; Robert, E.; Duval, A.; Terre-Terrillon, A.; Derrien, A.; Gernez, P. An unprecedented bloom of Lingulodinium polyedra on the French Atlantic coast during summer 2021. Harmful Algae 2023, 125, 102426
work page 2021
-
[30]
Dagenais Bellefeuille, S.; Dorion, S.; Rivoal, J.; Morse, D. The Dinofla gellate Lingulo- 25 dinium polyedrum Responds to N Depletion by a Polarized Deposition of S tarch and Lipid Bodies. PLOS ONE 2014, 9, 1–10
work page 2014
-
[31]
Head, M. J.; Mertens, K.; Fensome, R. A. Dual nomenclature in o rganic-walled dinoflag- ellate cysts I: concepts, methods and applications. Palynology 2024, 48, 2290200 (26p.)
work page 2024
-
[32]
M.; Vac cari, L.; Demˇ sar, J.; Borondics, F
Toplak, M.; Birarda, G.; Read, S.; Sandt, C.; Rosendahl, S. M.; Vac cari, L.; Demˇ sar, J.; Borondics, F. Infrared orange: Connecting hyperspectral dat a with machine learning. Synchrotron Radiat. News 2017, 30, 40–45
work page 2017
-
[33]
Toplak, M.; Read, S. T.; Sandt, C.; Borondics, F. Quasar: Easy m achine learning for biospectroscopy. Cells 2021, 10, 2300
work page 2021
-
[34]
Hinton, G. E.; Roweis, S. Stochastic Neighbor Embedding. Advan ces in Neural Informa- tion Processing Systems. 2002
work page 2002
-
[35]
Marxer, F.; Gallego, M.; Sanchez-Cano, C.; Wrobel, T. P.; Parak, W. J.; Hillenbrand, R.; Schnell, M. Infrared Nano-Spectroscopy of Single Cell Sections at the Ultrastructural Level. Nanophotonics 2026, 15, e70056
work page 2026
-
[36]
Protein clustering in chemically stressed HeLa cells studied b y infrared nanospec- troscopy
Giliberti, V.; Baldassarre, L.; Rosa, A.; de Turris, V.; Ortolani, M.; C alvani, P.; Nu- cara, A. Protein clustering in chemically stressed HeLa cells studied b y infrared nanospec- troscopy. Nanoscale 2016, 8, 17560–17567
work page 2016
-
[37]
Greaves, G. E.; Kiryushko, D.; Auner, H. W.; Porter, A. E.; Phillips , C. C. Label-free nanoscale mapping of intracellular organelle chemistry. Communications Biology 2023, 6, 583
work page 2023
-
[38]
de Carvalho, L. A. E. B.; Cinque, G.; de Carvalho, A. L. M. B.; Marq ues, J.; Frog- ley, M. D.; Vondracek, H.; Marques, M. P. M. Synchrotron nano-FT IR spectroscopy for probing anticancer drugs at subcellular scale. Scientific Reports 2024, 14, 17166. 26
work page 2024
-
[39]
Kanevche, K.; Burr, D. J.; N¨ urnberg, D. J.; Hass, P. K.; Elsaes ser, A.; Heberle, J. Infrared nanoscopy and tomography of intracellular structures . Communications Biology 2021, 4, 1341
work page 2021
-
[40]
Jupyter notebooks and Example wor kflow for step-scan nano- FTIR data processing
Nemeth, G.; Borondics, F. Jupyter notebooks and Example wor kflow for step-scan nano- FTIR data processing. 2026; https://github.com/smis-soleil/stepscan-paper
work page 2026
-
[41]
Aghamiri, N. A.; Huth, F.; Huber, A. J.; Fali, A.; Hillenbrand, R.; Abat e, Y. Hyper- spectral time-domain terahertz nano-imaging. Opt. Express 2019, 27, 24231–24242
work page 2019
-
[42]
Esses, B. L.; Sandner, D.; McKee, P. A.; Wilcken, R.; Nishida, J.; Pu ro, R. L.; Raschke, M. B. Ultrafast nano-imaging and nano-spectroscopy. Nature Reviews Methods Primers 2026, 6, 21
work page 2026
-
[43]
Identifi- cation of weak molecular absorption in single-wavelength s-SNOM imag es
Niehues, I.; Mester, L.; Vicentini, E.; Wigger, D.; Schnell, M.; Hillenbr and, R. Identifi- cation of weak molecular absorption in single-wavelength s-SNOM imag es. Opt. Express 2023, 31, 7012–7022
work page 2023
-
[44]
M.; Hillenbrand, R.; Schnell, M
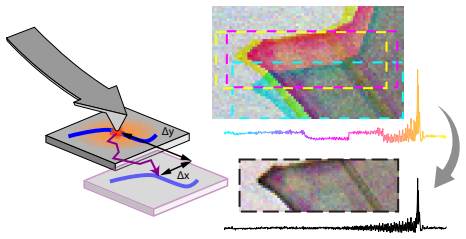
Vicentini, E.; Nuansing, W.; Niehues, I.; Amenabar, I.; Bittner, A. M.; Hillenbrand, R.; Schnell, M. Pseudoheterodyne interferometry for multicolor near -field imaging. Opt. Ex- press 2023, 31, 22308–22322. 27 Δy Δx Figure 10: For Table of Contents Only 28
work page 2023
discussion (0)
Sign in with ORCID, Apple, or X to comment. Anyone can read and Pith papers without signing in.