Inflowing Gas in the Central Parsec of M81
Pith reviewed 2026-05-25 17:02 UTC · model grok-4.3
The pith
The central parsec of M81 holds about 500 solar masses of low-metallicity gas flowing inward to feed the nucleus for the next 100,000 years.
A machine-rendered reading of the paper's core claim, the machinery that carries it, and where it could break.
Core claim
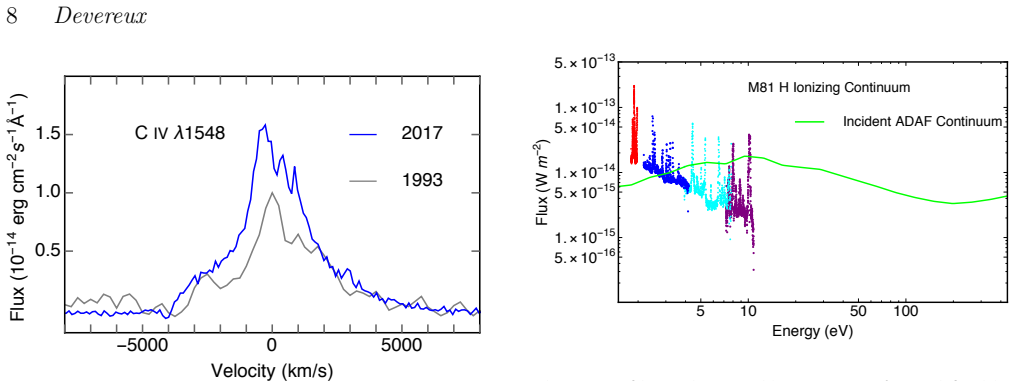
The H+ region contains ~500 M⊙ of low metallicity gas that is dynamically unstable to inflow. At the current rate, the available H+ gas can sustain the advection dominated accretion flow that powers the central UV--X-ray source for 10^5 years. The spectrum shows broad Balmer lines from the H+ region, forbidden lines from denser condensations, and variable CIV emission, understood collectively as a shock excited jet cavity within a large H+ region that is photoionized by the central source.
What carries the argument
The large, highly ionized, low density, low metallicity H+ region producing the broad Balmer lines and containing the inflowing gas.
If this is right
- The H+ region supplies enough gas to sustain the central advection-dominated accretion flow for 10^5 years at the current rate.
- The gas is dynamically unstable to inflow based on the line properties.
- The spectrum arises from three distinct components: the extended H+ region, dense condensations, and the time-variable CIV source.
- The overall structure is a shock-excited jet cavity embedded in the photoionized H+ region.
Where Pith is reading between the lines
- The same inflow process may operate in other nearby low-luminosity active nuclei with similar line spectra.
- The low metallicity implies the gas has not been heavily processed by star formation in the host galaxy.
- The 10^5-year supply time suggests that accretion episodes in such nuclei are finite and may recur when new gas arrives.
Load-bearing premise
The total gas mass of ~500 solar masses and its dynamical instability to inflow are correctly inferred from the observed line luminosities, widths, and ratios, which requires assumptions about volume filling factor, geometry, and that the line-emitting gas traces the bulk of the mass available for accretion.
What would settle it
Higher-resolution spectroscopy or radio mapping that measures the actual total gas mass or inflow velocity and finds values inconsistent with ~500 solar masses or with dynamical instability.
Figures





read the original abstract
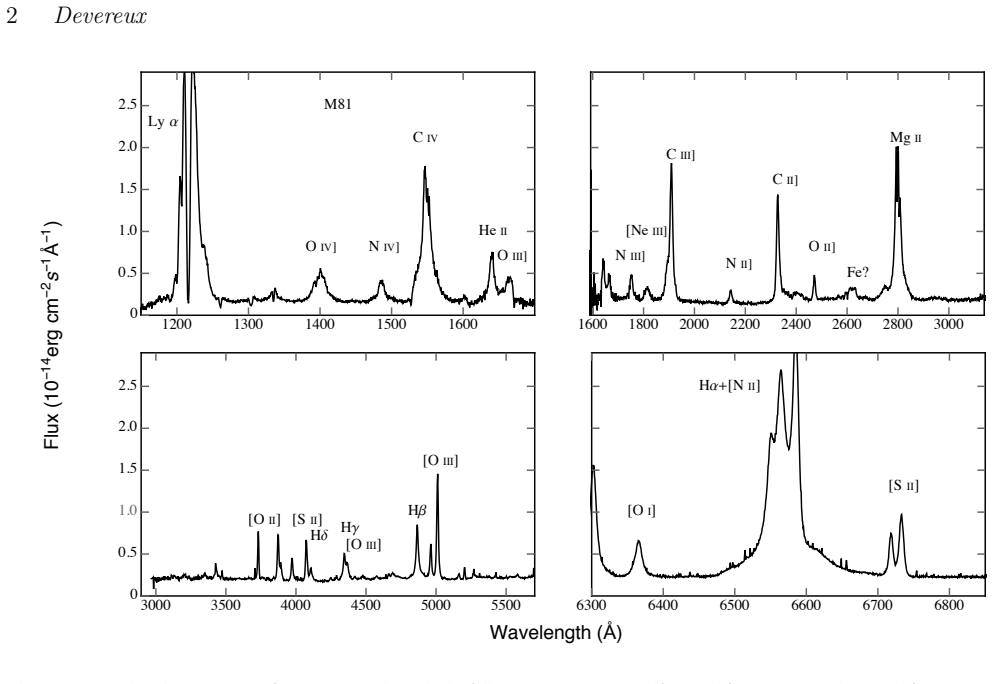
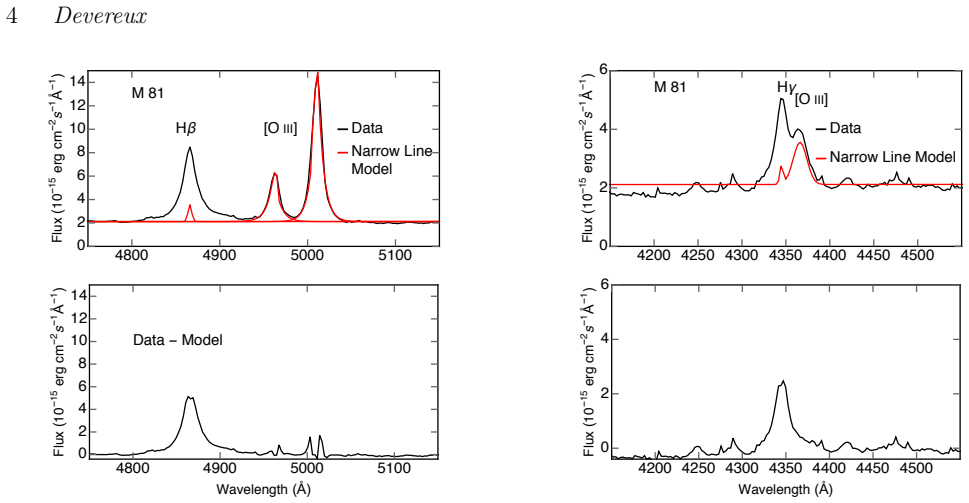
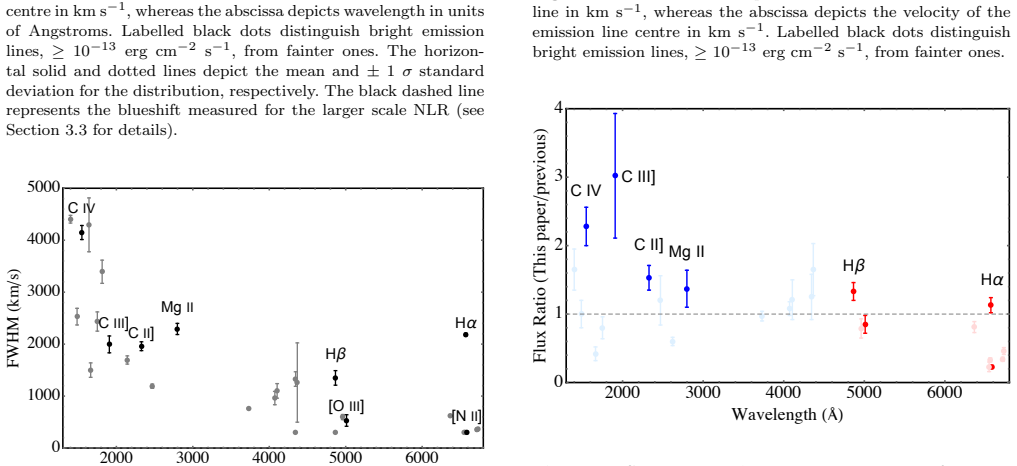
Spectroscopic observations of the Seyfert 1/Liner nucleus of M81, obtained recently with the Space Telescope Imaging Spectrograph (STIS) aboard the Hubble Space Telescope (HST), have revealed a UV--visible spectrum rich with emission lines of a variety of widths, ionization potentials, and critical densities, including several in the UV that have not previously been reported. Even at the highest angular resolution currently achievable with HST, the broad-line region of M81 cannot be uniquely defined on the basis of commonly used observables such as the full-width at half maximum of the emission lines, or ratios of various emission lines. Numerous broad forbidden lines complicate interpretation of the spectra. At least three separate line-emitting components are inferred. A large, highly ionized, low density, low metallicity H${^+}$ region producing the broad Balmer lines. Located within the H${^+}$ region are smaller condensations spanning a wide-range in density, and the source of forbidden line emission through collisional excitation of the respective ions. Intermingled with the H${^+}$ region and the condensations is a curious extended source of time-variable CIV ${\lambda}$ 1548 emission. Collectively, these observations can be qualitatively understood in the context of a shock excited jet cavity within a large H${^+}$ region that is photoionized by the central UV--X-ray source. The H${^+}$ region contains ${\sim}$ 500 M${\odot}$ of low metallicity gas that is dynamically unstable to inflow. At the current rate, the available H${^+}$ gas can sustain the advection dominated accretion flow that powers the central UV--X-ray source for 10$^{5}$ years.
Editorial analysis
A structured set of objections, weighed in public.
Referee Report
Summary. The paper reports HST/STIS UV-visible spectroscopy of the M81 nucleus, identifying at least three distinct line-emitting components within the central parsec: a large, low-density, low-metallicity H+ region producing broad Balmer lines; smaller, higher-density condensations responsible for forbidden-line emission; and an extended, time-variable CIV λ1548 source. The data are interpreted as a shock-excited jet cavity embedded in a photoionized H+ region. The central quantitative claim is that the H+ region contains ~500 M⊙ of gas that is dynamically unstable to inflow and, at the observed accretion rate, can sustain the central advection-dominated accretion flow for 10^5 years.
Significance. If the mass and inflow claims are robustly derived, the work would supply one of the most direct observational constraints on the gas reservoir available to fuel a low-luminosity AGN on parsec scales, with implications for the longevity of ADAF solutions and the connection between nuclear emission-line diagnostics and accretion physics.
major comments (2)
- [Abstract, final paragraph] Abstract (final paragraph) and associated mass derivation: the stated H+ mass of ~500 M⊙ is obtained from broad Balmer line luminosities via M_H+ ∝ L_line / (n_e α f V), yet no measured or bounded value is supplied for the volume filling factor f or the precise 3D geometry that sets V. Because both the mass and the 10^5 yr sustainability timescale scale linearly with f, an order-of-magnitude uncertainty in f directly undermines the headline numbers; the text must either provide an independent constraint on f (e.g., from density-sensitive line ratios or imaging) or propagate the uncertainty explicitly.
- [Abstract, final paragraph] Abstract (final paragraph): the 10^5 yr figure is obtained by dividing the H+ mass by an accretion rate that is itself inferred from the same emission-line data set. This creates a potential circularity that is not resolved by showing that the line-emitting gas is dynamically unstable to inflow; an independent accretion-rate estimate (e.g., from X-ray luminosity or variability) is required to break the dependence.
minor comments (2)
- The abstract states that the broad-line region “cannot be uniquely defined” on the basis of FWHM or line ratios, yet does not quantify how the three-component decomposition was performed or what χ² or residual criteria were used.
- Notation for the H+ region mass should be written consistently (e.g., M_H+ or M_{H^+}) throughout; the abstract mixes ~500 M⊙ with subscript formatting.
Simulated Author's Rebuttal
We thank the referee for the careful and constructive report. The two major comments both concern the quantitative claims in the abstract's final paragraph. We address each below and indicate the revisions we will make.
read point-by-point responses
-
Referee: [Abstract, final paragraph] Abstract (final paragraph) and associated mass derivation: the stated H+ mass of ~500 M⊙ is obtained from broad Balmer line luminosities via M_H+ ∝ L_line / (n_e α f V), yet no measured or bounded value is supplied for the volume filling factor f or the precise 3D geometry that sets V. Because both the mass and the 10^5 yr sustainability timescale scale linearly with f, an order-of-magnitude uncertainty in f directly undermines the headline numbers; the text must either provide an independent constraint on f (e.g., from density-sensitive line ratios or imaging) or propagate the uncertainty explicitly.
Authors: We agree that an explicit treatment of the filling factor is required. The ~500 M⊙ figure in the manuscript is derived under the assumption f ≈ 1 for the spatially extended, low-density H+ component whose volume is set by the STIS slit coverage and the observed spatial extent of the broad Balmer emission. No independent constraint on f from density-sensitive ratios is available for this component (the ratios constrain only the embedded condensations). In the revised manuscript we will (i) state the f = 1 assumption explicitly, (ii) propagate the linear scaling with f into the quoted mass and timescale, and (iii) note that order-of-magnitude changes in f would still leave the gas reservoir sufficient to sustain the ADAF for at least 10^4 yr. The 3D geometry remains an order-of-magnitude estimate based on the slit data; we will add this caveat. revision: yes
-
Referee: [Abstract, final paragraph] Abstract (final paragraph): the 10^5 yr figure is obtained by dividing the H+ mass by an accretion rate that is itself inferred from the same emission-line data set. This creates a potential circularity that is not resolved by showing that the line-emitting gas is dynamically unstable to inflow; an independent accretion-rate estimate (e.g., from X-ray luminosity or variability) is required to break the dependence.
Authors: The accretion rate adopted for the 10^5 yr estimate is taken from the observed nuclear X-ray luminosity and the standard ADAF radiative efficiency for M81; it is not derived from the emission-line luminosities used to obtain the gas mass. The lines supply only the mass and the kinematic evidence for inflow; the continuum luminosity that sets Ṁ is independent. We will revise the text to make this separation explicit and to cite the X-ray/ADAF references used for Ṁ. The dynamical instability argument is presented separately from the numerical timescale and does not rely on the value of Ṁ. revision: yes
Circularity Check
No significant circularity in derivation chain
full rationale
The paper states the H+ region mass of ~500 M⊙ and the 10^5 yr sustainability timescale in the abstract, with the latter obtained by dividing that mass by an accretion rate tied to the observed luminosity of the central UV-X-ray source. No equations, self-citations, or fitted parameters are presented that reduce the claimed mass or timescale to the input line luminosities by construction; the conversion from line data to mass follows standard photoionization scaling with explicit (if uncertain) assumptions on density and filling factor, while the rate is drawn from the separate central continuum source. The derivation therefore remains self-contained against external benchmarks rather than tautological.
Axiom & Free-Parameter Ledger
free parameters (2)
- H+ gas mass =
~500 M_sun
- inflow/accretion rate
axioms (2)
- domain assumption Broad Balmer lines originate from a large, low-density, photoionized H+ region
- domain assumption Line widths and ratios allow reliable inference of total gas mass and dynamical instability to inflow
Reference graph
Works this paper leans on
-
[1]
Baldwin J. A., Phillips M. M., Terlevich R., 1981, @doi [ ] 10.1086/130766 , 93, 5
-
[2]
Balmaverde B., Capetti A., 2014, @doi [ ] 10.1051/0004-6361/201321989 , 563, A119
-
[3]
Barvainis R., 1987, @doi [ ] 10.1086/165571 , 320, 537
-
[4]
F., et al., 1996, @doi [ ] 10.1086/176756 , 457, 604
Bietenholz M. F., et al., 1996, @doi [ ] 10.1086/176756 , 457, 604
-
[5]
Bietenholz M. F., Bartel N., Rupen M. P., 2000, @doi [ ] 10.1086/308623 , 532, 895
-
[6]
Binette L., 1985, A&A, 143, 334
work page 1985
-
[7]
S., Storchi-Bergmann T., 1996, , 312, 365
Binette L., Wilson A. S., Storchi-Bergmann T., 1996, , 312, 365
work page 1996
-
[8]
Bower G., Wilson A., Heckman T., Richstone D. O., 1996, , 111, 1901
work page 1996
-
[9]
G., Peimbert M., Torres-Peimbert S., 1982, @doi [ ] 10.1086/160271 , 260, 495
Bruzual A. G., Peimbert M., Torres-Peimbert S., 1982, @doi [ ] 10.1086/160271 , 260, 495
-
[10]
Cardelli J. A., Clayton G. C., Mathis J. S., 1989, @doi [ ] 10.1086/167900 , 345, 245
-
[11]
P., 1989, @doi [ ] 10.1086/167782 , 344, 115
Chen K., Halpern J. P., 1989, @doi [ ] 10.1086/167782 , 344, 115
-
[12]
Devereux N., 2015, @doi [Journal of Astrophysics and Astronomy] 10.1007/s12036-015-9348-7 , 36, 427
-
[13]
Devereux N., 2018, @doi [ ] 10.1093/mnras/stx2537 , 473, 2930
-
[14]
Devereux N., Shearer A., 2007, @doi [ ] 10.1086/522292 , 671, 118
-
[15]
Devereux N., Ford H., Jacoby G., 1997, @doi [ ] 10.1086/310661 , 481, L71
-
[16]
Devereux N., Ford H., Tsvetanov Z., Jacoby G., 2003, @doi [ ] 10.1086/367595 , 125, 1226
-
[17]
Dimitrijevi \'c M. S., Popovi \'c L. C ., Kova c evi \'c J., Da c i \'c M., Ili \'c D., 2007, @doi [ ] 10.1111/j.1365-2966.2006.11238.x , 374, 1181
-
[18]
Dopita M. A., Sutherland R. S., 1995, @doi [ ] 10.1086/176596 , 455, 468
-
[19]
Dopita M. A., Sutherland R. S., 1996, @doi [ ] 10.1086/192255 , 102, 161
-
[20]
A., et al., 2015, @doi [ ] 10.1088/0004-637X/801/1/42 , 801, 42
Dopita M. A., et al., 2015, @doi [ ] 10.1088/0004-637X/801/1/42 , 801, 42
-
[21]
Feltre Charlot G., 2016, @doi [mnras] 10.1093/mnras/stv2794 , 456, 3354
-
[22]
J., Netzer H., 1983, @doi [ ] 10.1086/160577 , 264, 105
Ferland G. J., Netzer H., 1983, @doi [ ] 10.1086/160577 , 264, 105
-
[23]
Filippenko A. V., Sargent W. L. W., 1988, @doi [ ] 10.1086/165886 , 324, 134
-
[24]
L., et al., 2001, @doi [ ] 10.1086/320638 , 553, 47
Freedman W. L., et al., 2001, @doi [ ] 10.1086/320638 , 553, 47
-
[25]
Halpern J. P., Steiner J. E., 1983, @doi [ ] 10.1086/184051 , 269, L37
- [26]
-
[27]
H., Massari D., Veljanoski J., Brown A
Helmi A., Babusiaux C., Koppelman H. H., Massari D., Veljanoski J., Brown A. G. A., 2018, @doi [ ] 10.1038/s41586-018-0625-x , 563, 85
-
[28]
Ho L. C., Filippenko A. V., Sargent W. L. W., 1996, @doi [ ] 10.1086/177140 , 462, 183
-
[29]
Ishisaki Y., et al., 1996, @doi [ ] 10.1093/pasj/48.2.237 , 48, 237
-
[30]
Kallman T., Bautista M., 2001, @doi [ ] 10.1086/319184 , 133, 221
-
[31]
Kaspi S., Maoz D., Netzer H., Peterson B. M., Vestergaard M., Jannuzi B. T., 2005, @doi [ ] 10.1086/431275 , 629, 61
-
[32]
Kewley L. J., Groves B., Kauffmann G., Heckman T., 2006, @doi [ ] 10.1111/j.1365-2966.2006.10859.x , 372, 961
-
[33]
Komossa S., Schulz H., 1997, , 323, 31
work page 1997
-
[34]
Laor A., 2003, @doi [ ] 10.1086/375008 , 590, 86
-
[35]
Lee H., 2006, @doi [apj] 10.1086/505573 , 647, 970
-
[36]
M., Alberdi A., P \'e rez-Torres M
Mart \' -Vidal I., Marcaide J. M., Alberdi A., P \'e rez-Torres M. A., Ros E., Guirado J. C., 2011, @doi [ ] 10.1051/0004-6361/201117211 , 533, A111
-
[37]
Morse J. A., Raymond J. C., Wilson A. S., 1996, @doi [ ] 10.1086/133744 , 108, 426
-
[38]
Narayan R., Yi I., 1994, @doi [ ] 10.1086/187381 , 428, L13
-
[39]
Narayan R., Yi I., 1995a, @doi [ ] 10.1086/175599 , 444, 231
-
[40]
Narayan R., Yi I., 1995b, @doi [ ] 10.1086/176343 , 452, 710
-
[41]
S., Storchi-Bergmann T., Eracleous M., 2014, @doi [ ] 10.1093/mnras/stt2388 , 438, 2804
Nemmen R. S., Storchi-Bergmann T., Eracleous M., 2014, @doi [ ] 10.1093/mnras/stt2388 , 438, 2804
-
[42]
E., 1989, Astrophysics of gaseous nebulae and active galactic nuclei
Osterbrock D. E., 1989, Astrophysics of gaseous nebulae and active galactic nuclei
work page 1989
-
[43]
Page M. J., Breeveld A. A., Soria R., Wu K., Branduardi-Raymont G., Mason K. O., Starling R. L. C., Zane S., 2003, @doi [ ] 10.1051/0004-6361:20021896 , 400, 145
-
[44]
Peimbert M., Torres-Peimbert S., 1981, , 245, 845
work page 1981
-
[45]
Peterson B. M., et al., 2004, @doi [ ] 10.1086/423269 , 613, 682
work page internal anchor Pith review doi:10.1086/423269 2004
-
[46]
Petre R., Mushotzky R. F., Serlemitsos P. J., Jahoda K., Marshall F. E., 1993, @doi [ ] 10.1086/173424 , 418, 644
-
[47]
Proffitt C., 2010, STIS Instrument Handbook, Version 9.0, (Baltimore, MD : STScI)
work page 2010
-
[48]
Reichert G. A., Puchnarewicz E. M., Filippenko A. V., Mason K. O., Branduardi-Raymont G., Wu C.-C., 1992, in Filippenko A. V., ed., Astronomical Society of the Pacific Conference Series Vol. 31, Relationships Between Active Galactic Nuclei and Starburst Galaxies. p. 277
work page 1992
-
[49]
Ricci T. V., Steiner J. E., Giansante L., 2015, @doi [ ] 10.1051/0004-6361/201425504 , 576, A58
-
[50]
Richardson C. T., Allen J. T., Baldwin J. A., Hewett P. C., Ferland G. J., 2014, @doi [ ] 10.1093/mnras/stt2056 , 437, 2376
-
[51]
Schnorr M \"u ller A., Storchi-Bergmann T., Riffel R. A., Ferrari F., Steiner J. E., Axon D. J., Robinson A., 2011, @doi [ ] 10.1111/j.1365-2966.2010.18116.x , 413, 149
-
[52]
Shull J. M., McKee C. F., 1979, @doi [ ] 10.1086/156712 , 227, 131
-
[53]
Sugai H., et al., 2005, @doi [ ] 10.1086/431544 , 629, 131
-
[54]
E., 1987, @doi [ ] 10.1086/191166 , 63, 295
Veilleux S., Osterbrock D. E., 1987, @doi [ ] 10.1086/191166 , 63, 295
-
[55]
Whittle M., 1992, @doi [ ] 10.1086/191644 , 79, 49
-
[56]
Young A. J., Nowak M. A., Markoff S., Marshall H. L., Canizares C. R., 2007, @doi [ ] 10.1086/521778 , 669, 830
-
[57]
J., McHardy I., Emmanoulopoulos D., Connolly S., 2018, @doi [ ] 10.1093/mnras/sty509 , 476, 5698
Young A. J., McHardy I., Emmanoulopoulos D., Connolly S., 2018, @doi [ ] 10.1093/mnras/sty509 , 476, 5698
discussion (0)
Sign in with ORCID, Apple, or X to comment. Anyone can read and Pith papers without signing in.