Recognition: 2 theorem links
· Lean TheoremA Shocked Wind Interpretation of an Odd Radio Circle
Pith reviewed 2026-05-16 20:30 UTC · model grok-4.3
The pith
The ionized gas around the central galaxy of ORC4 is produced by shocks from the event that formed its large radio ring.
A machine-rendered reading of the paper's core claim, the machinery that carries it, and where it could break.
Core claim
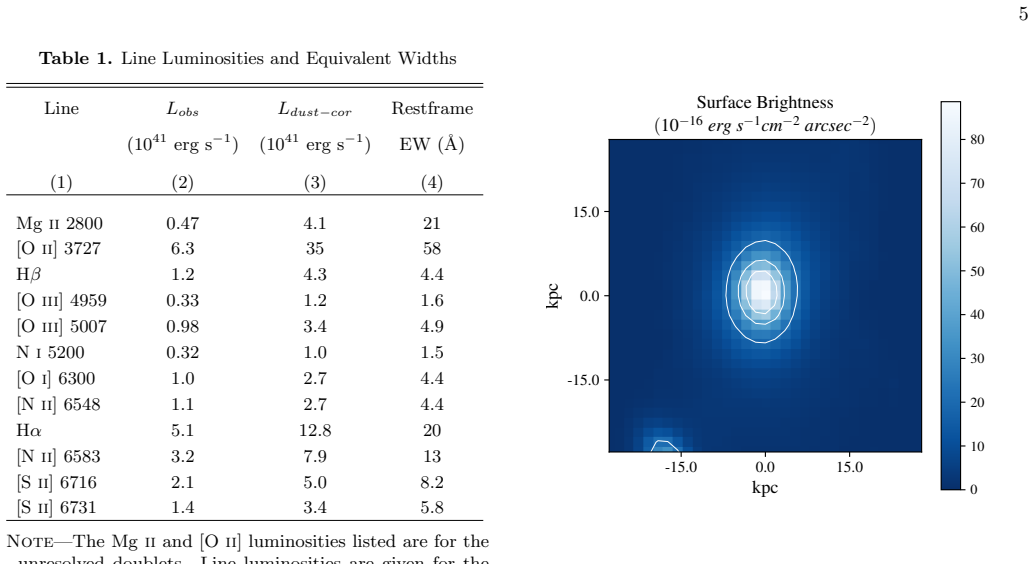
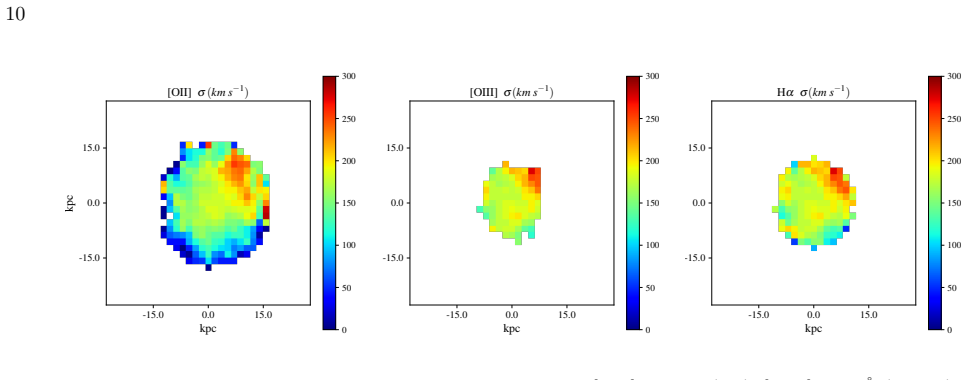
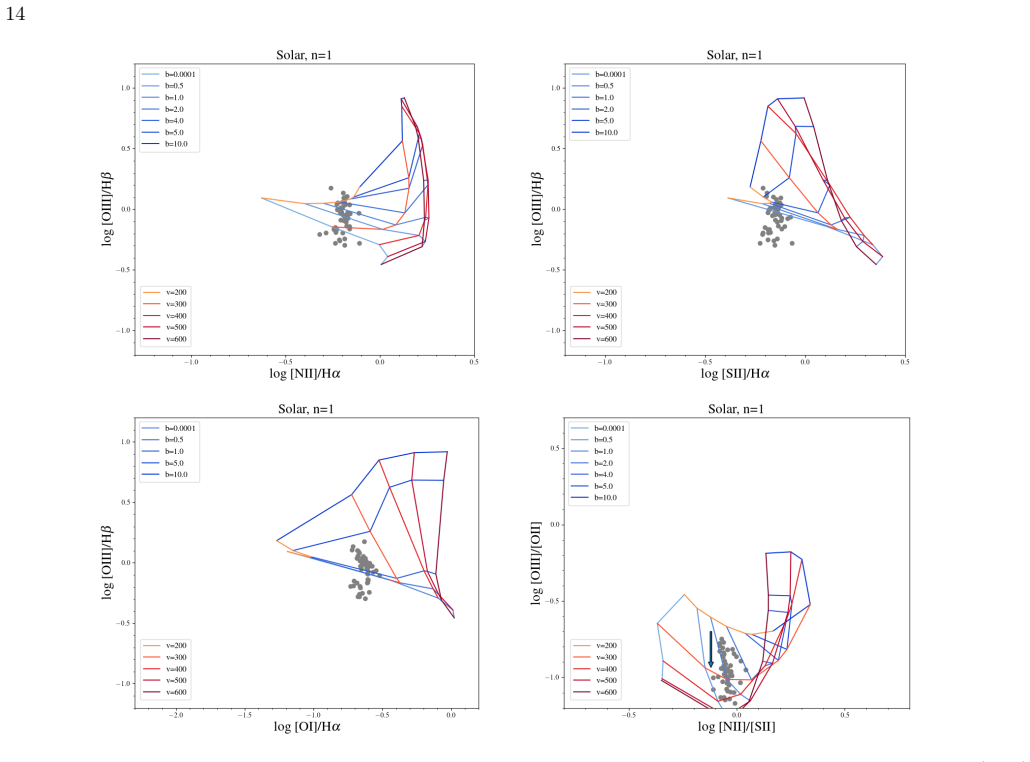
Keck/KCWI+KCRM spectroscopy of ORC4 reveals spatially extended ionized gas whose emission-line ratios are best reproduced by shock models with velocities of 200-300 km/s and whose kinematics exhibit strong spatial asymmetries, velocity gradients exceeding 100 km/s, and dispersions of approximately 200 km/s. These measurements are inconsistent with stellar or AGN photoionization and instead indicate that the gas results from shock ionization, mixing, and cooling tied to the energetic event that created the large-scale radio ring.
What carries the argument
Shock ionization models applied to spatially resolved optical emission-line ratios and velocity fields in the central galaxy.
If this is right
- The radio ring is the observable remnant of an energetic event whose shocks also heat and ionize gas inside the central galaxy.
- ORC central galaxies contain cooled, shock-processed gas rather than gas ionized by ongoing star formation or nuclear activity.
- Similar shock signatures should appear in the central galaxies of other isolated ORCs if the same formation channel operates.
- The optical emission can be used to trace the energy and geometry of the ORC-forming event on scales of tens of kiloparsecs.
Where Pith is reading between the lines
- The same shocked-wind picture may unify the radio morphology and optical properties across the growing sample of ORCs.
- High-resolution radio and X-ray imaging could test whether the shock front coincides with the inner edge of the radio ring.
- If the shocks are driven by an outflow, the implied mass and energy loading would constrain the progenitor event to a major merger or powerful AGN episode.
- Time-dependent cooling models could predict how long the optical emission remains visible after the radio ring forms.
Load-bearing premise
That the observed line ratios cannot be produced by AGN or stellar photoionization and that the gas kinematics are caused by the same event that formed the radio ring.
What would settle it
Deeper spectroscopy or kinematic mapping that shows dominant AGN or stellar photoionization signatures, or velocity fields with no spatial or dynamical connection to the radio ring.
Figures


read the original abstract
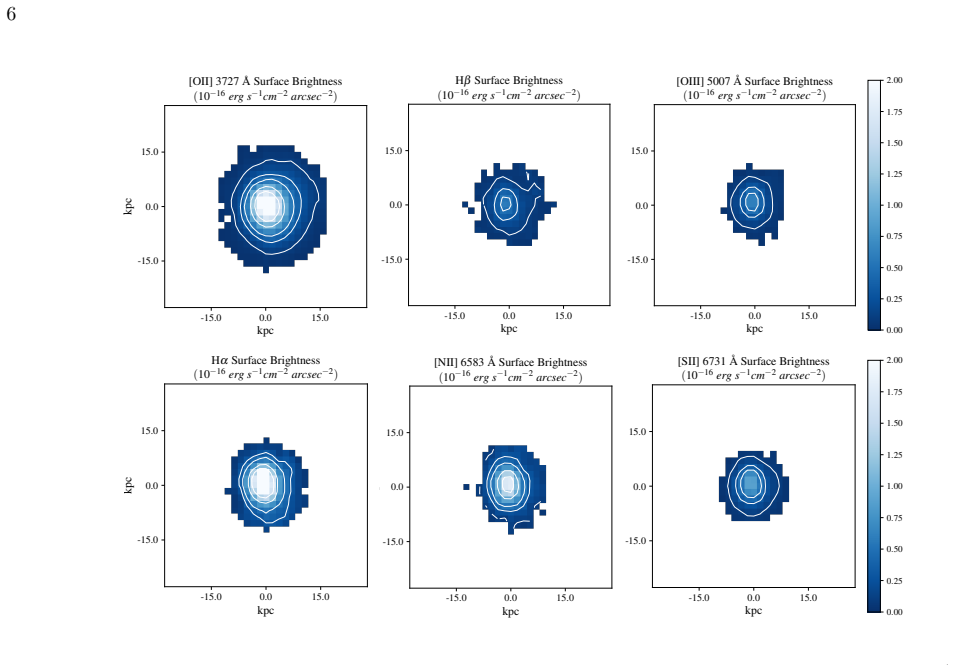
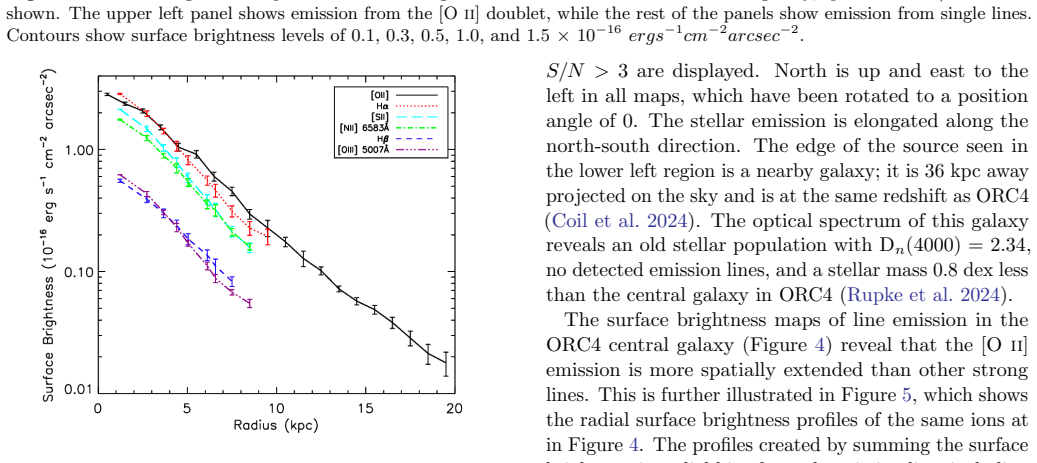
Odd Radio Circles (ORCs) are a new class of extragalactic object, with large rings of faint radio continuum emission typically spanning 100s of kpc; their origins are unknown. Previous optical spectroscopy of the central galaxy in ORC4, a classic isolated ORC, revealed spatially-extended ionized gas with strong [OII] emission and line ratios consistent with LINER emission. We present new Keck/KCWI+KCRM integral field spectroscopy covering multiple strong optical emission lines to measure the extent, morphology, and spatially-resolved kinematics and line ratios of the ionized and neutral gas in the ORC4 central galaxy. We find that [OII] is the strongest optical emission line in this massive, old galaxy, and the [OII] emission is detected to larger radial extent than the other optical lines. The gas kinematics show strong spatial asymmetries, high velocity gradients (>100 km/s), and high velocity dispersion (~200 km/s). The emission line ratios are most consistent with shock models with shock velocities of ~200-300 km/s and are not fit well by stellar or AGN photoionization models. These findings are consistent with a model in which the gas in the ORC4 central galaxy is the result of shock ionization in and around the central galaxy, likely due to mixing and cooling of gas associated with the event that created the large-scale radio ring of emission that identified this source as an ORC.
Editorial analysis
A structured set of objections, weighed in public.
Referee Report
Summary. The paper presents new Keck/KCWI integral field spectroscopy of the central galaxy in ORC4, revealing extended [OII] emission to larger radii than other lines, strong kinematic asymmetries with velocity gradients >100 km/s and dispersions ~200 km/s, and emission line ratios best matched by shock models at 200-300 km/s rather than stellar or AGN photoionization. The authors interpret the gas as arising from shock ionization due to mixing and cooling tied to the event that formed the large-scale radio ring.
Significance. If the interpretation holds, the work supplies spatially resolved evidence linking central ionized gas properties to ORC formation via shocks, moving beyond single-aperture data and offering a testable physical scenario for these radio structures. The combination of kinematics and line-ratio diagnostics provides a concrete observational anchor for models of ORC origins.
major comments (2)
- [Discussion] Discussion/interpretation section: the claim that the central gas results from mixing/cooling associated with the radio-ring event is load-bearing for the title and abstract conclusion, yet the KCWI data show only local consistency with 200-300 km/s shocks; no velocity continuity, outflow alignment, or energy/momentum match is demonstrated across the ~100 kpc scales separating the central galaxy from the ring.
- [Results] Results section on line ratios: the statement that ratios 'are not fit well by stellar or AGN photoionization models' requires explicit reporting of the model grids (e.g., MAPPINGS or CLOUDY references), fitting procedure, and quantitative metrics such as reduced chi-squared or Bayesian evidence to substantiate that shocks are preferred over alternatives.
minor comments (2)
- [Abstract] Abstract: specify the maximum observed velocity gradient and its spatial location rather than the inequality '>100 km/s' to allow direct comparison with the reported dispersion.
- [Figures] Figure captions and methods: include error bars on all line-ratio diagrams and state the exact shock-velocity grid spacing used in the model comparisons.
Simulated Author's Rebuttal
We thank the referee for their careful reading and constructive feedback. We address each major comment below and have revised the manuscript to improve clarity and rigor in the presentation of our results and interpretation.
read point-by-point responses
-
Referee: [Discussion] Discussion/interpretation section: the claim that the central gas results from mixing/cooling associated with the radio-ring event is load-bearing for the title and abstract conclusion, yet the KCWI data show only local consistency with 200-300 km/s shocks; no velocity continuity, outflow alignment, or energy/momentum match is demonstrated across the ~100 kpc scales separating the central galaxy from the ring.
Authors: We agree that the KCWI observations provide spatially resolved evidence only within the central galaxy and do not directly demonstrate velocity continuity, outflow alignment, or an energy/momentum balance across the full ~100 kpc to the radio ring. Our interpretation rests on the local consistency of the observed kinematics (velocity gradients >100 km/s, dispersions ~200 km/s) and line ratios with 200-300 km/s shock models, together with the established association of the central galaxy with ORC4. In the revised manuscript we have softened the language in the discussion, abstract, and title to present this as a plausible physical scenario supported by the local data rather than a definitively established causal link. We have added explicit caveats noting the absence of direct cross-scale connections and the value of future multi-scale observations. This preserves the core scientific contribution while accurately reflecting the scope of the current dataset. revision: partial
-
Referee: [Results] Results section on line ratios: the statement that ratios 'are not fit well by stellar or AGN photoionization models' requires explicit reporting of the model grids (e.g., MAPPINGS or CLOUDY references), fitting procedure, and quantitative metrics such as reduced chi-squared or Bayesian evidence to substantiate that shocks are preferred over alternatives.
Authors: We thank the referee for this suggestion. In the revised Results section we now explicitly cite the MAPPINGS shock grids and the CLOUDY photoionization grids employed, describe the fitting procedure (including how line ratios were extracted and compared), and report quantitative metrics such as reduced chi-squared values for the shock models versus the stellar and AGN photoionization alternatives. These additions substantiate that the shock models provide a statistically preferred description of the observed ratios. revision: yes
Circularity Check
No significant circularity; interpretation rests on external shock model comparisons.
full rationale
The paper's central claim is that KCWI observations of extended [OII] emission, high velocity gradients (>100 km/s), dispersion (~200 km/s), and line ratios in the ORC4 central galaxy are most consistent with shock models (velocities 200-300 km/s) rather than stellar or AGN photoionization. This comparison uses standard literature shock models as an external benchmark, with the link to the large-scale radio ring presented explicitly as a 'consistent model' rather than a derived or fitted prediction. No equations, fitted parameters renamed as predictions, self-definitional loops, or load-bearing self-citations appear in the provided text. The causal connection across scales is interpretive and lacks direct dynamical evidence, but this is an evidentiary limitation, not a reduction of the result to its own inputs by construction. The derivation chain remains self-contained against external benchmarks.
Axiom & Free-Parameter Ledger
free parameters (1)
- shock velocity =
200-300 km/s
axioms (1)
- domain assumption Optical emission line ratios can reliably distinguish shock ionization from stellar or AGN photoionization
Forward citations
Cited by 1 Pith paper
-
A Compact Radio Ring with a Diffuse Envelope in LOFAR: Odd Radio Circle or Distinct Phenomenon?
J1248+4826 is a newly identified compact ORC candidate with a ~30 kpc ring radius and ~200 kpc total extent at assumed z=0.2, consistent with the ORC population but with the host galaxy on the ring edge and no ongoing...
Reference graph
Works this paper leans on
-
[1]
Allen, M. G., Groves, B. A., Dopita, M. A., Sutherland, R. S., & Kewley, L. J. 2008, ApJS, 178, 20, doi: 10.1086/589652 Astropy Collaboration. 2013, A&A, 558, A33, doi: 10.1051/0004-6361/201322068 —. 2018, AJ, 156, 123, doi: 10.3847/1538-3881/aabc4f —. 2022, ApJ, 935, 167, doi: 10.3847/1538-4357/ac7c74
- [2]
-
[3]
D., Netzer, H., Woltjer, L., Courvoisier, T
Blandford, R. D., Netzer, H., Woltjer, L., Courvoisier, T. J.-L., & Mayor, M., eds. 1990, Active Galactic Nuclei
work page 1990
-
[4]
Byrne, C. M., Stanway, E. R., Eldridge, J. J., McSwiney, L., & Townsend, O. T. 2022, MNRAS, 512, 5329, doi: 10.1093/mnras/stac807
-
[5]
2012, pPXF: Penalized Pixel-Fitting stellar kinematics extraction
Cappellari, M. 2012, pPXF: Penalized Pixel-Fitting stellar kinematics extraction. http://ascl.net/1210.002 —. 2017, MNRAS, 466, 798, doi: 10.1093/mnras/stw3020
work page internal anchor Pith review doi:10.1093/mnras/stw3020 2012
-
[6]
Cardelli, J. A., Clayton, G. C., & Mathis, J. S. 1989, ApJ, 345, 245, doi: 10.1086/167900 Cid Fernandes, R., et al. 2010, MNRAS, 403, 1036, doi: 10.1111/j.1365-2966.2009.16185.x
-
[7]
Coil, A. L., et al. 2024, Nature, 625, 459, doi: 10.1038/s41586-023-06752-8
-
[8]
Dolag, K., B¨ oss, L. M., Koribalski, B. S., Steinwandel, U. P., & Valentini, M. 2023, ApJ, 945, 74, doi: 10.3847/1538-4357/acb5f5
-
[9]
Fielding, D. B., & Bryan, G. L. 2022, ApJ, 924, 82, doi: 10.3847/1538-4357/ac2f41 Filipovi´ c, M. D., et al. 2022, MNRAS, 512, 265, doi: 10.1093/mnras/stac210
-
[10]
Gronke, M., & Oh, S. P. 2020, MNRAS, 492, 1970, doi: 10.1093/mnras/stz3332
-
[11]
Groves, B. A., Dopita, M. A., & Sutherland, R. S. 2004, ApJS, 153, 9, doi: 10.1086/421113
-
[12]
2022, PASA, 39, e051, doi: 10.1017/pasa.2022.44
Gupta, N., et al. 2022, PASA, 39, e051, doi: 10.1017/pasa.2022.44
-
[13]
Hunter, J. D. 2007, Computing in Science & Engineering, 9, 90, doi: 10.1109/MCSE.2007.55
-
[14]
2003, MNRAS, 346, 1055, doi: 10.1111/j.1365-2966.2003.07154.x
Kauffmann, G., et al. 2003, MNRAS, 346, 1055, doi: 10.1111/j.1365-2966.2003.07154.x
-
[15]
Kewley, L. J., Dopita, M. A., Sutherland, R. S., Heisler, C. A., & Trevena, J. 2001, ApJ, 556, 121, doi: 10.1086/321545
work page internal anchor Pith review doi:10.1086/321545 2001
-
[16]
Kewley, L. J., Groves, B., Kauffmann, G., & Heckman, T. 2006, MNRAS, 372, 961, doi: 10.1111/j.1365-2966.2006.10859.x
-
[17]
Koribalski, B. S., et al. 2021, MNRAS, 505, L11, doi: 10.1093/mnrasl/slab041 —. 2023, arXiv e-prints, arXiv:2304.11784, doi: 10.48550/arXiv.2304.11784 —. 2024, MNRAS, 531, 3357, doi: 10.1093/mnras/stae1254
-
[18]
Koutsoumpou, E., Fern´ andez-Ontiveros, J. A., Dasyra, K. M., & Spinoglio, L. 2025, A&A, 693, A215, doi: 10.1051/0004-6361/202452232
-
[19]
A., Quataert, E., & Weinberg, D
Lochhaas, C., Thompson, T. A., Quataert, E., & Weinberg, D. H. 2018, MNRAS, 481, 1873, doi: 10.1093/mnras/sty2421
-
[20]
Shabala, S. S. 2023, MNRAS, 520, 1439, doi: 10.1093/mnras/stad074
-
[21]
Markwardt, C. B. 2009, in Astronomical Society of the Pacific Conference Series, Vol. 411, Astronomical Data Analysis Software and Systems XVIII, ed. D. A
work page 2009
-
[22]
Non-linear Least Squares Fitting in IDL with MPFIT
Bohlender, D. Durand, & P. Dowler, 251, doi: 10.48550/arXiv.0902.2850
work page internal anchor Pith review Pith/arXiv arXiv doi:10.48550/arxiv.0902.2850
-
[23]
2016, PASA, 33, e042, doi: 10.1017/pasa.2016.37
McConnell, D., et al. 2016, PASA, 33, e042, doi: 10.1017/pasa.2016.37
-
[24]
McGurk, R. C., et al. 2024, in Society of Photo-Optical Instrumentation Engineers (SPIE) Conference Series, Vol. 13096, Ground-based and Airborne Instrumentation for Astronomy X, ed. J. J. Bryant, K. Motohara, & J. R. D. Vernet, 1309647, doi: 10.1117/12.3020646
-
[25]
2018, ApJ, 864, 93, doi: 10.3847/1538-4357/aad597
Morrissey, P., et al. 2018, ApJ, 864, 93, doi: 10.3847/1538-4357/aad597
-
[26]
Norris, R. P., et al. 2021, PASA, 38, e003, doi: 10.1017/pasa.2020.52 —. 2022, MNRAS, 513, 1300, doi: 10.1093/mnras/stac701 —. 2025, MNRAS, 537, L42, doi: 10.1093/mnrasl/slae114
-
[27]
2023, ApJ, 949, 9, doi: 10.3847/1538-4357/acc660 —
Perrotta, S., et al. 2023, ApJ, 949, 9, doi: 10.3847/1538-4357/acc660 —. 2024, ApJ, 975, 263, doi: 10.3847/1538-4357/ad7b0c 18 Planck Collaboration, Aghanim, N., et al. 2020, A&A, 641, A6, doi: 10.1051/0004-6361/201833910
-
[28]
Pradhan, A. K., Montenegro, M., Nahar, S. N., & Eissner, W. 2006, MNRAS, 366, L6, doi: 10.1111/j.1745-3933.2005.00119.x
-
[29]
Rich, J. A., Kewley, L. J., & Dopita, M. A. 2011, ApJ, 734, 87, doi: 10.1088/0004-637X/734/2/87
-
[30]
Rupke, D. S. N. 2014, IFSRED: Data Reduction for Integral Field Spectrographs, Astrophysics Source Code Library, ascl:1409.004
work page 2014
-
[31]
Rupke, D. S. N., G¨ ultekin, K., & Veilleux, S. 2017, ApJ, 850, 40, doi: 10.3847/1538-4357/aa94d1
-
[32]
Rupke, D. S. N., et al. 2019, Nature, 574, 643, doi: 10.1038/s41586-019-1686-1 —. 2023, ApJ, 947, 33, doi: 10.3847/1538-4357/acbfae —. 2024, ApJ, 967, 51, doi: 10.3847/1538-4357/ad3934
-
[33]
Shabala, S. S., et al. 2024, PASA, 41, e024, doi: 10.1017/pasa.2024.11
-
[34]
Stanway, E. R., & Eldridge, J. J. 2018, MNRAS, 479, 75, doi: 10.1093/mnras/sty1353 Van Der Walt, S., Colbert, S. C., & Varoquaux, G. 2011, Computing in Science & Engineering, 13, 22
-
[35]
Veilleux, S., & Osterbrock, D. E. 1987, ApJS, 63, 295
work page 1987
-
[36]
Yamasaki, S., Sarkar, K. C., & Li, Z. 2024, MNRAS, 528, 3854, doi: 10.1093/mnras/stae281
-
[37]
2006, ApJ, 648, 281, doi: 10.1086/505629
Yan, R., et al. 2006, ApJ, 648, 281, doi: 10.1086/505629
discussion (0)
Sign in with ORCID, Apple, or X to comment. Anyone can read and Pith papers without signing in.