Exploring Urban Mobility Trends using Cellular Network Data
Pith reviewed 2026-05-24 02:38 UTC · model grok-4.3
The pith
Cellular network routing reports can be processed to reveal spatiotemporal patterns of transportation modes and crowd movements in Trondheim.
A machine-rendered reading of the paper's core claim, the machinery that carries it, and where it could break.
Core claim
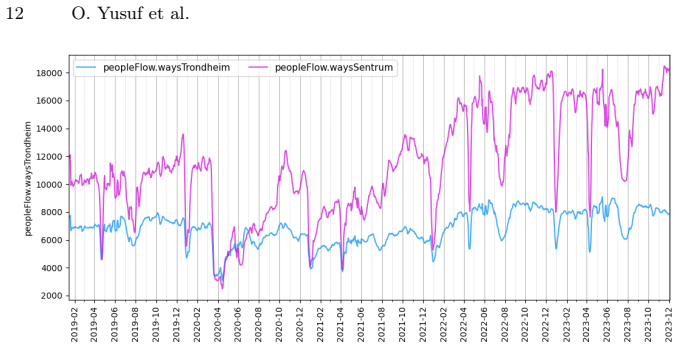
By applying a data preprocessing and feature engineering framework to raw routing reports from cellular networks, the study extracts geospatial trends and temporal patterns of various transportation routes and modes in Trondheim. This enables comparative analysis across modes, examination of public transit usage, and in-depth study of specific routes relative to the broader city context, demonstrating the resource value of such telecom data for urban mobility planning.
What carries the argument
The data preprocessing and feature engineering framework that converts raw cellular routing reports into records suitable for historical geospatial and temporal analysis.
If this is right
- Comparative analysis of transportation modes becomes feasible at scale using existing network signals.
- Public transit usage patterns can be quantified and compared to private vehicle routes.
- Specific routes and neighborhoods can be benchmarked against city-wide averages to highlight local differences.
- Deficiencies in current infrastructure can be identified to guide targeted improvements.
- The approach supplies an additional data layer for decisions aimed at sustainable mobility systems.
Where Pith is reading between the lines
- The same preprocessing steps could be tested on cellular data from other cities to check transferability.
- Combining routing-report outputs with traditional survey data might reduce sampling bias in mobility studies.
- Temporal patterns identified here could be monitored over longer periods to detect changes after new transit lines open.
- Privacy-preserving aggregation methods would be needed before scaling this method beyond research settings.
Load-bearing premise
The raw routing reports accurately and representatively capture actual human movement trajectories and mode choices without substantial sampling bias, privacy filtering artifacts, or coverage gaps.
What would settle it
Independent travel surveys or GPS traces collected in Trondheim over the same period would produce mobility statistics that either align closely with or diverge markedly from the patterns extracted from the routing reports.
Figures







read the original abstract
The growth of urban areas intensifies the need for sustainable, efficient transportation infrastructure and mobility systems, driving initiatives to enhance infrastructure and public transit while reducing traffic congestion and emissions. By utilizing real-world data, a data-driven approach can provide crucial insights for urban mobility planning and decision-making. This study explores the efficacy of leveraging telecoms data from cellular network signals for studying crowd movement patterns, focusing on Trondheim, Norway. It examines routing reports to understand the spatiotemporal dynamics of various transportation routes and modes. A data preprocessing and feature engineering framework was developed to process raw routing reports for historical analysis. This enabled the examination of geospatial trends and temporal patterns, including a comparative analysis of various transportation modes, along with public transit usage. Specific routes and areas were analyzed in-depth to compare their mobility patterns with the broader city context. The study highlights the potential of cellular network data as a resource for shaping urban transportation and mobility systems. By identifying deficiencies and potential improvements, city planners and stakeholders can foster more sustainable and effective transportation and mobility solutions.
Editorial analysis
A structured set of objections, weighed in public.
Referee Report
Summary. The paper claims that routing reports from cellular network data can be leveraged to study crowd movement patterns, spatiotemporal dynamics of transportation routes and modes, and public transit usage in Trondheim, Norway. A preprocessing and feature engineering framework is developed to process raw reports for historical analysis, enabling examination of geospatial trends, temporal patterns, mode comparisons, and in-depth analysis of specific routes and areas relative to the broader city context, with the goal of providing insights for urban mobility planning.
Significance. If the derived patterns can be shown to be representative, the work would illustrate the utility of an underused telecom data source for mobility studies in a mid-sized city, potentially enabling new analyses of route-level and mode-specific dynamics that complement traditional surveys or GPS data.
major comments (2)
- [Abstract and Methods (preprocessing framework)] The central claim that the processed routing reports yield reliable insights for urban planning and decision-making (Abstract) rests on the untested assumption that these reports accurately and representatively capture actual trajectories and mode choices. No cross-validation against independent ground-truth sources (traffic counters, transit ridership logs, or GPS traces) for the Trondheim area is reported, leaving open the possibility that coverage gaps, privacy filtering, or operator-specific sampling systematically distort the observed flows and trends.
- [Results (mode comparison and public transit sections)] The comparative analysis of transportation modes and public transit usage is presented as a key output, yet the manuscript provides no quantitative assessment of how well the cellular data align with known mode shares or ridership statistics in Trondheim, undermining the strength of the spatiotemporal and mode-specific conclusions.
minor comments (2)
- [Abstract] The abstract states that 'specific routes and areas were analyzed in-depth' but does not name the routes or areas or summarize the concrete differences found relative to the city-wide patterns.
- [Methods] Notation for derived mobility metrics (e.g., any definitions of flow, speed, or mode probability) should be introduced explicitly with equations or pseudocode in the methods section to allow reproducibility.
Simulated Author's Rebuttal
We thank the referee for the constructive comments, which highlight important limitations in the current manuscript. We address each major comment below.
read point-by-point responses
-
Referee: [Abstract and Methods (preprocessing framework)] The central claim that the processed routing reports yield reliable insights for urban planning and decision-making (Abstract) rests on the untested assumption that these reports accurately and representatively capture actual trajectories and mode choices. No cross-validation against independent ground-truth sources (traffic counters, transit ridership logs, or GPS traces) for the Trondheim area is reported, leaving open the possibility that coverage gaps, privacy filtering, or operator-specific sampling systematically distort the observed flows and trends.
Authors: We agree that the manuscript does not report cross-validation against independent ground-truth sources. The work is framed as an exploratory study demonstrating the potential of cellular routing reports rather than a validated operational system. Obtaining matching high-resolution ground-truth data for Trondheim proved infeasible due to privacy regulations and data-access constraints. We will revise the abstract and add an explicit limitations subsection to temper claims about reliability for decision-making and to discuss possible sampling biases. revision: yes
-
Referee: [Results (mode comparison and public transit sections)] The comparative analysis of transportation modes and public transit usage is presented as a key output, yet the manuscript provides no quantitative assessment of how well the cellular data align with known mode shares or ridership statistics in Trondheim, undermining the strength of the spatiotemporal and mode-specific conclusions.
Authors: We acknowledge the absence of quantitative alignment with official mode-share or ridership statistics. The presented results emphasize relative spatiotemporal patterns observable within the cellular dataset itself. We will add a discussion paragraph that qualitatively situates our mode observations against publicly available aggregate statistics for Trondheim and will explicitly note the methodological differences that preclude direct quantitative benchmarking. revision: partial
Circularity Check
No circularity: purely exploratory data description with no derivation or prediction steps
full rationale
The manuscript presents a data preprocessing pipeline applied to cellular routing reports for Trondheim, followed by descriptive analysis of spatiotemporal patterns and mode comparisons. No equations, fitted parameters, predictions, or first-principles derivations are described that could reduce to the inputs by construction. The central claim concerns the utility of the data source for insights, framed as exploratory rather than as a derived result. Self-citations are absent from the provided text, and no uniqueness theorems or ansatzes are invoked. The analysis is therefore self-contained as description; any concerns about representativeness or external validation fall under empirical robustness rather than circularity.
Axiom & Free-Parameter Ledger
Reference graph
Works this paper leans on
-
[1]
Milj pakken : Bromstadruta For Sykkel (2024), https://miljopakken.no/prosjekter/bromstadruta-for-sykkel
work page 2024
-
[2]
Statistisk Sentralbry : 04861: Area and Population of Urban Settlements ( M ) 2000 - 2023 (2024), https://www.ssb.no/en/statbank/table/04861/
work page 2000
-
[3]
Telia : Crowd Insights Methodology (Oct 2021), https://coda.io/@data-insights/telia-webinars-and-training/crowd-insights-methodology-training-27
work page 2021
-
[4]
data service (2024), https://www.visualcrossing.com/
Visual Crossing Corporation : Visual Crossing Weather (2019-2024). data service (2024), https://www.visualcrossing.com/
work page 2019
-
[5]
, " * write output.state after.block = add.period write
ENTRY address author booktitle chapter doi edition editor eid howpublished institution journal key month note number organization pages publisher school series title type url volume year label INTEGERS output.state before.all mid.sentence after.sentence after.block FUNCTION init.state.consts #0 'before.all := #1 'mid.sentence := #2 'after.sentence := #3 '...
-
[6]
" write newline "" before.all 'output.state := FUNCTION n.dashify 't := "" t empty not t #1 #1 substring "-" = t #1 #2 substring "--" = not "--" * t #2 global.max substring 't := t #1 #1 substring "-" = "-" * t #2 global.max substring 't := while if t #1 #1 substring * t #2 global.max substring 't := if while FUNCTION word.in bbl.in capitalize ":" * " " *...
discussion (0)
Sign in with ORCID, Apple, or X to comment. Anyone can read and Pith papers without signing in.