The NIKA2 cosmological legacy survey at 2 mm: catalogs, colors, redshift distributions, and implications for deep surveys
Pith reviewed 2026-05-19 08:15 UTC · model grok-4.3
The pith
Observations at 2 mm reveal no exotic galaxy population and select for higher average redshifts than 1.2 mm surveys.
A machine-rendered reading of the paper's core claim, the machinery that carries it, and where it could break.
Core claim
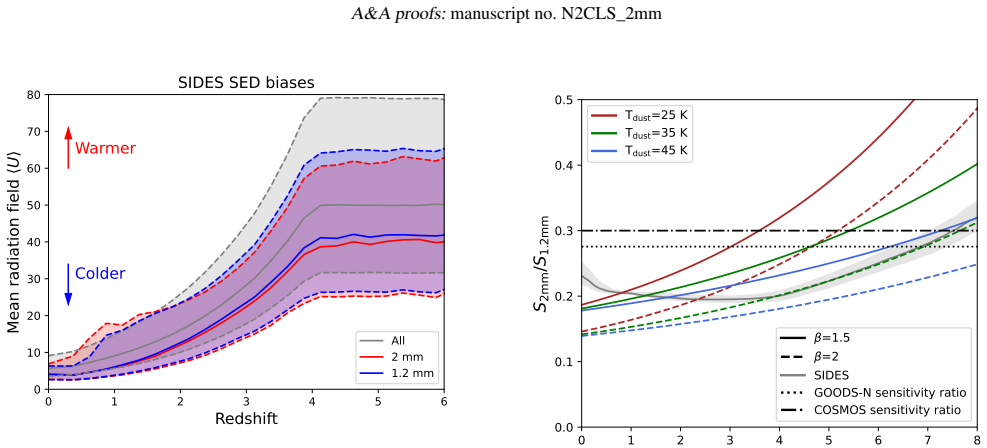
The survey data combined with modeling show a mean flux ratio of about 0.22 between 2 mm and 1.2 mm, with a mean redshift of around 3.2 to 3.6 depending on the field. The nine sources seen only at 2 mm are mostly consistent with noise or known types like radio galaxies, with no sign of an unusual population that shines only at 2 mm. The higher mean redshift arises because the 2 mm selection is less sensitive to the peak emission from galaxies at z~2.
What carries the argument
The flux density ratio between 2 mm and 1.2 mm, which serves as a color indicator for the spectral energy distribution of dusty galaxies and its relation to redshift.
If this is right
- 2 mm samples will contain fewer galaxies at moderate redshifts around 2 compared to 1.2 mm samples.
- Single-dish surveys at longer wavelengths can build high-redshift samples but with different selection biases.
- The large dispersion in colors limits the use of simple color cuts for high-z selection.
- Interferometric follow-up is needed to confirm candidates and reduce spurious detections.
Where Pith is reading between the lines
- Future surveys might combine multiple wavelengths to better separate redshift populations without relying on simulations.
- Overdensities can affect mean redshifts in small fields, suggesting larger areas are needed for robust statistics.
- These selection effects should be accounted for when comparing number counts across different millimeter surveys.
Load-bearing premise
That the modeling of galaxy distributions and detector effects accurately represents the real sky and instrument performance at these wavelengths.
What would settle it
Finding more than a handful of genuine 2 mm sources with no counterpart at 1.2 mm or other wavelengths that cannot be explained as radio galaxies or noise spikes.
Figures


read the original abstract
Millimeter galaxy surveys are particularly effective in detecting dusty star-forming galaxies at high redshift. While such observations are typically conducted at ~1mm, some studies suggest that 2mm may be better suited for selecting sources at even higher redshifts. We use the unprecedented 2mm data from the N2CLS, together with the SIDES simulation, to study and interpret the statistical properties of 2mm-selected galaxies. We use the N2CLS robust sample at 2mm, which contains 25 sources in the deep GOODS-N field and 90 sources in the wide COSMOS. The sources are matched with the N2CLS 1.2mm sources, the ancillary 850um sources, and redshift catalogs to study the colors and redshift distributions. We also produce end-to-end simulations based on SIDES and the observed N2CLS detector timelines to interpret the data. We find a mean S2/S1.2 color of 0.222$\pm$0.008 with a standard deviation of 0.070$\pm$0.010. We measure a mean redshift of $3.6\pm0.3$ in GOODS-N, which is marginally higher than expectations from SIDES ($2.9\pm0.2$) because of an overdensity at $z\sim5.2$, and $3.2\pm0.2$ in COSMOS, which agrees with the $3.2\pm0.2$ predicted by SIDES. We also show that the observed S2/S1.2 colors exhibit a weak dependence with redshift but a large dispersion, which limits its efficiency to select high-z sources. Finally, we studied the nine 2mm sources not detected at 1.2mm, and found that two of them are radiogalaxies, one is a z~2 galaxy, and the remaining six are compatible with the expected number of spurious detections. The N2CLS survey shows no evidence for any exotic 2mm-only galaxy population. Using SIDES, we show that 2mm samples have a higher mean redshift compared to 1.2mm because they miss z~2 dusty galaxies. Finally, we discuss the efficiency of single-dish and interferometric blind surveys to build samples of high-z dusty galaxies.
Editorial analysis
A structured set of objections, weighed in public.
Referee Report
Summary. The manuscript reports results from the NIKA2 2 mm cosmological legacy survey (N2CLS) using robust samples of 25 sources in GOODS-N and 90 sources in COSMOS. It measures a mean S2/S1.2 color of 0.222 ± 0.008 (dispersion 0.070 ± 0.010), mean redshifts of 3.6 ± 0.3 (GOODS-N, marginally higher than SIDES due to z ~ 5.2 overdensity) and 3.2 ± 0.2 (COSMOS, matching SIDES), examines nine 2 mm sources undetected at 1.2 mm (finding two radio galaxies, one z ~ 2 galaxy, and six consistent with spurious detections), and concludes there is no evidence for an exotic 2 mm-only population. Using SIDES end-to-end simulations, it argues that 2 mm samples exhibit higher mean redshifts than 1.2 mm samples because they miss z ~ 2 dusty galaxies, while noting limited efficiency of the color for high-z selection.
Significance. If the results hold, this provides direct empirical constraints on mm-wave colors and redshift distributions of dusty star-forming galaxies, clarifying selection biases in 2 mm vs. 1.2 mm surveys. The data-driven measurements of colors and redshifts, combined with ancillary matching and end-to-end noise modeling from observed timelines, offer a robust basis for interpreting why 2 mm surveys can access higher redshifts, with practical implications for designing future deep single-dish and interferometric surveys.
major comments (2)
- [Discussion of selection effects and redshift distributions] The interpretation that 2 mm samples have higher mean redshift than 1.2 mm samples because they miss z ~ 2 dusty galaxies (abstract and discussion section) rests on SIDES accurately reproducing mm flux ratios and selection at z ~ 2. While observed mean color (0.222 ± 0.008) and redshifts are direct measurements, the causal explanation would be strengthened by explicit sensitivity tests to dust temperature, emissivity, or luminosity function assumptions in SIDES, as these directly affect which z ~ 2 galaxies are predicted to be detected at 1.2 mm but not 2 mm.
- [Redshift distribution results] In the redshift distribution analysis, the GOODS-N mean redshift (3.6 ± 0.3) is described as marginally higher than SIDES (2.9 ± 0.2) due to a z ~ 5.2 overdensity. The paper should report the number of sources in the z ~ 5.2 bin, the Poisson or bootstrap significance of the overdensity relative to the field, and whether removing those sources brings the mean into agreement with SIDES to confirm this as the sole cause.
minor comments (3)
- [Sample selection] Clarify in the methods or results section whether the reported robust samples (25 in GOODS-N, 90 in COSMOS) include all cuts for reliability or if further filtering was applied before color and redshift analysis.
- [Figures] Ensure figure captions for color-redshift plots and histograms explicitly distinguish observed data points from SIDES predictions and include error bars or uncertainty bands for the mean values.
- [Color measurements] The abstract states the color dispersion as 0.070 ± 0.010; confirm this uncertainty is propagated correctly from the individual source measurements and reported consistently in the main text.
Simulated Author's Rebuttal
We thank the referee for their constructive review and recommendation for minor revision. We have addressed each major comment below and will incorporate the suggested improvements into the revised manuscript to strengthen the presentation of our results.
read point-by-point responses
-
Referee: The interpretation that 2 mm samples have higher mean redshift than 1.2 mm samples because they miss z ~ 2 dusty galaxies (abstract and discussion section) rests on SIDES accurately reproducing mm flux ratios and selection at z ~ 2. While observed mean color (0.222 ± 0.008) and redshifts are direct measurements, the causal explanation would be strengthened by explicit sensitivity tests to dust temperature, emissivity, or luminosity function assumptions in SIDES, as these directly affect which z ~ 2 galaxies are predicted to be detected at 1.2 mm but not 2 mm.
Authors: We agree that explicit sensitivity tests would further strengthen the causal link between the observed higher mean redshift in 2 mm samples and the missing z ~ 2 population. Although the SIDES model used in our analysis has been validated against a broad set of multi-wavelength constraints, we will add a dedicated paragraph in the discussion section presenting results from additional end-to-end simulations. These will vary dust temperature by ±5 K, emissivity index by ±0.2, and luminosity function parameters within published uncertainties, confirming that the conclusion regarding missed z ~ 2 galaxies remains robust. The revised manuscript will include these tests. revision: yes
-
Referee: In the redshift distribution analysis, the GOODS-N mean redshift (3.6 ± 0.3) is described as marginally higher than SIDES (2.9 ± 0.2) due to a z ~ 5.2 overdensity. The paper should report the number of sources in the z ~ 5.2 bin, the Poisson or bootstrap significance of the overdensity relative to the field, and whether removing those sources brings the mean into agreement with SIDES to confirm this as the sole cause.
Authors: We appreciate this suggestion for greater transparency. In the revised manuscript we will report the exact number of sources in the z ~ 5.2 bin for the GOODS-N sample, quantify the overdensity significance using Poisson statistics relative to the SIDES field expectation, and present the mean redshift obtained after removing those sources. This will demonstrate that the overdensity accounts for the difference and that the remaining distribution aligns with the simulation within uncertainties. revision: yes
Circularity Check
Core results are direct data measurements independent of the simulation; SIDES used only for interpretation and expected-value benchmarks
full rationale
The paper reports direct observational quantities extracted from the N2CLS 2 mm catalog, 1.2 mm matches, ancillary 850 μm data, and redshift catalogs: the mean S2/S1.2 color (0.222 ± 0.008), the measured mean redshifts (3.6 ± 0.3 in GOODS-N, 3.2 ± 0.2 in COSMOS), and the classification of the nine 1.2 mm non-detections (two radio galaxies, one z ~ 2 source, six consistent with spurious). These values are obtained without reference to any model. SIDES enters only in the interpretive layer to supply comparison predictions and to illustrate selection effects (e.g., missing z ~ 2 galaxies). No equation or central claim reduces by construction to a fitted parameter, self-defined quantity, or unverified self-citation; the simulation functions as an external benchmark rather than a definitional input. This yields a minor self-citation score of 2 with no load-bearing circularity in the derivation chain.
Axiom & Free-Parameter Ledger
axioms (1)
- domain assumption The SIDES simulation and end-to-end detector timeline modeling accurately reproduce the expected colors, redshift distributions, and spurious detection rates for 2mm and 1.2mm observations.
Lean theorems connected to this paper
-
IndisputableMonolith/Cost/FunctionalEquation.leanwashburn_uniqueness_aczel unclear?
unclearRelation between the paper passage and the cited Recognition theorem.
We find a mean S2 mm/S1.2 mm color of 0.215±0.006 ... mean redshift of 3.6±0.3 in GOODS-N ... Using SIDES, we show that 2 mm samples have a higher mean redshift compared to 1.2 mm because they miss z~2 dusty galaxies.
-
IndisputableMonolith/Foundation/RealityFromDistinction.leanreality_from_one_distinction unclear?
unclearRelation between the paper passage and the cited Recognition theorem.
end-to-end simulations based on SIDES and the observed N2CLS detector timelines
What do these tags mean?
- matches
- The paper's claim is directly supported by a theorem in the formal canon.
- supports
- The theorem supports part of the paper's argument, but the paper may add assumptions or extra steps.
- extends
- The paper goes beyond the formal theorem; the theorem is a base layer rather than the whole result.
- uses
- The paper appears to rely on the theorem as machinery.
- contradicts
- The paper's claim conflicts with a theorem or certificate in the canon.
- unclear
- Pith found a possible connection, but the passage is too broad, indirect, or ambiguous to say the theorem truly supports the claim.
Forward citations
Cited by 1 Pith paper
-
The NIKA2 Cosmological Legacy Survey in COSMOS: Final 1.2mm and 2mm source catalogs and redshift distribution of dusty star-forming galaxies
The NIKA2 survey delivers catalogs of 323 mm-selected sources in COSMOS with redshifts peaking at z=2.8, including 66 at z>4, matching SIDES simulations but inconsistent with four other galaxy evolution models.
Reference graph
Works this paper leans on
-
[1]
Adam, R., Adane, A., Ade, P. A. R., et al. 2018, A&A, 609, A115
work page 2018
-
[2]
2016, MNRAS, 462, 1989 Astropy Collaboration, Price-Whelan, A
Asboth, V ., Conley, A., Sayers, J., et al. 2016, MNRAS, 462, 1989 Astropy Collaboration, Price-Whelan, A. M., Lim, P. L., et al. 2022, ApJ, 935, 167 Astropy Collaboration, Price-Whelan, A. M., Sip˝ocz, B. M., et al. 2018, AJ, 156, 123 Astropy Collaboration, Robitaille, T. P., Tollerud, E. J., et al. 2013, A&A, 558, A33
work page 2016
-
[3]
Barrufet, L., Oesch, P. A., Bouwens, R., et al. 2023, MNRAS, 522, 3926
work page 2023
- [4]
-
[5]
Behroozi, P. S., Conroy, C., & Wechsler, R. H. 2010, ApJ, 717, 379
work page 2010
- [6]
-
[7]
Berta, S. & Zylka, R. 2019-2024, Welcome to the PIIC, https://www.iram. fr/~gildas/dist/piic.pdf Béthermin, M., Daddi, E., Magdis, G., et al. 2015a, A&A, 573, A113 Béthermin, M., Daddi, E., Magdis, G., et al. 2012, ApJ, 757, L23 Béthermin, M., De Breuck, C., Sargent, M., & Daddi, E. 2015b, A&A, 576, L9 Béthermin, M., Fudamoto, Y ., Ginolfi, M., et al. 202...
work page 2019
- [8]
-
[9]
J., Beelen, A., Lagache, G., et al
Bing, L. J., Beelen, A., Lagache, G., et al. 2024, A&A, 683, A232
work page 2024
-
[10]
Blain, A. W., Smail, I., Ivison, R. J., Kneib, J.-P., & Frayer, D. T. 2002, Phys. Rep., 369, 111
work page 2002
- [11]
-
[12]
Brisbin, D., Miettinen, O., Aravena, M., et al. 2017, A&A, 608, A15
work page 2017
-
[13]
Burgarella, D., Nanni, A., Hirashita, H., et al. 2020, A&A, 637, A32
work page 2020
-
[14]
2016, Journal of Low Temperature Physics, 184, 816
Calvo, M., Benoît, A., Catalano, A., et al. 2016, Journal of Low Temperature Physics, 184, 816
work page 2016
- [15]
-
[16]
Casey, C. M. 2020, ApJ, 900, 68
work page 2020
-
[17]
M., Cooray, A., Capak, P., et al
Casey, C. M., Cooray, A., Capak, P., et al. 2015, ApJ, 808, L33
work page 2015
-
[18]
M., Narayanan, D., & Cooray, A
Casey, C. M., Narayanan, D., & Cooray, A. 2014, Phys. Rep., 541, 45
work page 2014
-
[19]
Casey, C. M., Zavala, J. A., Aravena, M., et al. 2019, arXiv e-prints, arXiv:1910.13331
-
[20]
Casey, C. M., Zavala, J. A., Manning, S. M., et al. 2021, ApJ, 923, 215
work page 2021
-
[21]
Chapman, S. C., Blain, A. W., Ivison, R. J., & Smail, I. R. 2003, Nature, 422, 695
work page 2003
- [22]
- [23]
- [24]
- [25]
- [26]
- [27]
-
[28]
D., Conley, A., Glenn, J., et al
Dowell, C. D., Conley, A., Glenn, J., et al. 2014, ApJ, 780, 75
work page 2014
-
[29]
Dunlop, J. S., McLure, R. J., Biggs, A. D., et al. 2017, Monthly Notices of the Royal Astronomical Society, 466, 861
work page 2017
-
[30]
Faisst, A. L., Fudamoto, Y ., Oesch, P. A., et al. 2020, MNRAS, 498, 4192
work page 2020
-
[31]
2022, MOC: Multi-Order Coverage map Version 2.0, IVOA Recommendation 27 July 2022
Fernique, P., Nebot, A., Durand, D., et al. 2022, MOC: Multi-Order Coverage map Version 2.0, IVOA Recommendation 27 July 2022
work page 2022
-
[32]
2018, Astronomy and Astrophysics, 620, A152
Franco, M., Elbaz, D., Béthermin, M., et al. 2018, Astronomy and Astrophysics, 620, A152
work page 2018
-
[33]
Fudamoto, Y ., Oesch, P. A., Schouws, S., et al. 2021, Nature, 597, 489
work page 2021
-
[34]
Gkogkou, A., Béthermin, M., Lagache, G., et al. 2023, A&A, 670, A16
work page 2023
-
[35]
Gruppioni, C., Béthermin, M., Loiacono, F., et al. 2020, A&A, 643, A8
work page 2020
-
[36]
Hayward, C. C., Sparre, M., Chapman, S. C., et al. 2021, MNRAS, 502, 2922
work page 2021
- [37]
-
[38]
Holland, W. S., Robson, E. I., Gear, W. K., et al. 1999, MNRAS, 303, 659
work page 1999
-
[39]
H., Serjeant, S., Dunlop, J., et al
Hughes, D. H., Serjeant, S., Dunlop, J., et al. 1998, Nature, 394, 241
work page 1998
- [40]
- [41]
-
[42]
Jin, S., Sillassen, N. B., Hodge, J., et al. 2024, A&A, 690, L16
work page 2024
-
[43]
Khostovan, A. A., Kartaltepe, J. S., Salvato, M., et al. 2025, arXiv e-prints, arXiv:2503.00120
-
[44]
Khusanova, Y ., Bethermin, M., Le Fèvre, O., et al. 2021, A&A, 649, A152
work page 2021
-
[45]
Lagache, G., Dole, H., Puget, J.-L., et al. 2004, ApJS, 154, 112
work page 2004
- [46]
-
[47]
Laloux, B., Georgakakis, A., Andonie, C., et al. 2023, MNRAS, 518, 2546
work page 2023
- [48]
-
[49]
F., Combes, F., Salomé, P., et al
Lestrade, J. F., Combes, F., Salomé, P., et al. 2010, A&A, 522, L4
work page 2010
- [50]
- [51]
-
[52]
Long, A. S., Casey, C. M., McKinney, J., et al. 2024, arXiv e-prints, arXiv:2408.14546
-
[53]
Lovell, C. C., Geach, J. E., Davé, R., Narayanan, D., & Li, Q. 2021, MNRAS, 502, 772
work page 2021
-
[54]
E., Daddi, E., Béthermin, M., et al
Magdis, G. E., Daddi, E., Béthermin, M., et al. 2012, ApJ, 760, 6
work page 2012
-
[55]
2019, ApJ, 877, 45 Michałowski, M
Magnelli, B., Karim, A., Staguhn, J., et al. 2019, ApJ, 877, 45 Michałowski, M. J. 2015, A&A, 577, A80
work page 2019
-
[56]
Miettinen, O., Delvecchio, I., Smolˇci´c, V ., et al. 2017, A&A, 606, A17
work page 2017
-
[57]
Mitsuhashi, I., Matsuda, Y ., Smail, I., et al. 2021, ApJ, 907, 122
work page 2021
-
[58]
2014, Journal of Low Temperature Physics, 176, 787
Monfardini, A., Adam, R., Adane, A., et al. 2014, Journal of Low Temperature Physics, 176, 787
work page 2014
-
[59]
Moster, B. P., Naab, T., & White, S. D. M. 2013, MNRAS, 428, 3121
work page 2013
- [60]
-
[61]
Ponthieu, N., Désert, F.-X., Beelen, A., et al. 2025, A&A in press
work page 2025
-
[62]
Rizzo, F., Roman-Oliveira, F., Fraternali, F., et al. 2023, A&A, 679, A129
work page 2023
-
[63]
T., Schinnerer, E., Murphy, E., et al
Sargent, M. T., Schinnerer, E., Murphy, E., et al. 2010, ApJ, 714, L190
work page 2010
-
[64]
Schinnerer, E., Sargent, M. T., Bondi, M., et al. 2010, ApJS, 188, 384
work page 2010
-
[65]
Schreiber, C., Elbaz, D., Pannella, M., et al. 2018, A&A, 609, A30
work page 2018
-
[66]
Schreiber, C., Pannella, M., Elbaz, D., et al. 2015, A&A, 575, A74
work page 2015
-
[67]
Scott, K. S., Wilson, G. W., Aretxaga, I., et al. 2012, MNRAS, 423, 575
work page 2012
-
[68]
M., Smail, I., Dudzeviˇci¯ut˙e, U., et al
Simpson, J. M., Smail, I., Dudzeviˇci¯ut˙e, U., et al. 2020, MNRAS, 495, 3409
work page 2020
-
[69]
Simpson, J. M., Smail, I., Swinbank, A. M., et al. 2017, ApJ, 839, 58
work page 2017
-
[70]
Simpson, J. M., Swinbank, A. M., Smail, I., et al. 2014, ApJ, 788, 125
work page 2014
-
[71]
Smail, I., Ivison, R. J., & Blain, A. W. 1997, ApJ, 490, L5 Smolˇci´c, V ., Novak, M., Bondi, M., et al. 2017, A&A, 602, A1
work page 1997
-
[72]
Sommovigo, L., Ferrara, A., Pallottini, A., et al. 2022, MNRAS, 513, 3122
work page 2022
-
[73]
Staguhn, J. G., Kovács, A., Arendt, R. G., et al. 2014, ApJ, 790, 77
work page 2014
-
[74]
L., Weiss, A., De Breuck, C., et al
Strandet, M. L., Weiss, A., De Breuck, C., et al. 2017, The Astrophysical Journal, 842, L15
work page 2017
-
[75]
2021, ApJ, 909, 23 van der Vlugt, D., Hodge, J
Talia, M., Cimatti, A., Giulietti, M., et al. 2021, ApJ, 909, 23 van der Vlugt, D., Hodge, J. A., Jin, S., et al. 2023, ApJ, 951, 131
work page 2021
-
[76]
Vieira, J. D., Marrone, D. P., Chapman, S. C., et al. 2013, Nature, 495, 344
work page 2013
-
[77]
Viero, M. P., Sun, G., Chung, D. T., Moncelsi, L., & Condon, S. S. 2022, MN- RAS, 516, L30
work page 2022
-
[78]
Wang, T., Schreiber, C., Elbaz, D., et al. 2019, Nature, 572, 211
work page 2019
-
[79]
Weaver, J. R., Kauffmann, O. B., Ilbert, O., et al. 2022, ApJS, 258, 11 Weiß, A., De Breuck, C., Marrone, D. P., et al. 2013, ApJ, 767, 88
work page 2022
-
[80]
Zavala, J. A., Aretxaga, I., & Hughes, D. H. 2014, MNRAS, 443, 2384
work page 2014
discussion (0)
Sign in with ORCID, Apple, or X to comment. Anyone can read and Pith papers without signing in.