CaTS-Bench: Can Language Models Describe Time Series?
Pith reviewed 2026-05-18 14:46 UTC · model grok-4.3
The pith
Even advanced language models struggle to capture numeric details when describing time series, though fine-tuning on synthetic data brings major gains.
A machine-rendered reading of the paper's core claim, the machinery that carries it, and where it could break.
Core claim
We introduce CaTS-Bench, a comprehensive benchmark for Context-aware Time Series reasoning across 11 diverse domains, centered on a gold-standard evaluation set of 1746 human-rewritten captions. To address the scarcity of human-annotated data, we propose a scalable pipeline for generating high-fidelity synthetic captions. Evaluation of leading Vision-Language Models reveals that even proprietary models struggle to capture numeric nuances in temporal descriptions, while finetuning open-source models on synthetic data yields substantial performance gains.
What carries the argument
CaTS-Bench benchmark with its human gold-standard captions and synthetic caption generation pipeline for evaluating and improving time series to natural language translation.
If this is right
- Current vision-language models require targeted improvements in handling numeric and temporal aspects of data.
- Synthetic data generation can serve as an effective way to scale training for specialized description tasks.
- Diagnostic multiple-choice questions and numeric metrics can help pinpoint specific weaknesses in model reasoning.
- Releasing the benchmark provides a foundation for future research in multimodal text generation for numeric domains.
Where Pith is reading between the lines
- This benchmark could be adapted for other types of sequential data such as audio waveforms or video event sequences.
- Better time series description capabilities might lead to more useful AI summaries in fields like medical monitoring or environmental science.
- The approach of validating synthetic data against human rewrites could be applied to other data-to-text tasks where annotations are limited.
Load-bearing premise
The 1746 human-rewritten captions provide a reliable measure of effective time series narrative translation and the synthetic caption pipeline produces comparably high-fidelity outputs.
What would settle it
If fine-tuned models show no measurable improvement in numeric accuracy when tested on the human-rewritten captions compared to their base versions, this would indicate the gains from synthetic fine-tuning may not hold.
Figures


read the original abstract
Time series captioning, the task of describing time series in natural language, requires numeric and temporal reasoning, trend interpretation, and contextual understanding. Existing benchmarks, however, often rely on fully synthetic or generic captions, and typically neglect metadata and visual representations. We introduce CaTS-Bench, a comprehensive benchmark for Context-aware Time Series reasoning across 11 diverse domains, centered on a gold-standard evaluation set of 1746 human-rewritten captions that measure how effectively models translate numeric trends into immediately interpretable narratives. To address the scarcity of human-annotated data, we also propose a scalable pipeline for generating high-fidelity synthetic captions, the quality of which we validate. We evaluate leading Vision-Language Models on our benchmark, revealing that even proprietary models struggle to capture numeric nuances in temporal descriptions, while finetuning open-source models on synthetic data yields substantial performance gains. Finally, we release a diagnostic suite of 910 multiple-choice questions and use tailored numeric metrics to gauge time-series-specific reasoning capabilities, establishing CaTS-Bench as a reliable foundation for grounded, multimodal text generation in numeric domains.
Editorial analysis
A structured set of objections, weighed in public.
Referee Report
Summary. The paper introduces CaTS-Bench, a benchmark for context-aware time series captioning across 11 domains. It centers on a gold-standard set of 1746 human-rewritten captions to evaluate how well models translate numeric trends into narratives, proposes a scalable pipeline for high-fidelity synthetic captions (whose quality the authors validate), evaluates leading vision-language models (showing proprietary models struggle with numeric nuances), demonstrates substantial gains from finetuning open-source models on the synthetic data, and releases a diagnostic suite of 910 multiple-choice questions along with tailored numeric metrics for time-series-specific reasoning.
Significance. If the synthetic pipeline's fidelity holds, the benchmark fills a gap in multimodal time series evaluation by providing human-annotated references and scalable data generation, while the model evaluations and finetuning results offer concrete evidence of current limitations and improvement paths. The diagnostic suite strengthens its utility for targeted assessment of numeric and temporal reasoning.
major comments (1)
- [Abstract and synthetic pipeline validation section] Abstract and synthetic pipeline validation section: The claim that finetuning on synthetic data yields substantial performance gains depends on the synthetic captions being high-fidelity equivalents to the 1746 human gold-standard captions. However, the manuscript does not report direct quantitative side-by-side alignment metrics (e.g., trend accuracy, value precision, or scores on the diagnostic multiple-choice suite) comparing synthetic outputs to human captions across the 11 domains. Without these, the gains could arise from increased data volume or domain coverage rather than true fidelity, weakening the central interpretation.
minor comments (2)
- [Benchmark construction] The abstract mentions 'visual representations' and 'metadata' but the manuscript should clarify in the benchmark construction section how these are incorporated into the captioning task and evaluation.
- [Data description] Ensure all 11 domains are explicitly listed with example time series characteristics in the data description section for reproducibility.
Simulated Author's Rebuttal
We thank the referee for their constructive feedback on CaTS-Bench. We address the major comment regarding validation of the synthetic pipeline below.
read point-by-point responses
-
Referee: [Abstract and synthetic pipeline validation section] Abstract and synthetic pipeline validation section: The claim that finetuning on synthetic data yields substantial performance gains depends on the synthetic captions being high-fidelity equivalents to the 1746 human gold-standard captions. However, the manuscript does not report direct quantitative side-by-side alignment metrics (e.g., trend accuracy, value precision, or scores on the diagnostic multiple-choice suite) comparing synthetic outputs to human captions across the 11 domains. Without these, the gains could arise from increased data volume or domain coverage rather than true fidelity, weakening the central interpretation.
Authors: We agree that direct quantitative comparisons between synthetic and human captions would provide stronger evidence that performance gains stem from fidelity rather than scale alone. The current manuscript validates synthetic quality primarily through human preference studies and qualitative inspection of trend and value fidelity. In the revision we will add explicit side-by-side metrics: (i) trend-accuracy and value-precision scores computed on paired synthetic–human captions for each of the 11 domains, and (ii) diagnostic-suite accuracy when models are evaluated on questions derived from synthetic versus human references. These additions will allow readers to assess whether the observed gains are attributable to high-fidelity generation. revision: yes
Circularity Check
No circularity: benchmark construction and empirical evaluation are self-contained
full rationale
The paper presents CaTS-Bench as a new dataset and evaluation framework built from 1746 human-rewritten captions plus a separately proposed synthetic caption pipeline whose quality is asserted to have been validated. No equations, first-principles derivations, fitted parameters, or predictions appear in the provided text. The reported performance gains from finetuning are direct empirical measurements on the released benchmark and diagnostic suite rather than quantities forced by construction or by a self-citation chain. The central claims therefore rest on the creation and release of artifacts plus external model evaluations, with no load-bearing step that reduces to its own inputs.
Axiom & Free-Parameter Ledger
axioms (2)
- domain assumption Human-rewritten captions provide an accurate and reliable gold-standard for measuring time series description quality.
- ad hoc to paper The scalable pipeline produces high-fidelity synthetic captions whose quality can be validated against human references.
Forward citations
Cited by 1 Pith paper
-
LLaTiSA: Towards Difficulty-Stratified Time Series Reasoning from Visual Perception to Semantics
LLaTiSA is a vision-language model trained on a new 83k-sample hierarchical time series reasoning dataset that shows superior performance and out-of-distribution generalization on stratified TSR tasks.
Reference graph
Works this paper leans on
-
[1]
PAL: Program-aided Language Models
Accessed: 2025-04-03. Elizabeth Fons, Rachneet Kaur, Zhen Zeng, Soham Palande, Tucker Balch, Svitlana Vyetrenko, and Manuela Veloso. Tadacap: Time-series adaptive domain-aware captioning. InProceedings of the 5th ACM International Conference on AI in Finance, pp. 54–62, 2024. Food and Agriculture Organization of the United Nations. Faostat - food balance ...
work page internal anchor Pith review Pith/arXiv arXiv 2025
-
[2]
Xinlei Wang, Maike Feng, Jing Qiu, Jinjin Gu, and Junhua Zhao
Accessed: 2025-04-03. Xinlei Wang, Maike Feng, Jing Qiu, Jinjin Gu, and Junhua Zhao. From news to forecast: Integrating event analysis in llm-based time series forecasting with reflection.Advances in Neural Information Processing Systems, 37:58118–58153, 2024. Andrew Robert Williams, Arjun Ashok, Étienne Marcotte, Valentina Zantedeschi, Jithendaraa Subram...
-
[3]
Xiyuan Zhang, Ranak Roy Chowdhury, Rajesh K Gupta, and Jingbo Shang
URLhttps://openreview.net/forum?id=SkeHuCVFDr. Xiyuan Zhang, Ranak Roy Chowdhury, Rajesh K Gupta, and Jingbo Shang. Large language models for time series: a survey. InProceedings of the Thirty-Third International Joint Conference on Artificial Intelligence, pp. 8335–8343, 2024. Tian Zhou, Peisong Niu, Liang Sun, Rong Jin, et al. One fits all: Power genera...
work page 2024
-
[4]
Air Quality– Hourly air pollution data from 453 Indian cities (2010–2023), covering 30+ parameters including PM2.5, NOx, CO, and SO2, compiled from CPCB Jha (2023)
work page 2010
-
[5]
Customs and Border Protection U.S
Border Crossing– Monthly inbound border crossing counts at U.S.-Mexico and U.S.-Canada ports, disaggregated by transport mode and collected by U.S. Customs and Border Protection U.S. Department of Transportation (n.d.)
-
[6]
Crime– Incident-level crime reports in Los Angeles from 2020 onward, provided by LAPD OpenData and updated biweekly, including NIBRS-compliant records of Los Angeles (n.d.)
work page 2020
-
[7]
Demography– Annual global indicators from the UN and World Bank (2000–2021) covering population growth, fertility, life expectancy, death rates, and median age to assess patterns of demographic change and collapse Aziz (1985)
work page 2000
-
[8]
Injury– Annual counts of fatal and severe road traffic injuries in California (2002–2010), disaggregated by transport mode and geography, from CDPH’s Healthy Communities Indicators of Public Health (n.d.)
work page 2002
-
[9]
COVID– Global daily COVID-19 case and death counts (2020), compiled by ECDC, covering over 200 countries with population-adjusted metrics European Centre for Disease Prevention and Control (2024)
work page 2020
-
[10]
CO2 – National-level per capita CO2 emissions and GDP trends from Our World in Data, adjusted for trade (consumption-based), spanning 1990–2023 Ritchie (2021)
work page 1990
-
[11]
Calories (Diet)– Food supply and caloric intake patterns from FAO Food Balance Sheets Food and Agriculture Organization of the United Nations (2024)
work page 2024
-
[12]
Walmart– Weekly sales data from 45 Walmart stores (2010–2012), enriched with features like temperature, fuel price, CPI, unemployment rate, and holiday flags Hassan (2020)
work page 2010
-
[13]
Retail– Transactional records from a UK-based online gift retailer (2010–2011), capturing item-level purchases, cancellations, and customer behavior Chen (2015). 16 Preprint
work page 2010
-
[14]
Agriculture– Annual agricultural total factor productivity (TFP) indices from USDA for 1961– 2022, covering outputs and inputs like land, labor, capital, and materials across countries USDA Economic Research Service (2024). C TIMESERIESSEGMENTCROPPING Our cropping strategy balances diversity with consistency across datasets. Many source time series (e.g.,...
-
[15]
2.Reversed:[3,2,1], avoids reasoning without trend awareness
Shuffled: [2,1,3], avoids answering correctly by exploiting numeric lookup without temporal order awareness. 2.Reversed:[3,2,1], avoids reasoning without trend awareness. 33 Preprint
-
[16]
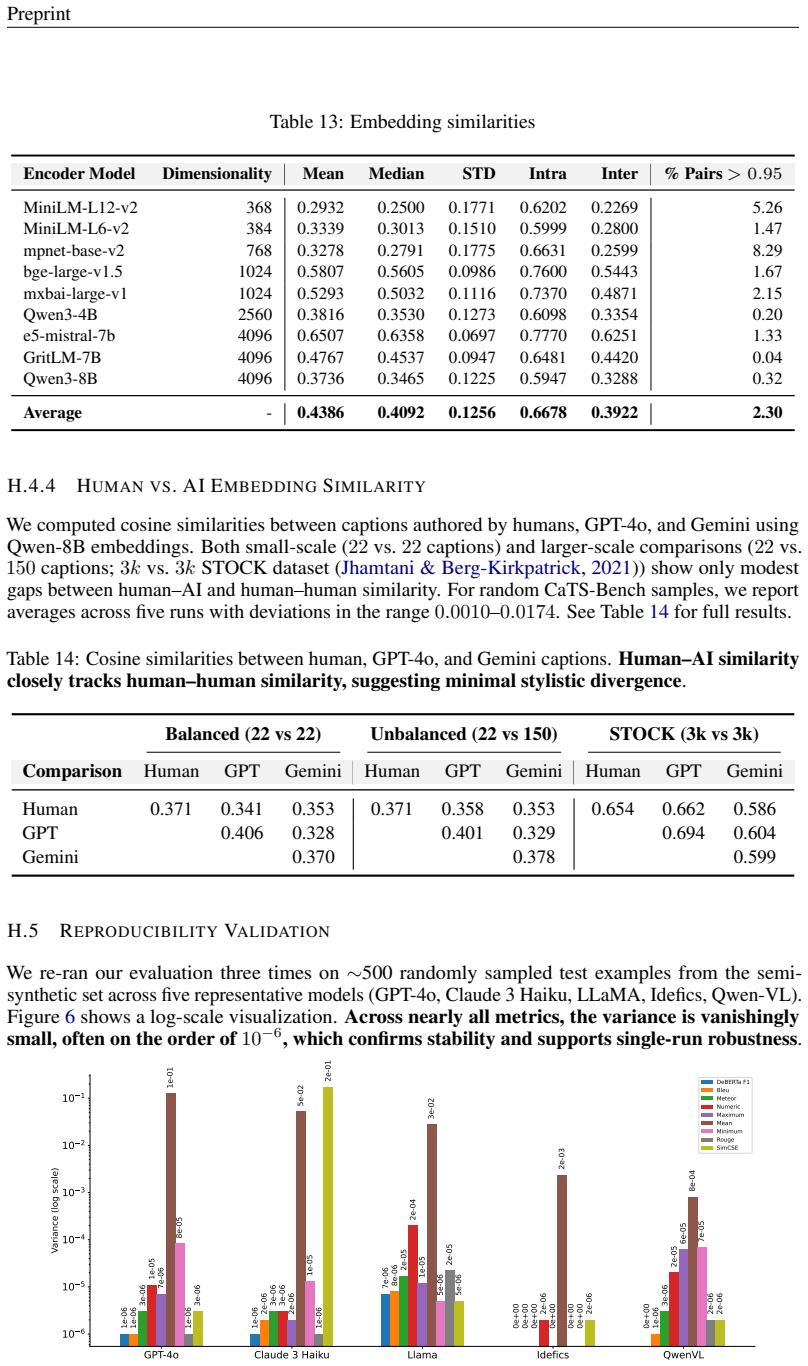
Gaussian-noised: [1.03, 1.99, 3.002] , forces precise numeric reasoning instead of superficial numeric and trend similarity. Table 19: Qwen-2.5-Omni-7B accuracy by task and distractor type. Question Type Distractor Type Accuracy Time Series Matching Cross-domain 0.9803 Time Series Matching Same-domain 0.9586 Time Series Matching Artificially Perturbed 0.6...
work page 2015
-
[17]
Removal of external speculation:Captions were restricted strictly to information verifiable from the metadata, time series, and plot, avoiding any causal claims or conjecture not grounded in the time series values or provided metadata
-
[18]
Variation in phrasing:To reduce repetitiveness, sentence openings and phrases were varied rather than uniformly beginning and phrasing the same sentences
-
[19]
Pattern summarization:When trends or unique structures (such as V-shaped or monotonic movements, etc.) were clearly visible, they were explicitly noted
-
[20]
Quantitative grounding:Values such as maxima, minima, averages, and percentage changes were consistently included when relevant to ensure captions remained data-driven
-
[21]
Consistency with variation:While maintaining factual accuracy and grounding in the data, captions were intentionally varied in structure and style to avoid monotony and ensure more natural, human-like phrasing across the dataset. This systematic review process resulted in captions that were both faithful to the underlying data and stylistically coherent a...
-
[22]
You are an expert coding assistant; think through the task **step-by-step**
-
[23]
* Use only the Python Standard Library (e.g., you may use the ‘math‘, ‘statistics‘ libraries)
Write **Python 3.12 ** code (inside one ‘‘‘python‘‘‘ block) that computes the final answer. * Use only the Python Standard Library (e.g., you may use the ‘math‘, ‘statistics‘ libraries). * Wrap everything in a ‘solve()‘ function that will be invoked to produce the final caption. * The code **must produce the caption string itself **. Any numeric values ca...
-
[24]
The ‘solve()‘ function you write will be invoked to produce the final caption. ### Output format (exactly; no extra text, explanations, or formatting) ‘‘‘python # code that defines solve() and any desired strings solve() ‘‘‘ The full TSC prompt from N.2 is injected as thecaption_promptstring. N.5 SEMANTICPERTURBATIONPROMPT To perturb a caption so that its...
discussion (0)
Sign in with ORCID, Apple, or X to comment. Anyone can read and Pith papers without signing in.