Phenotype discovery of traumatic brain injury segmentations from heterogeneous multi-site data
Pith reviewed 2026-05-18 01:33 UTC · model grok-4.3
The pith
Harmonized multi-site MRI data reveals volume differences in 37 brain regions between TBI patients and controls.
A machine-rendered reading of the paper's core claim, the machinery that carries it, and where it could break.
Core claim
By harmonizing heterogeneous multi-site T1-weighted images to a local dataset and segmenting 132 regions of interest, the study calculates volumes and z-scores for all participants. After regressing out sex, age, and total brain volume, independent t-tests with false discovery rate correction find significant differences in 37 ROIs between TBI subjects and controls. Independent component analysis applied to the component loadings of TBI cases shows these differences arise from three main patterns: the brainstem, occipital pole and structures posterior to the orbit; subcortical gray matter and insular cortex; and cerebral and cerebellar white matter.
What carries the argument
Harmonization of multi-site T1-weighted MRI followed by automated segmentation of 132 ROIs, z-score normalization against controls, and independent component analysis on the resulting volume data to extract injury phenotypes.
If this is right
- The three identified injury patterns could serve as candidate phenotypes for stratifying TBI patients in future clinical trials.
- Volume changes in these ROIs might be tracked longitudinally to monitor recovery or progression after injury.
- The pipeline supports combining data from new sites without requiring identical scanners or protocols.
- Correlating the component loadings with clinical scores could strengthen links between structure and function.
- Outlier removal and quality assurance steps reduce the chance that site-specific noise drives the reported differences.
Where Pith is reading between the lines
- Extending the approach to include diffusion or functional MRI could test whether the same regions show connectivity changes.
- Applying the method to pediatric or mild TBI cohorts might reveal age-specific patterns not captured here.
- If the phenotypes prove stable, they could be used to select patients for targeted rehabilitation focused on affected pathways.
- Testing the pipeline on other heterogeneous neurological datasets would show whether the harmonization plus ICA step generalizes beyond TBI.
Load-bearing premise
Harmonization of heterogeneous multi-site T1-weighted images combined with automated segmentation of 132 ROIs produces volume measurements that accurately reflect true structural differences rather than acquisition artifacts or segmentation errors.
What would settle it
Re-running the group comparisons on the same scans without the harmonization step or against a small set of manually segmented volumes to check whether the 37 significant ROIs remain or vanish.
Figures


read the original abstract
Traumatic brain injury (TBI) is intrinsically heterogeneous, and typical clinical outcome measures like the Glasgow Coma Scale complicate this diversity. The large variability in severity and patient outcomes render it difficult to link structural damage to functional deficits. The Federal Interagency Traumatic Brain Injury Research (FITBIR) repository contains large-scale multi-site magnetic resonance imaging data of varying resolutions and acquisition parameters (25 shared studies with 7,693 sessions that have age, sex and TBI status defined - 5,811 TBI and 1,882 controls). To reveal shared pathways of injury of TBI through imaging, we analyzed T1-weighted images from these sessions by first harmonizing to a local dataset and segmenting 132 regions of interest (ROIs) in the brain. After running quality assurance, calculating the volumes of the ROIs, and removing outliers, we calculated the z-scores of volumes for all participants relative to the mean and standard deviation of the controls. We regressed out sex, age, and total brain volume with a multivariate linear regression, and we found significant differences in 37 ROIs between subjects with TBI and controls (p < 0.05 with independent t-tests with false discovery rate correction). We found that differences originated in 1) the brainstem, occipital pole and structures posterior to the orbit, 2) subcortical gray matter and insular cortex, and 3) cerebral and cerebellar white matter using independent component analysis and clustering the component loadings of those with TBI.
Editorial analysis
A structured set of objections, weighed in public.
Referee Report
Summary. The manuscript analyzes heterogeneous multi-site T1-weighted MRI data from the FITBIR repository (25 studies, 7,693 sessions) to discover phenotypes of traumatic brain injury (TBI). The pipeline involves harmonizing images to a local dataset, segmenting 132 regions of interest (ROIs), quality assurance, outlier removal, z-scoring volumes relative to controls, multivariate regression for covariates (sex, age, total brain volume), and identifying 37 significant ROI differences using independent t-tests with FDR correction. Independent component analysis (ICA) followed by clustering of component loadings in TBI subjects reveals three clusters of injury origins: (1) brainstem, occipital pole and structures posterior to the orbit; (2) subcortical gray matter and insular cortex; (3) cerebral and cerebellar white matter.
Significance. If the harmonization and segmentation steps are shown to be valid, the work could contribute to phenotype discovery in heterogeneous TBI by exploiting a large public dataset and standard tools (multivariate regression, FDR-corrected t-tests, ICA, and clustering). Strengths include use of external public data, large sample size, and absence of circular derivations or self-referential parameters. The reported regional patterns would then provide falsifiable structural hypotheses for follow-up studies.
major comments (1)
- [Methods (harmonization and segmentation)] Methods (harmonization and segmentation): The pipeline harmonizes multi-site T1 images (varying resolutions/parameters across 25 studies) to an unspecified local dataset then applies automated segmentation of 132 ROIs, yet reports no validation metrics (e.g., Dice scores, manual-label correlations, or post-harmonization site-effect diagnostics such as residual batch-effect tests). TBI pathology (lesions, atrophy) is known to degrade standard automated tools; without these checks the 37 significant ROI differences and the three ICA-derived clusters cannot be confidently attributed to biology rather than acquisition artifacts or segmentation failure.
minor comments (2)
- [Abstract] Abstract: The number of ICA components and the clustering method (e.g., k-means, hierarchical) are not stated; it is unclear whether component count was pre-specified or data-driven.
- [Abstract] Abstract: Outlier removal and quality-assurance criteria are mentioned but not specified (e.g., volume thresholds, visual inspection protocol), limiting reproducibility.
Simulated Author's Rebuttal
We thank the referee for their constructive comments on our manuscript. We address the major concern regarding validation of the harmonization and segmentation pipeline below.
read point-by-point responses
-
Referee: Methods (harmonization and segmentation): The pipeline harmonizes multi-site T1 images (varying resolutions/parameters across 25 studies) to an unspecified local dataset then applies automated segmentation of 132 ROIs, yet reports no validation metrics (e.g., Dice scores, manual-label correlations, or post-harmonization site-effect diagnostics such as residual batch-effect tests). TBI pathology (lesions, atrophy) is known to degrade standard automated tools; without these checks the 37 significant ROI differences and the three ICA-derived clusters cannot be confidently attributed to biology rather than acquisition artifacts or segmentation failure.
Authors: We appreciate the referee highlighting the importance of validation for harmonization and segmentation. The manuscript states that quality assurance and outlier removal were performed after segmentation of the 132 ROIs. We agree that more explicit metrics and diagnostics would strengthen the work. In the revised manuscript we will specify the harmonization procedure and reference dataset, add post-harmonization site-effect diagnostics (e.g., residual batch-effect tests or PCA on volumes), and expand the discussion to address potential effects of TBI pathology on automated segmentation while describing how our QA and outlier removal steps were designed to mitigate segmentation failures. We will also cite published validation performance of the segmentation tool in TBI cohorts. These additions will support attribution of the 37 ROI differences and three clusters to biological patterns. revision: partial
Circularity Check
No circularity: standard empirical pipeline on external data
full rationale
The paper describes an empirical analysis pipeline on the public FITBIR repository: harmonization of multi-site T1 images to a local dataset, automated segmentation of 132 ROIs, outlier removal, z-scoring against controls, covariate regression, FDR-corrected t-tests, ICA, and clustering of component loadings. No mathematical derivations, first-principles predictions, or fitted parameters are presented that reduce by construction to the inputs or to self-citations. All steps rely on external public data and standard statistical tools with no load-bearing self-citation chains, uniqueness theorems, or ansatzes that define the reported ROI differences or clusters. The central claims remain independent of any circular reduction.
Axiom & Free-Parameter Ledger
axioms (2)
- domain assumption Controls provide an appropriate reference distribution for computing z-scores of ROI volumes in TBI subjects.
- domain assumption Multivariate linear regression fully removes confounding effects of sex, age, and total brain volume on ROI volumes.
Lean theorems connected to this paper
-
IndisputableMonolith/Foundation/RealityFromDistinction.leanreality_from_one_distinction unclear?
unclearRelation between the paper passage and the cited Recognition theorem.
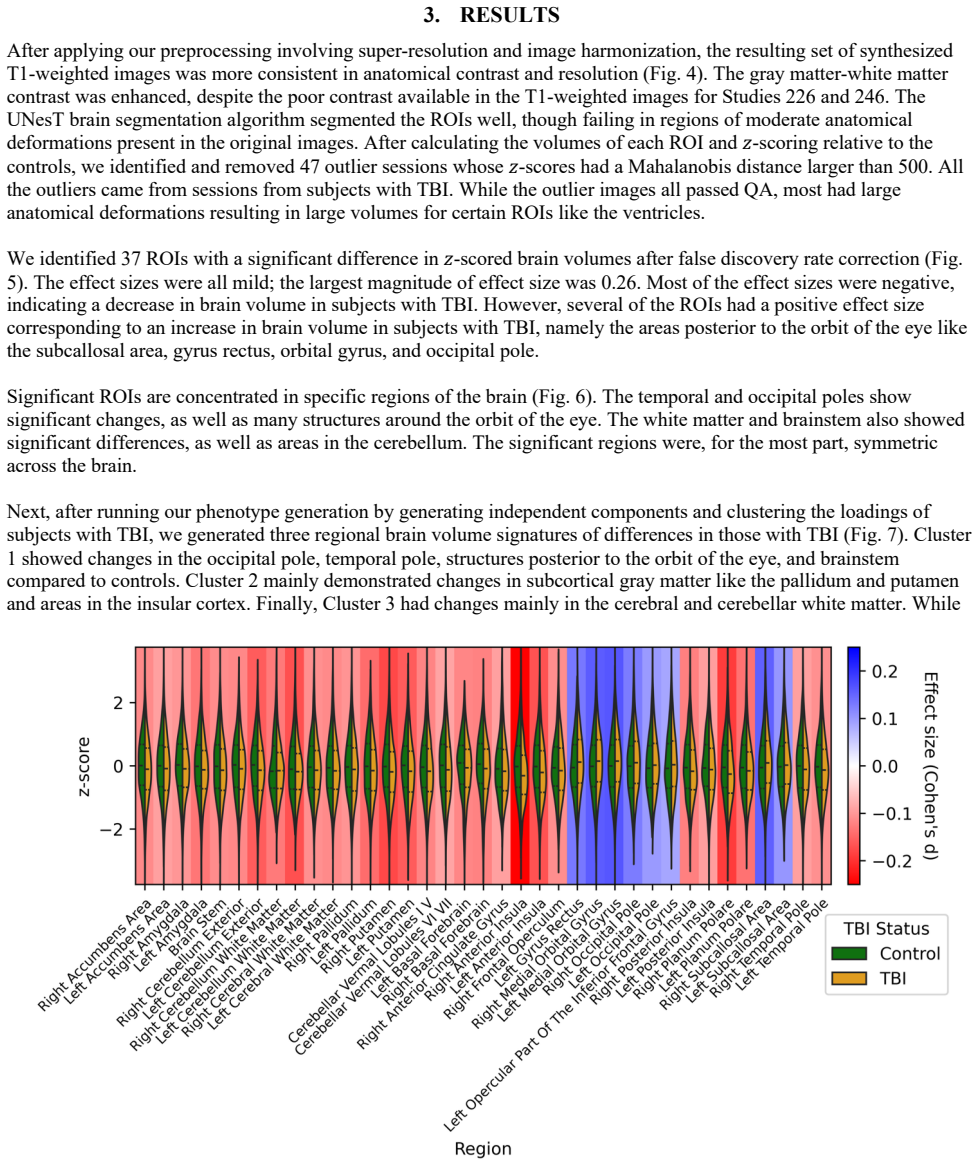
We regressed out sex, age, and total brain volume with a multivariate linear regression, and we found significant differences in 37 ROIs between subjects with TBI and controls (p < 0.05 with independent t-tests with false discovery rate correction). We found that differences originated in 1) the brainstem, occipital pole and structures posterior to the orbit, 2) subcortical gray matter and insular cortex, and 3) cerebral and cerebellar white matter using independent component analysis and clustering the component loadings of those with TBI.
What do these tags mean?
- matches
- The paper's claim is directly supported by a theorem in the formal canon.
- supports
- The theorem supports part of the paper's argument, but the paper may add assumptions or extra steps.
- extends
- The paper goes beyond the formal theorem; the theorem is a base layer rather than the whole result.
- uses
- The paper appears to rely on the theorem as machinery.
- contradicts
- The paper's claim conflicts with a theorem or certificate in the canon.
- unclear
- Pith found a possible connection, but the passage is too broad, indirect, or ambiguous to say the theorem truly supports the claim.
Reference graph
Works this paper leans on
-
[1]
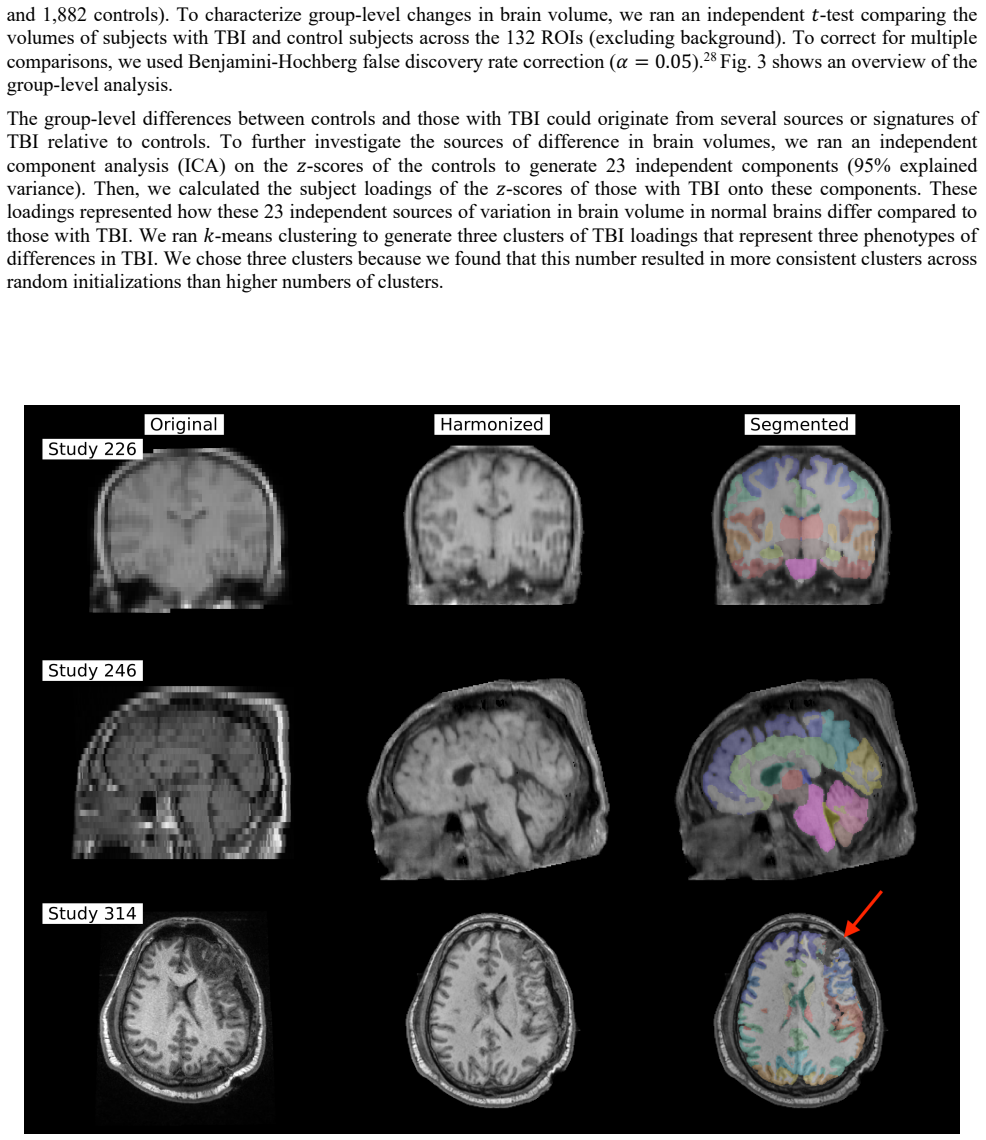
RESULTS After applying our preprocessing involving super-resolution and image harmonization, the resulting set of synthesized T1-weighted images was more consistent in anatomical contrast and resolution (Fig. 4). The gray matter-white matter contrast was enhanced, despite the poor contrast available in the T1-weighted images for Studies 226 and 246. The U...
work page 2021
-
[2]
N4ITK: Improved N3 Bias Correction,
Tustison, N. J., Avants, B. B., Cook, P. A., Yuanjie Zheng, Egan, A., Yushkevich, P. A. and Gee, J. C., “N4ITK: Improved N3 Bias Correction,” IEEE Trans Med Imaging 29(6), 1310–1320 (2010). [26] Fonov, V., Evans, A. C., Botteron, K., Almli, C. R., McKinstry, R. C. and Collins, D. L., “Unbiased average age-appropriate atlases for pediatric studies,” Neuroi...
work page 2010
discussion (0)
Sign in with ORCID, Apple, or X to comment. Anyone can read and Pith papers without signing in.