Recognition: 2 theorem links
· Lean TheoremDoes Entry of Food-and-Drink Establishments Raise Local House Prices? Event-Study Evidence from London
Pith reviewed 2026-05-15 16:14 UTC · model grok-4.3
The pith
Food-and-drink establishments raise nearby house prices by 3.4 to 3.7 percent over five years in London neighborhoods.
A machine-rendered reading of the paper's core claim, the machinery that carries it, and where it could break.
Core claim
Using an annual event-study design on London LSOA-level data, the first clean entry of multiple food-and-drink establishments produces a gradual rise in log house prices that reaches 3.4-3.7 percent by the fourth and fifth post-event years, with no detectable pre-trends under stacked or Sun-Abraham estimation.
What carries the argument
The event-study treatment definition: the first year an LSOA records at least two eligible EPC lodgements for food-and-drink establishments following a two-year clean lookback with no prior entries.
If this is right
- Log house prices rise about 0.5 percent in the event year and continue climbing to 3.4-3.7 percent by years four and five.
- Both the stacked and Sun-Abraham estimators produce pre-trend tests that are not rejected.
- The price path is consistent with gradual capitalization of local commercial amenities.
- Results hold after linking registry prices to non-domestic EPC timings and neighborhood amenity measures.
Where Pith is reading between the lines
- The gradual five-year buildup implies that effects may compound as neighborhoods become more appealing over time.
- Policies that facilitate such entries could indirectly support higher property values if the timing assumption holds.
- Concurrent redevelopment or other unmeasured changes could still contribute to the observed price gains.
- Similar event-study designs could be applied to other cities with comparable business-entry records to test generalizability.
Load-bearing premise
The timing of first clean food-and-drink entry is not driven by unobserved factors that also affect house prices.
What would settle it
A replication that finds statistically significant pre-event price trends or no post-entry price increase after applying the same two-year clean lookback and two-lodgement threshold would undermine the central result.
Figures


read the original abstract
Restaurants, cafes, pubs, and takeaways are among the most visible markers of neighborhood change, yet whether their arrival is capitalised into nearby housing values remains empirically unsettled. We assemble a London-wide panel linking Land Registry prices, non-domestic EPC lodgement timings for food-and-drink establishments, and neighborhood amenity measures at the LSOA level. Our preferred annual event-study design defines treatment as the first clean-onset year in which an LSOA records at least two eligible EPC lodgements for food-and-drink establishments, after a two-year lookback with no prior entries. In this specification, pre-trend tests are not rejected in either the stacked or Sun-Abraham estimators, and log house prices rise gradually from about 0.5% in the event year to roughly 3.4--3.7% by years four and five. The results are consistent with local amenity capitalization following commercial entry, while remaining appropriately cautious about endogenous siting and concurrent redevelopment.
Editorial analysis
A structured set of objections, weighed in public.
Referee Report
Summary. The manuscript examines whether the entry of food-and-drink establishments (restaurants, cafes, pubs, takeaways) raises local house prices in London using an annual event-study design at the LSOA level. It links Land Registry transaction prices to non-domestic EPC lodgement timings, defining treatment as the first clean-onset year with at least two eligible food-and-drink EPC lodgements after a two-year lookback with no prior entries. The preferred specifications employ stacked and Sun-Abraham estimators; pre-trend tests are not rejected, and log house prices are reported to rise gradually from approximately 0.5% in the event year to 3.4--3.7% by event years four and five. The authors interpret the results as evidence of local amenity capitalization while cautioning about endogenous siting and concurrent redevelopment.
Significance. If the identifying assumptions hold, the paper contributes to the urban economics literature on amenity capitalization and neighborhood change by providing event-study evidence from high-resolution administrative data. The gradual post-entry price trajectory is consistent with cumulative local improvements, and the use of multiple modern event-study estimators plus explicit pre-trend testing strengthens credibility relative to simpler designs. The modest effect sizes (under 4%) are plausible for a single amenity type and underscore that such entries are not a primary driver of house-price appreciation.
major comments (2)
- [Empirical Strategy] Empirical Strategy section: The central identifying assumption is that the timing of first clean food-and-drink entry is conditionally exogenous to house-price trajectories conditional on LSOA and time fixed effects. Pre-trend tests in the stacked and Sun-Abraham estimators rule out differential pre-trends but do not address the possibility of concurrent unobserved shocks (e.g., simultaneous non-food commercial entries, planning permissions, or infrastructure upgrades) that could jointly influence siting and subsequent prices. The abstract itself flags endogenous siting and redevelopment, yet the reported specifications appear to rely primarily on the two-way FE without explicit controls or robustness checks for these co-occurring changes.
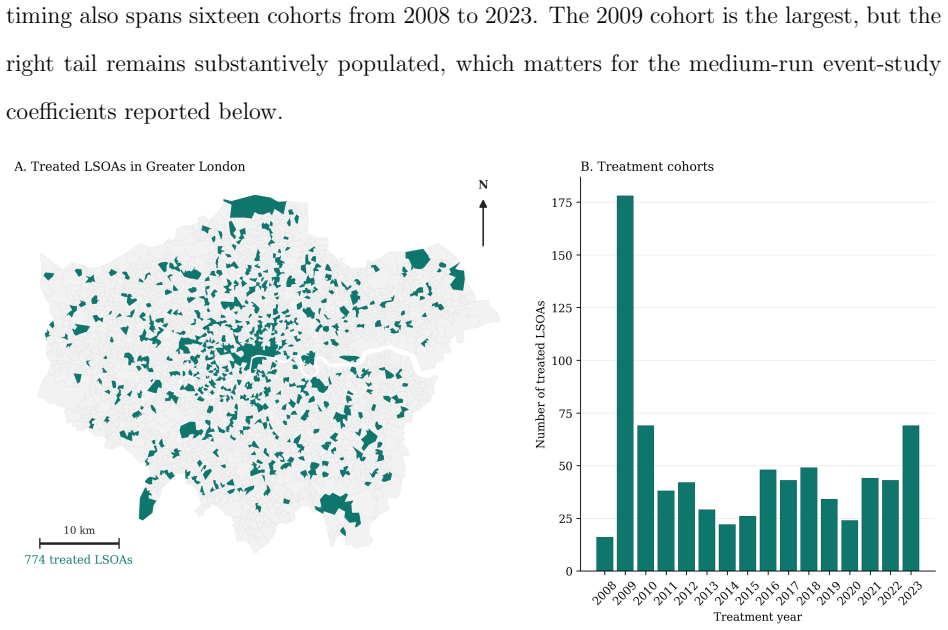
- [Results] Results section (event-study estimates): The reported post-event coefficients (0.5% in year 0 rising to 3.4--3.7% by years 4--5) are described as stable across estimators, but without tabulated information on the number of treated LSOAs, the distribution of event timings, or the share of observations in long post-periods, it is difficult to evaluate whether the later-year estimates are driven by a small number of early-treated units or by compositional changes in the sample.
minor comments (2)
- [Abstract] Abstract: The phrase 'at least two eligible EPC lodgements' should be defined more precisely (e.g., what constitutes eligibility for food-and-drink use) to allow readers to assess measurement error in the treatment variable.
- [Data] Data section: Provide summary statistics on the number of LSOAs, total transactions, and the share of LSOAs that ever receive treatment to contextualize the external validity of the London-specific estimates.
Simulated Author's Rebuttal
We thank the referee for the constructive comments, which help clarify the strengths and limitations of our empirical approach. We address each major point below and indicate planned revisions to improve transparency and robustness.
read point-by-point responses
-
Referee: [Empirical Strategy] Empirical Strategy section: The central identifying assumption is that the timing of first clean food-and-drink entry is conditionally exogenous to house-price trajectories conditional on LSOA and time fixed effects. Pre-trend tests in the stacked and Sun-Abraham estimators rule out differential pre-trends but do not address the possibility of concurrent unobserved shocks (e.g., simultaneous non-food commercial entries, planning permissions, or infrastructure upgrades) that could jointly influence siting and subsequent prices. The abstract itself flags endogenous siting and redevelopment, yet the reported specifications appear to rely primarily on the two-way FE without explicit controls or robustness checks for these co-occurring changes.
Authors: We agree that pre-trend tests do not fully rule out concurrent unobserved shocks and that the two-way fixed effects design leaves room for such concerns. The manuscript already notes endogenous siting and redevelopment in the abstract and discussion, but we accept that more explicit robustness checks would be valuable. In revision we will add controls for contemporaneous non-food commercial EPC entries (using the same data source) and, where feasible, planning-permission indicators; we will also report how these additions affect the main estimates and expand the limitations paragraph to discuss remaining threats from infrastructure or redevelopment shocks. revision: partial
-
Referee: [Results] Results section (event-study estimates): The reported post-event coefficients (0.5% in year 0 rising to 3.4--3.7% by years 4--5) are described as stable across estimators, but without tabulated information on the number of treated LSOAs, the distribution of event timings, or the share of observations in long post-periods, it is difficult to evaluate whether the later-year estimates are driven by a small number of early-treated units or by compositional changes in the sample.
Authors: We appreciate this suggestion for greater transparency. The revised manuscript will include a new appendix table (and a brief reference in the main text) reporting the number of treated LSOAs, the distribution of event-year timings, and the number of observations underlying each event-time coefficient. This information will allow readers to assess whether the longer-horizon estimates rest on a thin sample or compositional shifts. revision: yes
Circularity Check
No circularity in empirical event-study design
full rationale
The paper is an empirical analysis linking external Land Registry house-price data and non-domestic EPC lodgement records at the LSOA level. Treatment is defined as the first clean-onset year with at least two eligible food-and-drink EPC lodgements after a two-year lookback; this is an observable-data rule, not a self-referential definition. The preferred specification applies standard stacked and Sun-Abraham event-study estimators with LSOA and time fixed effects. No equations reduce by construction to fitted parameters, no self-citation chain supplies the central identifying assumption, and no ansatz or uniqueness claim is smuggled in. Pre-trend tests and gradual post-event price increases are reported as data outcomes, not tautological predictions. The analysis is therefore self-contained against external benchmarks.
Axiom & Free-Parameter Ledger
axioms (1)
- domain assumption Parallel trends assumption holds conditional on the included controls and fixed effects
Lean theorems connected to this paper
-
IndisputableMonolith/Foundation/RealityFromDistinction.leanreality_from_one_distinction unclear?
unclearRelation between the paper passage and the cited Recognition theorem.
Our preferred annual event-study design defines treatment as the first clean-onset year in which an LSOA records at least two eligible EPC lodgements... pre-trend tests are not rejected in either the stacked or Sun-Abraham estimators
-
IndisputableMonolith/Cost/FunctionalEquation.leanwashburn_uniqueness_aczel unclear?
unclearRelation between the paper passage and the cited Recognition theorem.
log house prices rise gradually from about 0.5% in the event year to roughly 3.4--3.7% by years four and five
What do these tags mean?
- matches
- The paper's claim is directly supported by a theorem in the formal canon.
- supports
- The theorem supports part of the paper's argument, but the paper may add assumptions or extra steps.
- extends
- The paper goes beyond the formal theorem; the theorem is a base layer rather than the whole result.
- uses
- The paper appears to rely on the theorem as machinery.
- contradicts
- The paper's claim conflicts with a theorem or certificate in the canon.
- unclear
- Pith found a possible connection, but the passage is too broad, indirect, or ambiguous to say the theorem truly supports the claim.
Reference graph
Works this paper leans on
-
[1]
Zukin, S., Trujillo, V., Frase, P., Jackson, D., Recuber, T., & Walker, A. (2009). New retail capital and neighborhood change.City & Community, 8(1), 47–64
work page 2009
-
[2]
Smith, N. (1979). Toward a theory of gentrification: A back to the city movement by capital, not people.Journal of the American Planning Association, 45(4), 538–548
work page 1979
-
[3]
Ley, D. (2003). Artists, aestheticisation and the field of gentrification.Urban Studies, 40(12), 2527–2544
work page 2003
-
[4]
(1982).Loft Living: Culture and Capital in Urban Change
Zukin, S. (1982).Loft Living: Culture and Capital in Urban Change. Johns Hopkins University Press
work page 1982
-
[5]
Butler, T. (2003). Living in the bubble: Gentrification and its ‘others’ in North London. Urban Studies, 40(12), 2469–2486
work page 2003
-
[6]
Guerrieri, V., Hartley, D., & Hurst, E. (2013). Endogenous gentrification and housing price dynamics.Journal of Public Economics, 100, 45–60. 16
work page 2013
-
[7]
Dub´ e, J., Legros, D., Th´ eriault, M., & Des Rosiers, F. (2014). A spatial difference-in- differences estimator to evaluate the effect of change in public mass transit systems on house prices.Transportation Research Part B, 64, 24–40
work page 2014
-
[8]
Heckert, M., & Mennis, J. (2012). The economic impact of greening urban vacant land: A spatial difference-in-differences analysis.Environment and Planning B, 39(6), 1105– 1121
work page 2012
-
[9]
Wang, J., & Deng, K. (2022). Impact and mechanism analysis of smart city policy on urban innovation: Evidence from China.Economic Analysis and Policy, 73, 574–592
work page 2022
-
[10]
Dong, L., Du, R., Kahn, M., Ratti, C., & Zheng, S. (2021). “Ghost cities” versus boom towns: Do China’s high-speed rail new towns thrive?Regional Science and Urban Economics, 89, 103682
work page 2021
-
[11]
Reades, J., De Souza, J., & Hubbard, P. (2019). Understanding urban gentrification through machine learning.Urban Studies, 56(5), 922–942
work page 2019
-
[12]
Atkinson, R. (2000). Measuring gentrification and displacement in Greater London. Urban Studies, 37(1), 149–165
work page 2000
-
[13]
Liu, C., & Bardaka, E. (2023). Transit-induced commercial gentrification: Causal infer- ence through a difference-in-differences analysis of business microdata.Transportation Research Part A, 175, 103788
work page 2023
-
[14]
Hackworth, J., & Smith, N. (2002). The changing state of gentrification.Tijdschrift voor Economische en Sociale Geografie, 92(4), 464–477
work page 2002
-
[15]
Glass, R. (1964). Introduction to London: Aspects of change.Centre for Urban Studies
work page 1964
-
[16]
Barton, M. (2016). An exploration of the importance of the strategy used to identify gentrification.Urban Studies, 53(1), 92–111. 17
work page 2016
-
[17]
Hillsdon, M., Panter, J., Foster, C., & Jones, A. (2006). The relationship between access and quality of urban green space with population physical activity.Public Health, 120(12), 1127–1132
work page 2006
-
[18]
Wolch, J. R., Byrne, J., & Newell, J. P. (2014). Urban green space, public health, and environmental justice.Landscape and Urban Planning, 125, 234–244
work page 2014
-
[19]
Greco, S., Ishizaka, A., Tasiou, M., & Torrisi, G. (2019). On the methodological frame- work of composite indices.Social Indicators Research, 141(1), 61–94
work page 2019
-
[20]
Decancq, K., & Lugo, M. A. (2013). Weights in multidimensional indices of wellbeing: An overview.Econometric Reviews, 32(1), 7–34
work page 2013
-
[21]
Anselin, L. (2006). Spatial econometrics. InPalgrave Handbook of Econometrics, Vol. 1, pp. 901–969
work page 2006
-
[22]
Goodman-Bacon, A. (2021). Difference-in-differences with variation in treatment timing. Journal of Econometrics, 225(2), 254–277
work page 2021
-
[23]
Sun, L., & Abraham, S. (2021). Estimating dynamic treatment effects in event studies with heterogeneous treatment effects.Journal of Econometrics, 225(2), 175–199
work page 2021
-
[24]
Freeman, L. (2005). Displacement or succession? Residential mobility in gentrifying neighborhoods.Urban Affairs Review, 40(4), 463–491. 18
work page 2005
discussion (0)
Sign in with ORCID, Apple, or X to comment. Anyone can read and Pith papers without signing in.