The Infinite-Dimensional Nature of Spectroscopy and Why Models Succeed, Fail, and Mislead
Pith reviewed 2026-05-10 18:53 UTC · model grok-4.3
The pith
Spectroscopic data's infinite dimensionality lets ML models separate even infinitesimal noise differences with perfect accuracy.
A machine-rendered reading of the paper's core claim, the machinery that carries it, and where it could break.
Core claim
Even infinitesimal distributional differences in spectral data, whether from noise, preprocessing, or artefacts, become perfectly separable in high-dimensional spaces according to the Feldman-Hajek theorem and concentration of measure; experiments on synthetic and real fluorescence spectra demonstrate that models achieve near-perfect accuracy without any underlying chemical distinctions, while feature-importance maps highlight regions unrelated to the spectra's chemical content.
What carries the argument
The effective infinite-dimensional character of spectral data, which amplifies minuscule distributional shifts into perfect separability via the Feldman-Hajek theorem and concentration of measure.
If this is right
- ML classifiers can reach high reported accuracy on spectroscopic tasks without learning chemically meaningful features.
- Feature-importance methods will frequently highlight regions that carry no chemical information.
- Standard cross-validation may not detect when separation relies on artefacts rather than chemistry.
- Preprocessing steps such as normalization can create or amplify spurious separability.
- Model reliability in spectroscopy requires explicit checks for whether separation persists under controlled chemical conditions.
Where Pith is reading between the lines
- Practitioners may need dimensionality-reduction or representation-learning steps that explicitly preserve chemical invariants before applying classifiers.
- Similar high-dimensional separation effects could appear in other scientific domains that produce dense spectral or waveform data.
- Interpretability techniques beyond feature importance, such as counterfactual generation under chemical constraints, become necessary to distinguish artefact-driven from chemistry-driven decisions.
Load-bearing premise
Real spectroscopic measurements behave enough like infinite-dimensional random variables whose differences are purely distributional rather than tied to underlying chemical structure.
What would settle it
A controlled experiment on fluorescence spectra where class labels are assigned randomly or by non-chemical criteria yet models trained after standard preprocessing still fail to reach near-perfect accuracy.
Figures


read the original abstract
Machine learning (ML) models have achieved strikingly high accuracies in spectroscopic classification tasks, often without a clear proof that those models used chemically meaningful features. Existing studies have linked these results to data preprocessing choices, noise sensitivity, and model complexity, but no unifying explanation is available so far. In this work, we show that these phenomena arise naturally from the intrinsic high dimensionality of spectral data. Using a theoretical analysis grounded in the Feldman-Hajek theorem and the concentration of measure, we show that even infinitesimal distributional differences, caused by noise, normalisation, or instrumental artefacts, may become perfectly separable in high-dimensional spaces. Through a series of specific experiments on synthetic and real fluorescence spectra, we illustrate how models can achieve near-perfect accuracy even when chemical distinctions are absent, and why feature-importance maps may highlight spectrally irrelevant regions. We provide a rigorous theoretical framework, confirm the effect experimentally, and conclude with practical recommendations for building and interpreting ML models in spectroscopy.
Editorial analysis
A structured set of objections, weighed in public.
Referee Report
Summary. The paper claims that the strikingly high accuracies of ML models on spectroscopic classification arise from the intrinsic high (effectively infinite) dimensionality of spectral data. Grounded in the Feldman-Hajek theorem and concentration-of-measure phenomena, it argues that even infinitesimal distributional shifts induced by noise, normalization, or instrumental artifacts become perfectly separable, allowing models to succeed without using chemically meaningful features; this is illustrated via experiments on synthetic and real fluorescence spectra, with accompanying practical recommendations for model building and interpretation.
Significance. If the central theoretical link holds, the work supplies a unifying explanation for otherwise puzzling ML behaviors in spectroscopy, including sensitivity to preprocessing and misleading feature attributions. It applies standard infinite-dimensional probability results to a concrete domain and backs the argument with targeted experiments, which could usefully inform best practices and caution against over-interpreting black-box models on spectral data.
major comments (2)
- [Theoretical analysis] Theoretical analysis section: the claim that infinitesimal distributional differences become perfectly separable rests on the Feldman-Hajek theorem for mutually singular Gaussian measures on Hilbert space. Real fluorescence spectra, however, are finite-dimensional vectors in R^D (D typically 500–2000 after discretization). The manuscript must explicitly verify that the observed perturbations (noise, normalization) place the mean shift outside the Cameron-Martin space or alter the covariance operator in the manner required for singularity; otherwise the “perfect separability” conclusion does not follow from the cited theorem.
- [Experiments] Experimental section on synthetic and real spectra: the reported near-perfect accuracies are consistent with concentration-of-measure effects in large but finite D, yet the experiments do not include a controlled comparison that isolates the infinite-dimensional singularity mechanism (e.g., by varying D while holding chemical content fixed, or by checking equivalence vs. singularity of the induced measures). Without such controls, it remains possible that the observed separability arises from ordinary finite-dimensional geometry rather than the Feldman-Hajek phenomenon.
minor comments (2)
- [Abstract and introduction] The abstract states that the work provides “a rigorous theoretical framework,” but the main text should include the precise statement of the Feldman-Hajek conditions that are being invoked and the mapping from spectral preprocessing steps to those conditions.
- [Notation and definitions] Notation for the spectral measures and the covariance operators should be introduced once and used consistently; several passages refer to “distributional differences” without specifying whether these are in total variation, Hellinger, or another metric.
Simulated Author's Rebuttal
We thank the referee for the constructive comments, which help clarify the scope and limitations of our theoretical framework. We respond to each major comment below and indicate the revisions we will incorporate.
read point-by-point responses
-
Referee: [Theoretical analysis] Theoretical analysis section: the claim that infinitesimal distributional differences become perfectly separable rests on the Feldman-Hajek theorem for mutually singular Gaussian measures on Hilbert space. Real fluorescence spectra, however, are finite-dimensional vectors in R^D (D typically 500–2000 after discretization). The manuscript must explicitly verify that the observed perturbations (noise, normalization) place the mean shift outside the Cameron-Martin space or alter the covariance operator in the manner required for singularity; otherwise the “perfect separability” conclusion does not follow from the cited theorem.
Authors: We agree that the Feldman-Hajek theorem applies strictly in infinite-dimensional Hilbert spaces and that discretized spectra live in finite-dimensional R^D. Our argument treats the high-D regime (D ≫ 1) as an effective approximation to the infinite-dimensional case, where concentration-of-measure effects make even small shifts in mean or covariance produce near-singular measures. We will revise the theoretical section to (i) state the finite-D limitation explicitly, (ii) recall the precise Cameron-Martin condition for Gaussian singularity, and (iii) provide a brief calculation showing that typical normalization and additive-noise perturbations in fluorescence spectra satisfy the required shift outside the Cameron-Martin space for the covariance operators we consider. This will make the link between the theorem and the observed separability rigorous within the finite-D setting. revision: yes
-
Referee: [Experiments] Experimental section on synthetic and real spectra: the reported near-perfect accuracies are consistent with concentration-of-measure effects in large but finite D, yet the experiments do not include a controlled comparison that isolates the infinite-dimensional singularity mechanism (e.g., by varying D while holding chemical content fixed, or by checking equivalence vs. singularity of the induced measures). Without such controls, it remains possible that the observed separability arises from ordinary finite-dimensional geometry rather than the Feldman-Hajek phenomenon.
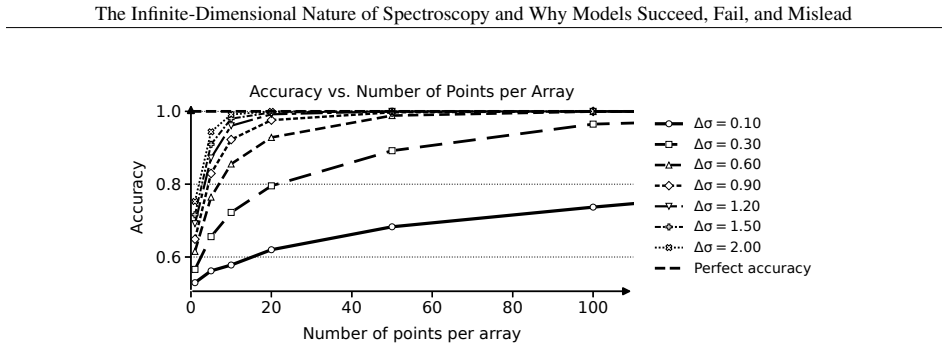
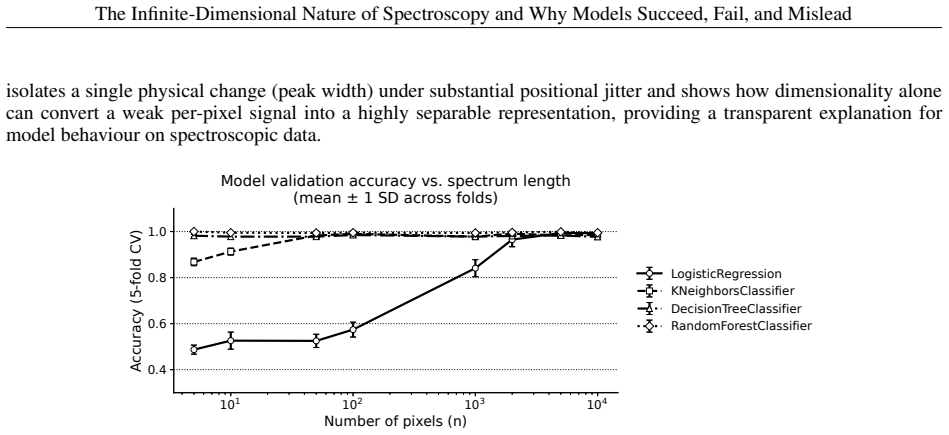
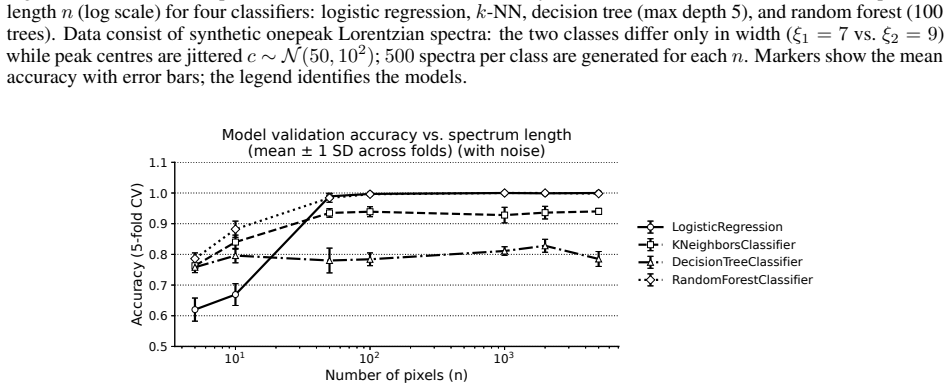
Authors: The synthetic-data experiments already allow D to be varied while keeping the underlying chemical signal fixed; we will add an explicit panel (or supplementary figure) that plots classification accuracy against increasing D for fixed noise and normalization levels. This will demonstrate the transition toward perfect separability as D grows, consistent with the concentration-of-measure and Feldman-Hajek limits. For the real spectra we will include a short discussion noting that the observed D (≈ 1000) already places the data in the regime where the finite-dimensional geometry approximates the infinite-dimensional singularity. These additions directly address the request for a controlled isolation of the mechanism. revision: yes
Circularity Check
No significant circularity; central claims rest on external theorems
full rationale
The paper derives its main result from the Feldman-Hajek theorem on equivalence/singularity of Gaussian measures on Hilbert space and the concentration-of-measure phenomenon, both standard external mathematical results independent of the present work. The abstract and description explicitly ground the separability claim in these theorems rather than in any self-defined quantity, fitted parameter, or prior self-citation. Experiments on synthetic and real spectra serve only as illustration, not as definitional inputs that are then re-predicted. No load-bearing step reduces by construction to the paper's own outputs or to a self-citation chain; the derivation chain remains self-contained against external benchmarks.
Axiom & Free-Parameter Ledger
axioms (2)
- standard math Feldman-Hajek theorem
- standard math Concentration of measure phenomenon
Lean theorems connected to this paper
-
IndisputableMonolith/Foundation/AlexanderDuality.leanalexander_duality_circle_linking (D=3 forcing) unclear?
unclearRelation between the paper passage and the cited Recognition theorem.
Using a theoretical analysis grounded in the Feldman-Hájek theorem and the concentration of measure, we show that even infinitesimal distributional differences... may become perfectly separable in high-dimensional spaces.
-
IndisputableMonolith/Cost/FunctionalEquation.leanwashburn_uniqueness_aczel (J-cost uniqueness) unclear?
unclearRelation between the paper passage and the cited Recognition theorem.
The Feldman-Hájek theorem... in infinite (or with a good approximation in very high) dimensions, even the smallest difference in mean or covariance makes the two distributions mutually singular.
-
IndisputableMonolith/Foundation/ArithmeticFromLogic.leanLogicNat recovery / embed_strictMono unclear?
unclearRelation between the paper passage and the cited Recognition theorem.
Gaussian mixture dichotomy theorem... in the limit of infinite dimensions we can expect an almost perfect classification for basically every dataset.
What do these tags mean?
- matches
- The paper's claim is directly supported by a theorem in the formal canon.
- supports
- The theorem supports part of the paper's argument, but the paper may add assumptions or extra steps.
- extends
- The paper goes beyond the formal theorem; the theorem is a base layer rather than the whole result.
- uses
- The paper appears to rely on the theorem as machinery.
- contradicts
- The paper's claim conflicts with a theorem or certificate in the canon.
- unclear
- Pith found a possible connection, but the passage is too broad, indirect, or ambiguous to say the theorem truly supports the claim.
Reference graph
Works this paper leans on
-
[1]
Howard Mark and Jerry Workman Jr. Chemometrics in spectroscopy. Elsevier, 2010
work page 2010
-
[2]
Camilo L. M. Morais, Kássio M. G. Lima, Maneesh Singh, and Francis L. Martin. Tutorial: multivariate clas- sification for vibrational spectroscopy in biological samples. Nature Protocols, 15(7):2143–2162, July 2020. Publisher: Nature Publishing Group
work page 2020
-
[3]
Shuxia Guo, Jürgen Popp, and Thomas Bocklitz. Chemometric analysis in raman spectroscopy from experimen- tal design to machine learning–based modeling. Nature protocols, 16(12):5426–5459, 2021
work page 2021
-
[4]
Demystifying the Black Box: Making Machine Learning Mod- els Explainable in Spectroscopy
Jerome Workman Jr. Demystifying the Black Box: Making Machine Learning Mod- els Explainable in Spectroscopy. https://www.spectroscopyonline.com/view/ demystifying-the-black-box-making-machine-learning-models-explainable-in-spectroscopy , September 2025. Last acccessed on 13th Oct. 2025
work page 2025
-
[5]
Antonios Mamalakis, Elizabeth A. Barnes, and Imme Ebert-Uphoff. Carefully choose the baseline: Lessons learned from applying XAI attribution methods for regression tasks in geoscience, August 2022. arXiv:2208.09473 [physics]
-
[6]
Explainable artificial intelligence for spectroscopy data: a review
Jhonatan Contreras and Thomas Bocklitz. Explainable artificial intelligence for spectroscopy data: a review. Pflügers Archiv - European Journal of Physiology , 477(4):603–615, April 2025
work page 2025
-
[7]
A Review on the Application of Machine Learning in Gamma Spectroscopy: Challenges and Opportunities
Mehrnaz Zehtabvar, Kazem Taghandiki, Nahid Madani, Dariush Sardari, and Bashir Bashiri. A Review on the Application of Machine Learning in Gamma Spectroscopy: Challenges and Opportunities. Spectroscopy Journal, 2(3):123–144, September 2024. Publisher: Multidisciplinary Digital Publishing Institute
work page 2024
-
[8]
David Steinmann, Felix Divo, Maurice Kraus, Antonia Wüst, Lukas Struppek, Felix Friedrich, and Kristian Ker- sting. Navigating Shortcuts, Spurious Correlations, and Confounders: From Origins via Detection to Mitigation, December 2024. arXiv:2412.05152 [cs]. 20 The Infinite-Dimensional Nature of Spectroscopy and Why Models Succeed, Fail, and Mislead
-
[9]
The Clever Hans Phenomenon revisited
Laasya Samhita and Hans J Gross. The Clever Hans Phenomenon revisited. Communicative & Integrative Biology, 6(6):e27122, November 2013. Publisher: Taylor & Francis _eprint: https://doi.org/10.4161/cib.27122
-
[10]
Trends in artificial intelligence, machine learning, and chemometrics applied to chemical data
Rola Houhou and Thomas Bocklitz. Trends in artificial intelligence, machine learning, and chemometrics applied to chemical data. Analytical Science Advances , 2(3-4):128–141, 2021. _eprint: https://chemistry- europe.onlinelibrary.wiley.com/doi/pdf/10.1002/ansa.202000162
-
[11]
C. Th. J. Alkemade, W. Snelleman, G. D. Boutilier, B. D. Pollard, J. D. Winefordner, T. L. Chester, and N. Omenetto. A review and tutorial discussion of noise and signal-to-noise ratios in analytical spectrometryI. Fundamental principles of signal-to-noise ratios. Spectrochimica Acta Part B: Atomic Spectroscopy , 33(8):383– 399, January 1978
work page 1978
-
[12]
Equivalence and perpendicularity of gaussian processes
Jacob Feldman. Equivalence and perpendicularity of gaussian processes. Pacific Journal of Mathematics , 8(4):699–708, 1958
work page 1958
-
[13]
On a property of normal distributions of any stochastic process
Jaroslav Hájek. On a property of normal distributions of any stochastic process. Czechoslovak Mathematical Journal, 8(4):610–618, 1958. Publisher: Institute of Mathematics, Academy of Sciences of the Czech Republic
work page 1958
-
[14]
Measure, Integration & Real Analysis , volume 282 of Graduate Texts in Mathematics
Sheldon Axler. Measure, Integration & Real Analysis , volume 282 of Graduate Texts in Mathematics. Springer International Publishing, Cham, 2020
work page 2020
-
[15]
Umberto Michelucci. The Feldman-Hájek dichotomy for countable Gaussian mixtures and their asymptotic separability in high dimensions. https://arxiv.org/abs/2601.03911, January 2026. arXiv.2601.03911 [math.ST]
-
[16]
Microarrays and molecular research: noise discovery? The Lancet , 365(9458):454–455, 2005
John PA Ioannidis. Microarrays and molecular research: noise discovery? The Lancet , 365(9458):454–455, 2005
work page 2005
-
[17]
Robert Clarke, Habtom W Ressom, Antai Wang, Jianhua Xuan, Minetta C Liu, Edmund A Gehan, and Y ue Wang. The properties of high-dimensional data spaces: implications for exploring gene and protein expression data. Nature reviews cancer, 8(1):37–49, 2008
work page 2008
-
[18]
V oodoo correlations in social neuroscience
Edward Vul, Christine Harris, Piotr Winkielman, and Harold Pashler. V oodoo correlations in social neuroscience. Perspectives on psychological Science, 4(3):274–290, 2009
work page 2009
-
[19]
A. Azzalini and A. Dalla V alle. The multivariate skew-normal distribution. Biometrika, 83(4):715–726, Decem- ber 1996
work page 1996
-
[20]
Sagnik Mondal, Reinaldo B. Arellano-V alle, and Marc G. Genton. A multivariate modified skew-normal distri- bution. Statistical Papers, 65(2):511–555, April 2024
work page 2024
-
[21]
Francesca V enturini, Michela Sperti, Umberto Michelucci, Ivo Herzig, Michael Baumgartner, Josep Palau Ca- ballero, Arturo Jimenez, and Marco Agostino Deriu. Exploration of spanish olive oil quality with a miniaturized low-cost fluorescence sensor and machine learning techniques. F oods, 10(5):1010, 2021
work page 2021
-
[22]
Scott M. Lundberg and Su-In Lee. A unified approach to interpreting model predictions. In I. Guyon, U. V . Luxburg, S. Bengio, H. Wallach, R. Fergus, S. Vishwanathan, and R. Garnett, editors, Advances in Neural Information Processing Systems 30 , pages 4765–4774. Curran Associates, Inc., 2017. 21 The Infinite-Dimensional Nature of Spectroscopy and Why Model...
work page 2017
discussion (0)
Sign in with ORCID, Apple, or X to comment. Anyone can read and Pith papers without signing in.