Beyond Thread States: Diagnosing Performance Degradation with eBPF and Thread Dynamics
Pith reviewed 2026-06-29 23:15 UTC · model grok-4.3
The pith
An eBPF method extends thread state analysis by tracing inter-thread dependencies to diagnose sources of performance degradation like CPU and lock contention.
A machine-rendered reading of the paper's core claim, the machinery that carries it, and where it could break.
Core claim
The method successfully diagnoses CPU, disk, lock, and external service contention with minimal overhead while revealing internal application constraints by extending TSA with fine-grained thread dynamics captured via eBPF metrics across six kernel subsystems and a selective thread tracking algorithm.
What carries the argument
The selective thread tracking algorithm that traces performance issues from entry-point threads to constrained resources using the sixteen eBPF metrics.
If this is right
- The approach identifies both the constrained subsystem and the path of propagation through thread interactions.
- It works across diverse applications under variable workloads without requiring changes to the application code.
- Overhead remains low enough for production use while still exposing internal constraints not visible in basic thread states.
- It covers contention from CPU, disk, locks, and external services in one unified tracing setup.
Where Pith is reading between the lines
- The same tracing structure could be extended to new kernel subsystems as they appear without redesigning the core algorithm.
- Production monitoring systems could feed the thread-dependency graphs into automated remediation scripts that adjust resource allocation.
- The method's focus on entry-point threads suggests it may scale to microservice architectures where degradation crosses process boundaries.
Load-bearing premise
Performance degradation propagates along inter-thread dependencies in a manner that tracking a subset of thread-resource interactions captures the common patterns.
What would settle it
An experiment in which the selective tracker misses the true source of degradation because the dependency chain involves more threads or resources than the chosen subset.
Figures


read the original abstract
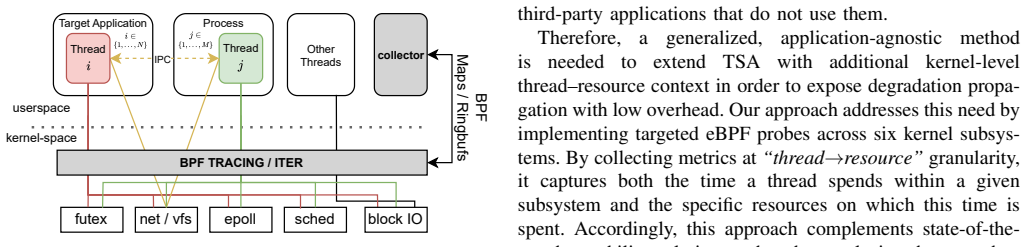
Online Data-Intensive applications face performance degradation from load variability and resource interference. While Thread State Analysis (TSA) based approaches enable identifying constrained subsystems, they lack the granularity to reveal the inter-thread dependencies that propagate degradation. In this paper, we present an application-agnostic performance degradation analysis method that extends TSA by capturing fine-grained thread dynamics. We implemented $16$ eBPF-based metrics across six kernel subsystems, including scheduling, VFS, networking, futex, multiplexing IO, and block IO which enables tracing thread interactions with specific resources like futexes, sockets, and disks. Our method leverages the fact that performance degradation propagates along inter-thread dependencies, and a subset of thread-resource interactions can enable capturing common degradation patterns. To this end, we employ a selective thread tracking algorithm that traces performance issues from entry-point threads to constrained resources. Experimentation with diverse applications under variable workloads and resource contention shows our method successfully diagnoses CPU, disk, lock, and external service contention with minimal overhead, while also revealing internal application constraints.
Editorial analysis
A structured set of objections, weighed in public.
Referee Report
Summary. The paper claims to extend Thread State Analysis (TSA) with an application-agnostic eBPF-based method that captures fine-grained thread dynamics via 16 metrics across six kernel subsystems (scheduling, VFS, networking, futex, multiplexing IO, block IO). It introduces a selective thread tracking algorithm that traces from entry-point threads to constrained resources, justified by the propagation of degradation along inter-thread dependencies and the sufficiency of a subset of thread-resource interactions. Experiments on diverse applications under variable workloads and contention are said to show successful diagnosis of CPU, disk, lock, and external service contention with minimal overhead, plus revelation of internal application constraints.
Significance. If validated, the approach could provide finer-grained diagnosis of inter-thread dependency propagation than standard TSA, enabling better identification of contention sources in data-intensive systems while maintaining low overhead through selective tracing.
major comments (2)
- [Abstract] Abstract: The central empirical claim that the method 'successfully diagnoses CPU, disk, lock, and external service contention' is asserted without any quantitative results, error bars, success metrics (e.g., precision/recall, diagnosis accuracy), workload details, or measurement methodology. This absence makes the claim of experimental success unverifiable and load-bearing for the paper's contribution.
- [Abstract] Abstract (paragraph on selective thread tracking algorithm): The method's applicability rests on the unvalidated assumption that 'a subset of thread-resource interactions can enable capturing common degradation patterns' because degradation 'propagates along inter-thread dependencies.' No formal argument, completeness proof, failure-mode enumeration, or representativeness argument for the chosen applications is provided; if the subset misses a propagation path, diagnosis is incomplete despite 'minimal overhead.'
Simulated Author's Rebuttal
We thank the referee for the constructive feedback. We address the two major comments on the abstract below and will revise the manuscript to improve clarity and support for the claims.
read point-by-point responses
-
Referee: [Abstract] Abstract: The central empirical claim that the method 'successfully diagnoses CPU, disk, lock, and external service contention' is asserted without any quantitative results, error bars, success metrics (e.g., precision/recall, diagnosis accuracy), workload details, or measurement methodology. This absence makes the claim of experimental success unverifiable and load-bearing for the paper's contribution.
Authors: We agree that the abstract would be strengthened by including summary quantitative results. The full manuscript reports specific experimental outcomes, including diagnosis success across workloads, overhead measurements (typically below 5%), and workload details in Sections 5 and 6. We will revise the abstract to incorporate key metrics such as average diagnosis accuracy and overhead ranges to make the empirical claim more verifiable. revision: yes
-
Referee: [Abstract] Abstract (paragraph on selective thread tracking algorithm): The method's applicability rests on the unvalidated assumption that 'a subset of thread-resource interactions can enable capturing common degradation patterns' because degradation 'propagates along inter-thread dependencies.' No formal argument, completeness proof, failure-mode enumeration, or representativeness argument for the chosen applications is provided; if the subset misses a propagation path, diagnosis is incomplete despite 'minimal overhead.'
Authors: The selective tracking approach is presented as an empirical heuristic justified by the propagation of degradation along inter-thread dependencies, which our experiments on diverse applications demonstrate by successfully identifying contention sources. While no formal completeness proof or exhaustive failure-mode analysis is included, the paper validates the method through results on multiple workloads. We will add a dedicated discussion subsection on the rationale, limitations of the subset selection, and representativeness of the evaluated applications. revision: partial
Circularity Check
No circularity: method is a direct engineering construction without reduction to fitted inputs or self-citations
full rationale
The paper describes an eBPF-based tracing implementation and selective thread tracking algorithm justified by an explicit modeling assumption (degradation propagates along inter-thread dependencies; a subset of interactions captures patterns). No equations, parameter fitting, or derivations appear. The assumption is stated as input rather than derived from the method's outputs. No self-citations are invoked to support the core claim. The approach is self-contained as a new tracing technique evaluated on applications; it does not reduce any prediction or result to its own inputs by construction.
Axiom & Free-Parameter Ledger
Reference graph
Works this paper leans on
-
[1]
Power management of online data-intensive services,
D. Meisner, C. M. Sadler, L. A. Barroso, W.-D. Weber, and T. F. Wenisch, “Power management of online data-intensive services,” in Proceedings of the 38th annual international symposium on Computer architecture, 2011, pp. 319–330
2011
-
[2]
{µTune}:{Auto-Tuned}threading for{OLDI}microservices,
A. Sriraman and T. F. Wenisch, “{µTune}:{Auto-Tuned}threading for{OLDI}microservices,” in13th USENIX Symposium on Operating Systems Design and Implementation (OSDI 18), 2018, pp. 177–194
2018
-
[3]
End-to-end quality of service management for distributed real-time embedded appli- cations,
P. Manghwani, J. Loyall, P. Sharma, M. Gillen, and J. Ye, “End-to-end quality of service management for distributed real-time embedded appli- cations,” in19th IEEE International Parallel and Distributed Processing Symposium. IEEE, 2005, pp. 8–pp
2005
-
[4]
Amoeba: Qos-awareness and reduced resource usage of microservices with serverless computing,
Z. Li, Q. Chen, S. Xue, T. Ma, Y . Yang, Z. Song, and M. Guo, “Amoeba: Qos-awareness and reduced resource usage of microservices with serverless computing,” in2020 IEEE International Parallel and Distributed Processing Symposium (IPDPS). IEEE, 2020, pp. 399– 408
2020
-
[5]
Impact of response latency on user behavior in web search,
I. Arapakis, X. Bai, and B. B. Cambazoglu, “Impact of response latency on user behavior in web search,” inProceedings of the 37th international ACM SIGIR conference on Research & development in information retrieval, 2014, pp. 103–112
2014
-
[6]
Quality is in the eye of the beholder: Meeting users’ requirements for internet quality of service,
A. Bouch, A. Kuchinsky, and N. Bhatti, “Quality is in the eye of the beholder: Meeting users’ requirements for internet quality of service,” in Proceedings of the SIGCHI conference on Human factors in computing systems, 2000, pp. 297–304
2000
-
[7]
{PerfCompass}: Toward runtime performance anomaly fault localization for{Infrastructure-as- a-Service}clouds,
D. J. Dean, H. Nguyen, P. Wang, and X. Gu, “{PerfCompass}: Toward runtime performance anomaly fault localization for{Infrastructure-as- a-Service}clouds,” in6th USENIX Workshop on Hot Topics in Cloud Computing (HotCloud 14), 2014
2014
-
[8]
Gregg,Systems performance: enterprise and the cloud
B. Gregg,Systems performance: enterprise and the cloud. Pearson Education, 2014
2014
-
[9]
R. L. Sites,Understanding software dynamics. Addison-Wesley Pro- fessional, 2021
2021
-
[10]
Monitorless: Predicting performance degradation in cloud applications with machine learning,
J. Grohmann, P. K. Nicholson, J. O. Iglesias, S. Kounev, and D. Lugones, “Monitorless: Predicting performance degradation in cloud applications with machine learning,” inProceedings of the 20th international mid- dleware conference, 2019, pp. 149–162
2019
-
[11]
Fedge: An interference-aware qos prediction framework for black-box scenario in iaas clouds with domain generalization,
Y . Cheng, X. Huang, Z. Liu, J. Chen, X. Gao, Z. Fang, and Y . Yang, “Fedge: An interference-aware qos prediction framework for black-box scenario in iaas clouds with domain generalization,” in2024 IEEE International Parallel and Distributed Processing Symposium (IPDPS). IEEE, 2024, pp. 128–138
2024
-
[12]
Predicting real-time service-level metrics from device statistics,
R. Yanggratoke, J. Ahmed, J. Ardelius, C. Flinta, A. Johnsson, D. Gill- blad, and R. Stadler, “Predicting real-time service-level metrics from device statistics,” in2015 IFIP/IEEE International Symposium on Inte- grated Network Management (IM). IEEE, 2015, pp. 414–422
2015
-
[13]
Automated diagnostic of virtualized service performance degradation,
J. Ahmed, T. Josefsson, A. Johnsson, C. Flinta, F. Moradi, R. Pasquini, and R. Stadler, “Automated diagnostic of virtualized service performance degradation,” inNOMS 2018-2018 IEEE/IFIP Network Operations and Management Symposium. IEEE, 2018, pp. 1–9
2018
-
[14]
Correlating instrumentation data to system states: A building block for automated diagnosis and control
I. Cohen, J. S. Chase, M. Goldszmidt, T. Kelly, and J. Symons, “Correlating instrumentation data to system states: A building block for automated diagnosis and control.” inOSDI, vol. 4, 2004, pp. 16–16
2004
-
[15]
Ensembles of models for automated diagnosis of system performance problems,
S. Zhang, I. Cohen, M. Goldszmidt, J. Symons, and A. Fox, “Ensembles of models for automated diagnosis of system performance problems,” in2005 International Conference on Dependable Systems and Networks (DSN’05). IEEE, 2005, pp. 644–653
2005
-
[16]
Sage: practical and scalable ml-driven performance debugging in microservices,
Y . Gan, M. Liang, S. Dev, D. Lo, and C. Delimitrou, “Sage: practical and scalable ml-driven performance debugging in microservices,” in Proceedings of the 26th ACM International Conference on Architectural Support for Programming Languages and Operating Systems, 2021, pp. 135–151
2021
-
[17]
Seer: Leveraging big data to navigate the complexity of performance debugging in cloud microservices,
Y . Gan, Y . Zhang, K. Hu, D. Cheng, Y . He, M. Pancholi, and C. Delimitrou, “Seer: Leveraging big data to navigate the complexity of performance debugging in cloud microservices,” inProceedings of the twenty-fourth international conference on architectural support for programming languages and operating systems, 2019, pp. 19–33
2019
-
[18]
Characterizing in-kernel ob- servability of latency-sensitive request-level metrics with ebpf,
M. Rezvani, A. Jahanshahi, and D. Wong, “Characterizing in-kernel ob- servability of latency-sensitive request-level metrics with ebpf,” in2024 IEEE International Symposium on Performance Analysis of Systems and Software (ISPASS). IEEE, 2024, pp. 24–35
2024
-
[19]
Holistic runtime performance and security-aware monitoring in public cloud environment,
D. N. Jha, G. Lenton, J. Asker, D. Blundell, and D. Wallom, “Holistic runtime performance and security-aware monitoring in public cloud environment,” in2022 22nd IEEE International Symposium on Cluster, Cloud and Internet Computing (CCGrid). IEEE, 2022, pp. 1052–1059
2022
-
[20]
Nosql database per- formance diagnosis through system call-level introspection,
C. Seo, Y . Chae, J. Lee, E. Seo, and B. Tak, “Nosql database per- formance diagnosis through system call-level introspection,” inNOMS 2022-2022 IEEE/IFIP Network Operations and Management Sympo- sium. IEEE, 2022, pp. 1–9
2022
-
[21]
Landau and N
D. Landau and N. Saurabh, “Prism,” Feb. 2026. [Online]. Available: https://github.com/EC-labs/prism
2026
-
[22]
Where is your application stuck?
S. Nagar, B. Singh, V . Kashyap, C. Seetharaman, N. Sharoff, and P. Banerjee, “Where is your application stuck?” inLinux Symposium. Citeseer, 2007, p. 71
2007
-
[23]
Performance monitoring tools for linux,
D. Gavin, “Performance monitoring tools for linux,”Linux Journal, vol. 1998, no. 56es, pp. 1–es, 1998
1998
-
[24]
Runtime-adaptable selective performance instrumentation,
S. Kreutzer, C. Iwainsky, M. Garcia-Gasulla, V . Lopez, and C. Bischof, “Runtime-adaptable selective performance instrumentation,” in2023 IEEE International Parallel and Distributed Processing Symposium Workshops (IPDPSW). IEEE, 2023, pp. 423–432
2023
-
[25]
Diagnosing application-network anomalies for millions of{IPs}in production clouds,
Z. Wang, H. Hu, L. Kong, X. Kang, Q. Xiang, J. Li, Y . Lu, Z. Song, P. Yang, J. Wuet al., “Diagnosing application-network anomalies for millions of{IPs}in production clouds,” in2024 USENIX Annual Technical Conference (USENIX ATC 24), 2024, pp. 885–899
2024
-
[26]
Locating system problems using dynamic instrumentation,
V . Prasad, W. Cohen, F. Eigler, M. Hunt, J. Keniston, and J. Chen, “Locating system problems using dynamic instrumentation,” in2005 Ottawa Linux Symposium. New York, NY: IEEE, 2005, pp. 49–64
2005
-
[27]
The lttng tracer: A low impact performance and behavior monitor for gnu/linux,
M. Desnoyers and M. R. Dagenais, “The lttng tracer: A low impact performance and behavior monitor for gnu/linux,” inOLS (Ottawa Linux Symposium), vol. 2006. Citeseer, 2006, pp. 209–224
2006
-
[28]
Dynamic instrumen- tation of production systems
B. Cantrill, M. W. Shapiro, A. H. Leventhalet al., “Dynamic instrumen- tation of production systems.” inUSENIX Annual Technical Conference, General Track, 2004, pp. 15–28
2004
-
[29]
eBPF, “ebpf,” https://docs.kernel.org/bpf/, 2025, accessed: 2025-07-20
2025
-
[30]
Bpf compiler collection (bcc),
Iovisor, “Bpf compiler collection (bcc),” https://github.com/iovisor/bcc, 2025, accessed: 2025-07-20
2025
-
[31]
bpftrace,
Bpftrace, “bpftrace,” https://github.com/bpftrace/bpftrace, 2025, ac- cessed: 2025-07-20
2025
-
[32]
libbpf source library,
Libbpf, “libbpf source library,” https://github.com/libbpf/libbpf, 2025, accessed: 2025-07-20
2025
-
[33]
libbpf-rs: A Rust wrapper around libbpf,
Libbpf-rs, “libbpf-rs: A Rust wrapper around libbpf,” https://github.com/ libbpf/libbpf-rs, 2025, accessed: 2025-07-20
2025
-
[34]
Canario: Sounding the alarm on io-related performance degradation,
M. R. Wyatt, S. Herbein, K. Shoga, T. Gamblin, and M. Taufer, “Canario: Sounding the alarm on io-related performance degradation,” in2020 IEEE International Parallel and Distributed Processing Sympo- sium (IPDPS). IEEE, 2020, pp. 73–83
2020
-
[35]
Baro: Robust root cause analysis for microservices via multivariate bayesian online change point detection,
L. Pham, H. Ha, and H. Zhang, “Baro: Robust root cause analysis for microservices via multivariate bayesian online change point detection,” Proceedings of the ACM on Software Engineering, vol. 1, no. FSE, pp. 2214–2237, 2024
2024
-
[36]
Causal inference-based root cause analysis for online service systems with intervention recognition,
M. Li, Z. Li, K. Yin, X. Nie, W. Zhang, K. Sui, and D. Pei, “Causal inference-based root cause analysis for online service systems with intervention recognition,” inProceedings of the 28th ACM SIGKDD Conference on Knowledge Discovery and Data Mining, 2022, pp. 3230– 3240
2022
-
[37]
Microscope: Pinpoint performance issues with causal graphs in micro-service environments,
J. Lin, P. Chen, and Z. Zheng, “Microscope: Pinpoint performance issues with causal graphs in micro-service environments,” inService-Oriented Computing: 16th International Conference, ICSOC 2018, Hangzhou, China, November 12-15, 2018, Proceedings 16. Springer, 2018, pp. 3–20
2018
-
[38]
{FIRM}: An intelligent fine-grained resource management framework for{SLO-Oriented}microservices,
H. Qiu, S. S. Banerjee, S. Jha, Z. T. Kalbarczyk, and R. K. Iyer, “{FIRM}: An intelligent fine-grained resource management framework for{SLO-Oriented}microservices,” in14th USENIX symposium on operating systems design and implementation (OSDI 20), 2020, pp. 805– 825
2020
-
[39]
Coroot, “Coroot,” https://docs.coroot.com/, 2025, accessed: 2025-10-09
2025
-
[40]
Pixie, “Pixie,” https://docs.px.dev/, 2025, accessed: 2025-10-09
2025
-
[41]
dynatrace runtime support,
dynatrace, “dynatrace runtime support,” https://docs.dynatrace.com/ docs/ingest-from/technology-support/application-software, accessed: 2026-01-16
2026
-
[42]
application performance monitoring,
new relic, “application performance monitoring,” https://docs.newrelic. com/docs/apm/new-relic-apm/getting-started/introduction-apm/, accessed: 2026-01-16
2026
-
[43]
xcapture,
xCapture, “xcapture,” https://github.com/tanelpoder/0xtools, 2025, ac- cessed: 2025-10-09. 13
2025
-
[44]
Reduce the infrastructure agent: CPU footprint — New Relic Documentation,
“Reduce the infrastructure agent: CPU footprint — New Relic Documentation,” https://docs.newrelic.com/docs/infrastructure/ infrastructure-troubleshooting/troubleshoot-infrastructure/reduce- infrastructure-agents-cpu-footprint/, [Accessed 14-01-2026]
2026
-
[45]
Troubleshooting large memory usage (Node.js): New Relic Documentation
“Troubleshooting large memory usage (Node.js): New Relic Documentation.” https://docs.newrelic.com/docs/apm/agents/nodejs- agent/troubleshooting/troubleshooting-large-memory-usage-nodejs/, [Accessed 10-01-2026]
2026
-
[46]
Controlling Measurement Overhead: Dynatrace
“Controlling Measurement Overhead: Dynatrace.” https://www. dynatrace.com/resources/ebooks/javabook/controlling-measurement- overhead/, [Accessed 10-01-2026]
2026
-
[47]
Process deep monitoring: Dynatrace,
“Process deep monitoring: Dynatrace,” https://docs.dynatrace.com/docs/ observe/infrastructure-observability/process-groups/configuration/pg- monitoring, [Accessed 10-01-2026]
2026
-
[48]
The tsa method,
B. Gregg, “The tsa method,” https://www.brendangregg.com/tsamethod. html, 2025, accessed: 2025-10-07
2025
-
[49]
Raasveldt, H
M. Raasveldt, H. Muehleisenet al., “Duckdb,” inProceedings of the 2019 International Conference on Management of Data. ACM, 2019
2019
-
[50]
Futexes are tricky,
U. Drepper, “Futexes are tricky,”Futexes are Tricky, Red Hat Inc, Japan, vol. 4, 2005
2005
-
[51]
Rust parker implementation,
R. Lang, “Rust parker implementation,” https://github.com/rust- lang/rust/blob/eb33b43bab08223fa6b46abacc1e95e859fe375d/library/ std/src/sys/sync/thread parking/futex.rs, 2025, accessed: 2025-07-20
2025
-
[52]
Eval- uating network processing efficiency with processor partitioning and asynchronous i/o,
T. Brecht, G. Janakiraman, B. Lynn, V . Saletore, and Y . Turner, “Eval- uating network processing efficiency with processor partitioning and asynchronous i/o,”ACM SIGOPS Operating Systems Review, vol. 40, no. 4, pp. 265–278, 2006
2006
-
[53]
Kerrisk,The Linux programming interface: a Linux and UNIX system programming handbook
M. Kerrisk,The Linux programming interface: a Linux and UNIX system programming handbook. No Starch Press, 2010
2010
-
[54]
Teastore: A micro-service reference application for bench- marking, modeling and resource management research,
J. V on Kistowski, S. Eismann, N. Schmitt, A. Bauer, J. Grohmann, and S. Kounev, “Teastore: A micro-service reference application for bench- marking, modeling and resource management research,” in2018 IEEE 26th International Symposium on Modeling, Analysis, and Simulation of Computer and Telecommunication Systems (MASCOTS). IEEE, 2018, pp. 223–236
2018
-
[55]
pysentimiento: A python toolkit for opinion mining and social nlp tasks,
J. M. P ´erez, M. Rajngewerc, J. C. Giudici, D. A. Furman, F. Luque, L. A. Alemany, and M. V . Mart ´ınez, “pysentimiento: A python toolkit for opinion mining and social nlp tasks,” 2023
2023
-
[56]
A hybrid system call profiling approach for container protection,
Y . Xing, X. Wang, S. Torabi, Z. Zhang, L. Lei, and K. Sun, “A hybrid system call profiling approach for container protection,”IEEE Transactions on Dependable and Secure Computing, 2023
2023
-
[57]
Demystifying cloud benchmarking,
T. Palit, Y . Shen, and M. Ferdman, “Demystifying cloud benchmarking,” in2016 IEEE international symposium on performance analysis of systems and software (ISPASS). IEEE, 2016, pp. 122–132
2016
-
[58]
Characterizing and optimizing kernel resource isolation for containers,
K. Wang, S. Wu, K. Suo, Y . Liu, H. Huang, Z. Huang, and H. Jin, “Characterizing and optimizing kernel resource isolation for containers,” Future Generation Computer Systems, vol. 141, pp. 218–229, 2023
2023
-
[59]
Benchmarking cloud serving systems with ycsb,
B. F. Cooper, A. Silberstein, E. Tam, R. Ramakrishnan, and R. Sears, “Benchmarking cloud serving systems with ycsb,” inProceedings of the 1st ACM symposium on Cloud computing, 2010, pp. 143–154
2010
-
[60]
A modeling study of the tpc-c benchmark,
S. T. Leutenegger and D. Dias, “A modeling study of the tpc-c benchmark,”ACM Sigmod Record, vol. 22, no. 2, pp. 22–31, 1993
1993
-
[61]
Redis benchmark,
Redis, “Redis benchmark,” https://redis.io/docs/latest/operate/oss-and- stack/management/optimization/benchmarks/, 2025, accessed: 2025-07- 20
2025
-
[62]
Memtier benchmark,
RedisLabs, “Memtier benchmark,” https://github.com/RedisLabs/ memtier benchmark, 2025, accessed: 2025-07-20
2025
-
[63]
An open source load testing tool
Locust, “An open source load testing tool.” https://locust.io, accessed: 2025-07-20
2025
-
[64]
Twitter sentiment analysis dataset,
Kaggle, “Twitter sentiment analysis dataset,” https://www.kaggle.com/ datasets/jp797498e/twitter-entity-sentiment-analysis, 2025, accessed: 2025-07-20
2025
-
[65]
Thinking methodically about performance,
B. Gregg, “Thinking methodically about performance,”Communications of the ACM, vol. 56, no. 2, pp. 45–51, 2013
2013
-
[66]
stress next generation,
Stressng, “stress next generation,” https://github.com/ColinIanKing/ stress-ng/tree/master, accessed: 2025-07-20
2025
-
[67]
Innodb and the acid model,
MySQL, “Innodb and the acid model,” https://dev.mysql.com/doc/ refman/8.4/en/mysql-acid.html, accessed: 2025-07-20
2025
-
[68]
Cassandra storage engine documentation,
Cassandra, “Cassandra storage engine documentation,” https://cassandra. apache.org/doc/4.1/cassandra/architecture/storage engine.html, accessed: 2025-07-20. 14 Appendix: Artifact Description/Artifact Evaluation This two-page appendix contains theArtifact Description (AD)andArtifact Evaluation (AE). The complete source code for the metric collector and ana...
2025
discussion (0)
Sign in with ORCID, Apple, or X to comment. Anyone can read and Pith papers without signing in.