Galactic absorption measured by X-ray observations of clusters of galaxies at the low Galactic latitude
Pith reviewed 2026-06-28 05:23 UTC · model grok-4.3
The pith
X-ray spectra of low-latitude galaxy clusters measure systematically higher Galactic N_H than HI and CO estimates at columns above 10^22 cm^{-2}.
A machine-rendered reading of the paper's core claim, the machinery that carries it, and where it could break.
Core claim
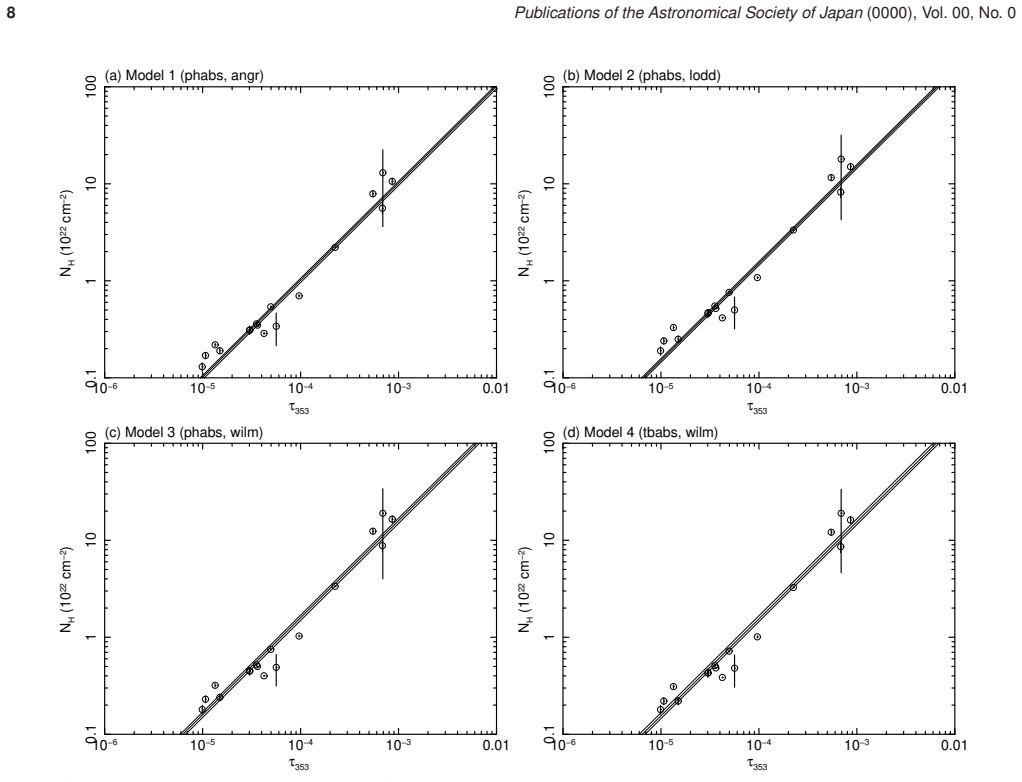
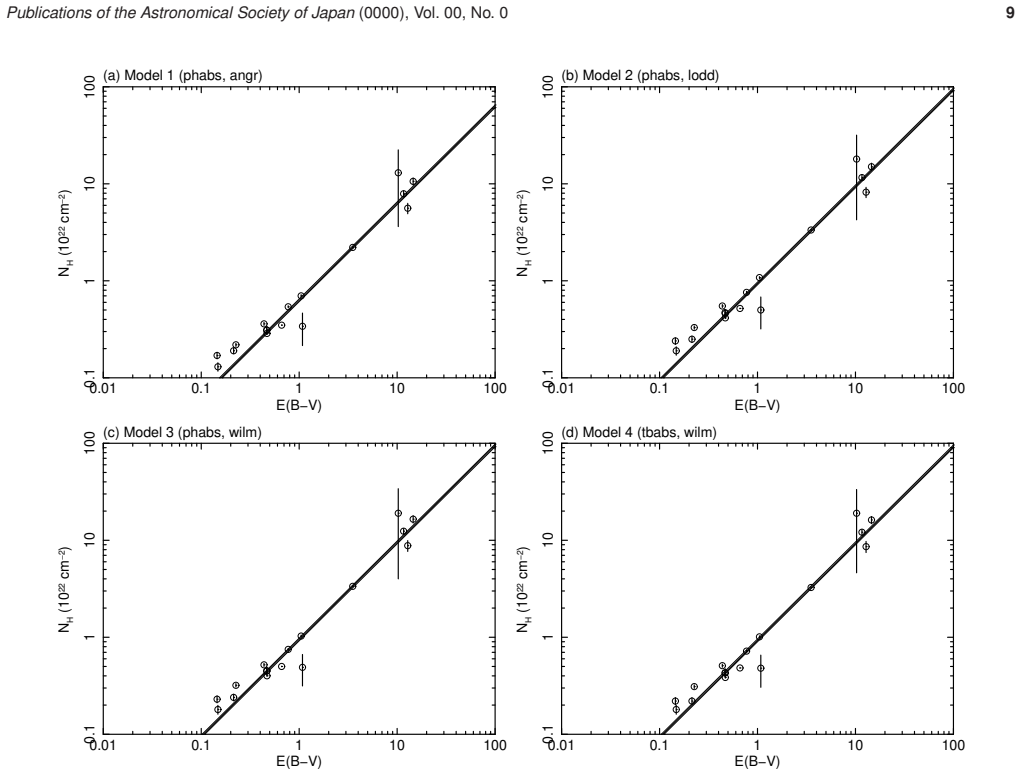
X-ray absorption measurements yield N_H values that are systematically larger than HI-plus-CO estimates, especially at N_H greater than 10^22 cm^{-2}, while the relations N_H = (1.01-1.59) x 10^26 tau_353 cm^{-2} and N_H = (6.3-9.5) x 10^21 E(B-V) cm^{-2} hold linearly even at the highest observed columns.
What carries the argument
Photoelectric absorption imprinted on the X-ray continuum of distant galaxy clusters, which directly counts the total number of atoms in the foreground Galactic line of sight without reference to temperature or chemical state.
If this is right
- HI and CO surveys alone may underestimate the total interstellar gas mass near the Galactic plane.
- Dust optical depth at 353 GHz can be converted to N_H using a single linear factor that works across low and high column regimes.
- Optical reddening E(B-V) likewise provides a reliable linear proxy for total hydrogen column even in dense regions.
- The X-ray method offers a temperature-independent route to map Galactic absorption using any sufficiently bright background X-ray source.
Where Pith is reading between the lines
- Discrepancies at high columns could trace additional gas phases such as cold molecular hydrogen not captured by standard HI or CO tracers.
- Applying the same X-ray technique to a larger sample of clusters or AGN could produce a finer map of absorption variations with Galactic longitude.
- Revised gas column estimates would increase the inferred total mass available for star formation in the inner Galaxy.
Load-bearing premise
The X-ray spectra of the clusters can be modeled accurately enough to isolate purely Galactic foreground absorption without significant cluster-intrinsic absorption or instrumental contributions.
What would settle it
A direct comparison showing that independent N_H measurements from gamma-ray emission or ultraviolet absorption lines match the lower HI-plus-CO values rather than the higher X-ray values at columns above 10^22 cm^{-2}.
Figures

read the original abstract
The amount of the interstellar gas in the Galaxy has been conventionally estimated through observations at various wavelengths. The estimation of the total hydrogen column density (N_H) depends on assumptions such as temperature. The X-ray absorption process is the photoelectric absorption, which depends on the number of atoms to encounter X-ray photons, and hence X-ray observations would be able to derive the N_H values independently on the condition of the interstellar matter. We measured the Galactic absorption using clusters of galaxies at the low Galactic latitude. Comparing the observed N_H with the calculated N_H} values from HI and CO intensities indicates that the observed values are systematically larger than the calculated values. The observed $N_{\rm H}$ values at high Galactic latitude (N_H<10^{22} cm^{-2}) are comparable to those estimated from N_HI} and optical reddening values using the method by Willingale et al. (2013, MNRAS, 431, 394), but the values near to the Galactic plane (N_H >10^{22} cm^{-2}) are larger than the estimated ones. The dust optical depth at 353 GHz, tau_{353}, and the observed N_H values are expressed by a linear function of N_H=(1.01-1.59)x10^{26} tau_{353} cm^{-2} even at N_H >10^{23} cm^{-2}. We also confirmed a linear correlation between the optical reddening, E(B-V), and the N_H values expressed by N_H=(6.3-9.5)x10^{21} E(B-V) cm^{-2}. This work is an additional and independent test of the relation among the amount of interstellar gas, the optical depth, and the optical reddening.
Editorial analysis
A structured set of objections, weighed in public.
Referee Report
Summary. The paper claims that X-ray absorption measurements toward galaxy clusters at low Galactic latitudes yield N_H values systematically larger than those computed from HI and CO intensities (especially for N_H > 10^22 cm^{-2}), while the observed N_H remains linearly correlated with dust optical depth τ_353 (N_H = (1.01-1.59)×10^{26} τ_353 cm^{-2}) and reddening E(B-V) (N_H = (6.3-9.5)×10^{21} E(B-V) cm^{-2}) even at high columns. These relations are presented as an independent test of interstellar gas tracers that holds where conventional HI+CO estimates may be incomplete.
Significance. If the X-ray-derived N_H values can be shown to isolate purely Galactic foreground absorption, the linear relations at N_H > 10^{22} cm^{-2} would constitute a useful cross-validation of dust-based tracers in the Galactic plane. The work's value lies in extending the comparison to regimes where other methods are uncertain, provided the spectral modeling assumptions are fully documented and tested.
major comments (2)
- [Abstract] Abstract: the headline result (observed N_H systematically exceeds HI+CO values at N_H > 10^{22} cm^{-2}) requires that the fitted absorption column is purely Galactic foreground. The abstract states that X-ray absorption depends only on the number of atoms encountered but does not specify whether the spectral model includes a separate redshifted absorption component for the cluster, a warm absorber, or cluster dust; any such contribution would bias N_H upward and produce the reported offset as an artifact.
- [Abstract] Abstract and implied methods: the linear coefficients for τ_353 and E(B-V) are given as ranges without accompanying error analysis, covariance, or sample selection criteria. Without the full spectral fitting procedure, background subtraction at low |b|, or tabulated N_H values with uncertainties, it is impossible to verify whether the claimed systematic offset or the persistence of the linear relations survives changes in modeling assumptions.
minor comments (1)
- [Abstract] Abstract: the parenthetical ranges (1.01-1.59) and (6.3-9.5) should be explicitly defined (e.g., 1σ uncertainties, range over different subsamples, or fit variants).
Simulated Author's Rebuttal
We thank the referee for the detailed comments. We agree that the abstract requires clarification on the spectral modeling to ensure the absorption is interpreted as purely Galactic foreground, and we will expand the methods description with fitting details, error analysis, and sample criteria. We address each point below.
read point-by-point responses
-
Referee: [Abstract] Abstract: the headline result (observed N_H systematically exceeds HI+CO values at N_H > 10^{22} cm^{-2}) requires that the fitted absorption column is purely Galactic foreground. The abstract states that X-ray absorption depends only on the number of atoms encountered but does not specify whether the spectral model includes a separate redshifted absorption component for the cluster, a warm absorber, or cluster dust; any such contribution would bias N_H upward and produce the reported offset as an artifact.
Authors: We agree the abstract is insufficiently explicit. The manuscript models the spectrum with a single Galactic absorption component (tbabs at z=0) applied to the cluster emission model (redshifted APEC or similar), with no additional intrinsic absorption at the cluster redshift. This assumption is standard for such studies but was not stated in the abstract. We will revise the abstract to explicitly note the model components and add a methods subsection documenting the fitting procedure, including checks for residual cluster absorption. revision: yes
-
Referee: [Abstract] Abstract and implied methods: the linear coefficients for τ_353 and E(B-V) are given as ranges without accompanying error analysis, covariance, or sample selection criteria. Without the full spectral fitting procedure, background subtraction at low |b|, or tabulated N_H values with uncertainties, it is impossible to verify whether the claimed systematic offset or the persistence of the linear relations survives changes in modeling assumptions.
Authors: The ranges reflect the spread across different sample subsets and fitting variants in the full analysis. We will add error bars on the coefficients, covariance information, explicit sample selection criteria (e.g., |b| < 20°, cluster redshift cuts), a description of background subtraction at low latitudes, and a table of individual N_H values with uncertainties. These details are present in the body but will be summarized in the abstract and methods for clarity. revision: yes
Circularity Check
No significant circularity; empirical comparisons to external datasets
full rationale
The paper reports X-ray spectral fits for N_H in background clusters at low |b|, then directly compares those values to independent N_H estimates from HI+CO maps and to linear fits against tau_353 and E(B-V) from external surveys. The reported relations N_H = (1.01-1.59) x 10^26 tau_353 and N_H = (6.3-9.5) x 10^21 E(B-V) are empirical fits to the observed points; the headline claim is the systematic excess at N_H > 10^22 cm^{-2} relative to HI+CO, not a first-principles derivation. No equation reduces by construction to a parameter fitted from the same X-ray data, no self-citation chain bears the central result, and the comparison datasets are external. The analysis is therefore self-contained against independent benchmarks.
Axiom & Free-Parameter Ledger
axioms (1)
- domain assumption X-ray absorption toward background clusters is dominated by photoelectric absorption from Galactic interstellar atoms and can be separated from cluster emission.
Reference graph
Works this paper leans on
-
[1]
2013, PASJ, 65, 16
Akamatsu, H., & Kawahara, H. 2013, PASJ, 65, 16
2013
-
[2]
1989, Geochim
Anders, E., & Grevesse, N. 1989, Geochim. Cosmochim. Acta, 5 3, 197
1989
-
[3]
Arnaud, M., & Evrard, A. E. 1999, MNRAS, 305, 631 Barrière, N. M., Tomsick, J. A., Wik, D. R., Chaty, S., & Rodor iguez, J. 2015, ApJ, 799, 24
1999
-
[4]
C., Savage, B
Bohlin, R. C., Savage, B. D., & Drake, J. F. 1978, ApJ, 224, 132
1978
-
[5]
D., Wolfire, M., & Leroy, A
Bolatto, A. D., Wolfire, M., & Leroy, A. K. 2013, ARA&A, 51, 207 Burke B. E., Mountain R. W., Harrison D. C., Bautz M. W., Doty J. P ., Ricker G. R., & Daniels P . J. 1991, IEEE Trans., ED-38, 1069
2013
-
[6]
M., Hartmann, D., & Thaddeus, P
Dame, T. M., Hartmann, D., & Thaddeus, P . 2001, ApJ, 547, 792
2001
-
[7]
M., & Lockman, F
Dicky, J. M., & Lockman, F. J. 1990, ARA&A, 28, 215
1990
-
[8]
W., Lang, D., Goodman, J
Foreman-Mackey, D., Hogg, D. W., Lang, D., Goodman, J. 2013, PASP, 125, 306
2013
-
[9]
2004, PASJ, 56, 965
Fukazawa, Y ., Makishima, K., & Ohashi, T. 2004, PASJ, 56, 965
2004
-
[10]
2014, ApJ, 796, 59
Fukui, Y ., et al. 2014, ApJ, 796, 59
2014
-
[11]
2015, ApJ, 798, 6
Tachihara, K., & Sano, H. 2015, ApJ, 798, 6
2015
-
[12]
2008, PASJ, 60, 1133
Fujita, Y ., et al. 2008, PASJ, 60, 1133
2008
-
[13]
2024, A&A, 688, A207
Gatuzz, E., et al. 2024, A&A, 688, A207
2024
-
[14]
1975, ApJ, 198, 95
Gorenstein, P . 1975, ApJ, 198, 95
1975
-
[15]
A., Casandjian, J
Grenier, I. A., Casandjian, J. M., & Terrier, R. 2005, Scienc e, 307, 1292 Güver, T., & Özel, F. 2009, MNRAS, 400, 2050
2005
-
[16]
S., & Draine, B
Hensley, B. S., & Draine, B. T. 2017, ApJ, 836, 179 HI4PI Collaboration 2016, A&A, 594, A116
2017
-
[17]
2007, PASJ, 59, S113
Ishisaki, Y ., et al. 2007, PASJ, 59, S113
2007
-
[18]
Morras, R., & Pöppel, W. G. L. 2005, A&A, 440, 775
2005
-
[19]
2015, PASJ, 67, 71
Makishima, K. 2015, PASJ, 67, 71
2015
-
[20]
2007, PASJ, 59, S23
Koyama, K., et al. 2007, PASJ, 59, S23
2007
-
[21]
Y ., Ishi da, M., Ohashi, T., & Ueda, Y
Kushino, A., Ishisaki, Y ., Morita, U., Y amasaki, N. Y ., Ishi da, M., Ohashi, T., & Ueda, Y . 2002, PASJ, 54, 327
2002
-
[22]
S., & Dor´, O
Lenz, D., Hensley, B. S., & Dor´, O. 2017, ApJ, 846, 38
2017
-
[23]
2018, ApJS, 235, 1
Li, D., et al. 2018, ApJS, 235, 1
2018
-
[24]
2022, A&A, 659, A118
Locatelli, N., Ponti, G., & Bianchi, S. 2022, A&A, 659, A118
2022
-
[25]
2003, ApJ, 591, 1220 Lopes de Oliveira, R., Lima Neto, G
Lodders, K. 2003, ApJ, 591, 1220 Lopes de Oliveira, R., Lima Neto, G. B., Mendes de Oliveira, C ., Janot-
2003
-
[26]
2006, A&A415, 422
Pacheco, E., & Motch, C. 2006, A&A415, 422
2006
-
[27]
1996, PASJ, 48, 171
Makishima, K., et al. 1996, PASJ, 48, 171
1996
-
[28]
2007, PASJ, 59, S1
Mitsuda, K., et al. 2007, PASJ, 59, S1
2007
-
[29]
2013, P ASJ, 65, 102
Mori, H., Maeda, Y ., Furuzawa, A., Haba, Y ., & Ueda, Y . 2013, P ASJ, 65, 102
2013
-
[30]
2017, PASJ, 69, 3
Mori, H., Maeda, Y ., Ueda, Y ., Nakazawa, K., & Tawara, Y . 2017, PASJ, 69, 3
2017
-
[31]
Nevalainen, J., Lumb, D., dos Santos, S., Siddiqui, H., Stewart, G., & Parmar, A. N. 2001, A&A, 374, 66
2001
-
[32]
2012, PASJ, 64, 16
Nishino, S., Fukazawa, Y ., & Hayashi, K. 2012, PASJ, 64, 16
2012
-
[33]
K., Nobukawa, M., Tsuru, T
Nobukawa, K. K., Nobukawa, M., Tsuru, T. G., & Koyama, K. 2015 , Adv. in Space Res., 55, 2493
2015
-
[34]
1996, PASJ, 48, 157 Planck Collaboration, 2016, A&A, 594, A10 Planck Collaboration, 2014, A&A, 571, A11 Planck Collaboration, 2011, A&A, 536, A19
Ohashi, T., et al. 1996, PASJ, 48, 157 Planck Collaboration, 2016, A&A, 594, A10 Planck Collaboration, 2014, A&A, 571, A11 Planck Collaboration, 2011, A&A, 536, A19
1996
-
[35]
Predehl, P ., & Schmitt, J. H. M. M. 1995, A&A, 293, 889
1995
-
[36]
W., et al
Randall, S. W., et al. 2016, ApJ, 823, 94
2016
-
[37]
1973, A&A, 26, 257
Reina, C., & Tarenghi M. 1973, A&A, 26, 257
1973
-
[38]
J., Finkbeiner, D
Schlegel, D. J., Finkbeiner, D. P ., & Davis, M., 1998, ApJ, 50 0, 525
1998
-
[39]
J., et al
Serlemitsos, P . J., et al. 1995, PASJ 47, 105
1995
-
[40]
2007, PASJ, 59, S9
Serlemitsos, P ., et al. 2007, PASJ, 59, S9
2007
-
[41]
A., Wilson, A
Smith, D. A., Wilson, A. S., Arnaud, K. A., Terashima, Y ., & Y o ung, A. J. 2002, ApJ, 565, 195
2002
-
[42]
K., Brickhouse, N
Smith, R. K., Brickhouse, N. S., Liedahl, D. A., & Raymond, J. C. 2001, ApJ, 556, L91
2001
-
[43]
J., et al
Smith, R. J., et al. 2014, MNRAS, 441, 1628
2014
-
[44]
L., Mushotzky, R
Snowden, S. L., Mushotzky, R. F., Kuntz, K. D., & Davis, D. S. 2 008, A&A, 478, 615 Str¨ uder, L., et al. 2001, A&A, 365, L18
2001
-
[45]
ApJS, 2001, 134, 77
Koyama, K. ApJS, 2001, 134, 77
2001
-
[46]
B., Govoni, F., Allen, S
Taylor, G. B., Govoni, F., Allen, S. W., & Fabian, A. C. 2001, M NRAS, 326, 2
2001
-
[47]
Turner, M. J. L., et al. 2001, A&A, 365, L27 V erner, D. A., Ferland, G. J., Korista, K. T., & Y akovley, D. G . 1996, ApJ, 465, 487
2001
-
[48]
2000, ApJ, 542, 914
Wilms, J., Allen, A.,& McCray, R. 2000, ApJ, 542, 914
2000
-
[49]
2013, MNRAS, 431, 394 Wolfire, M
Willingale, R., et al. 2013, MNRAS, 431, 394 Wolfire, M. G., Hollenbach, D., & McKee, C. F. 2010, ApJ, 716, 1 191 Y amauchi, S., & Ueno, M. 2025, PASJ, 77, 768 Y amauchi, S., Ueno, M., Bamba, A., & Koyama, K. 2010, PASJ, 62 , 219 Y amauchi, S., Bamba, A., & Koyama, K. 2011, PASJ, 63, S957
2013
discussion (0)
Sign in with ORCID, Apple, or X to comment. Anyone can read and Pith papers without signing in.