A Synthetic Control Approach to Conditional Distributional Treatment Effects
Pith reviewed 2026-06-27 14:09 UTC · model grok-4.3
The pith
Synthetic control weights estimated in the parameter space of a distribution regression model identify counterfactual conditional distributions after treatment.
A machine-rendered reading of the paper's core claim, the machinery that carries it, and where it could break.
Core claim
By solving for synthetic control weights via least-squares subject to an adding-up constraint inside the parameter space of the semiparametric distribution regression model, and under a parallel trends condition formulated there, the counterfactual conditional distribution after treatment can be identified and estimated in closed form, with an asymptotic distribution derived that treats distribution regression estimation error and weight estimation error as contributing at equal rates to the variance.
What carries the argument
Least-squares synthetic control weights subject to an adding-up constraint, solved in the parameter space of the semiparametric distribution regression model.
If this is right
- Conditioning on covariates can reveal treatment effects that remain hidden when only the unconditional distribution is examined.
- The asymptotic variance of the counterfactual estimator receives equal-order contributions from distribution regression estimation error and from weight estimation error.
- A supremum test based on a Gaussian process can detect the presence of any treatment effect across the entire conditional distribution.
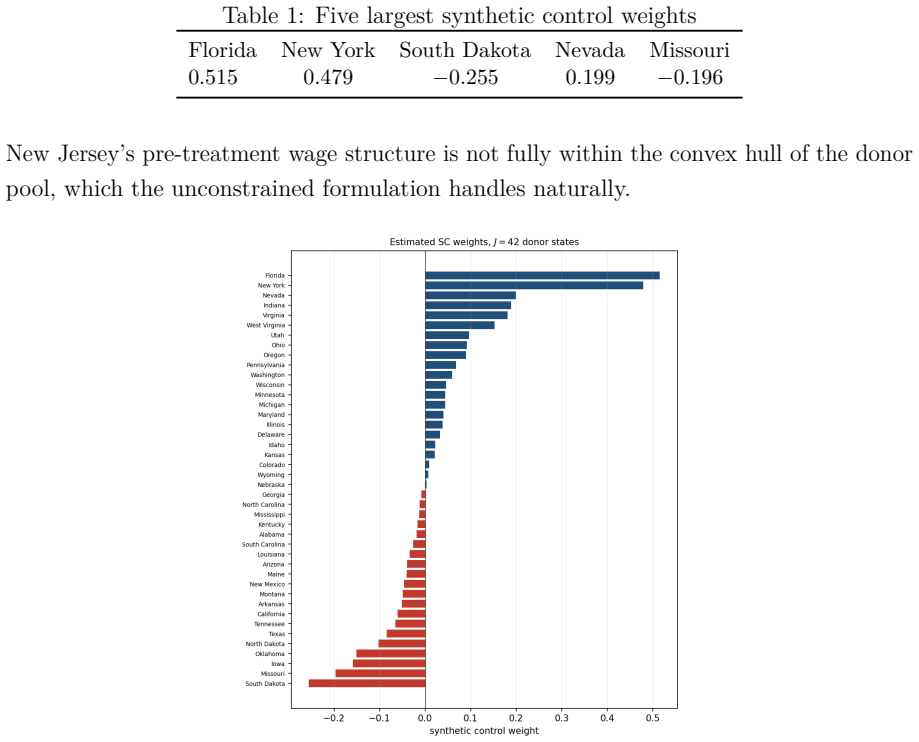
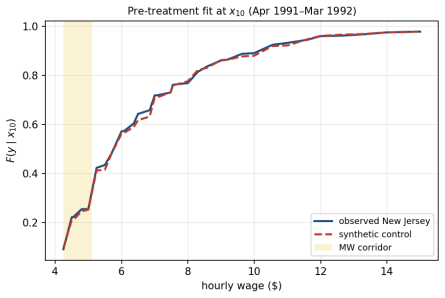
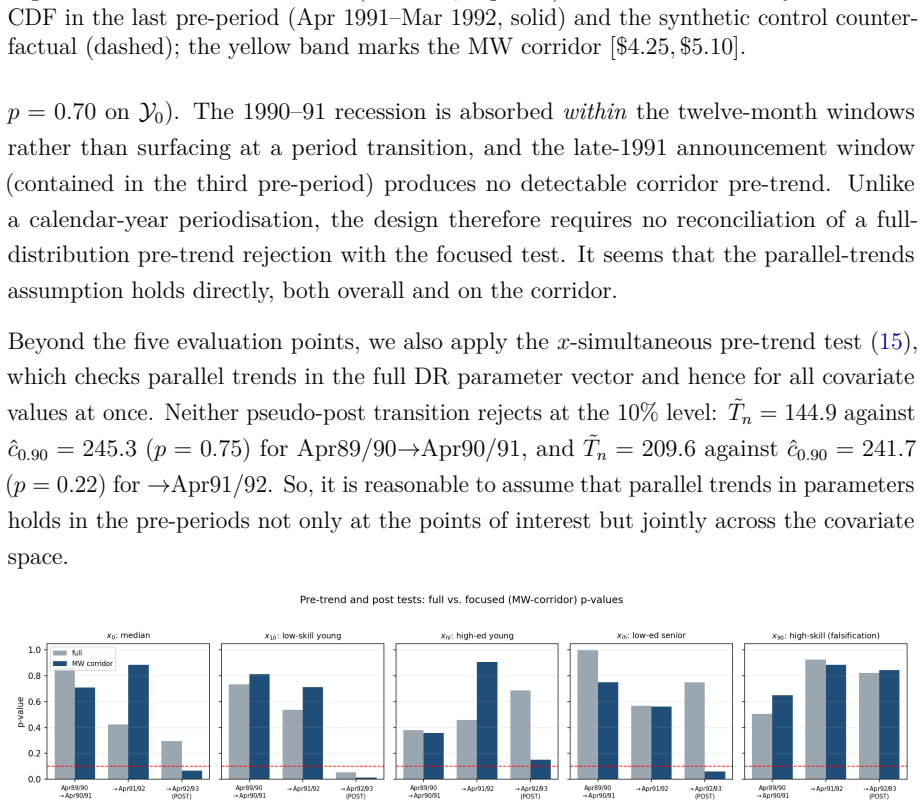
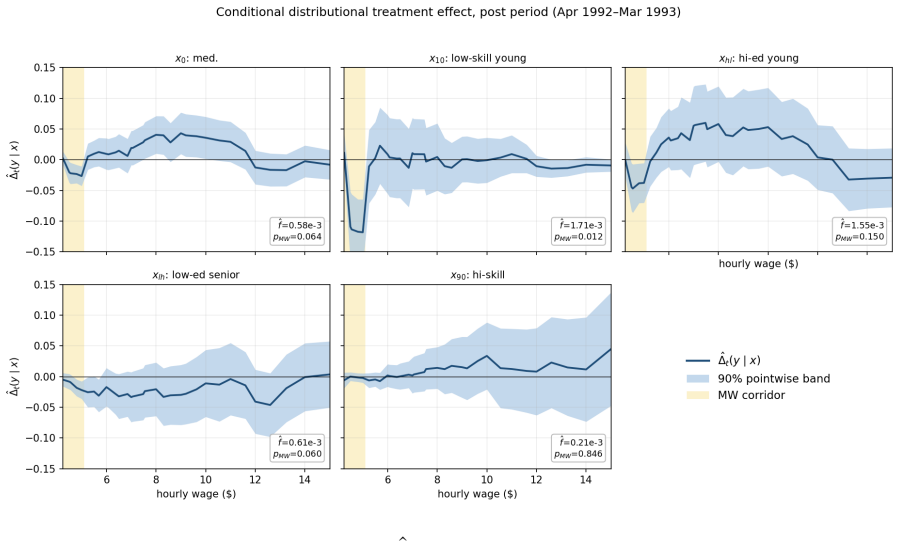
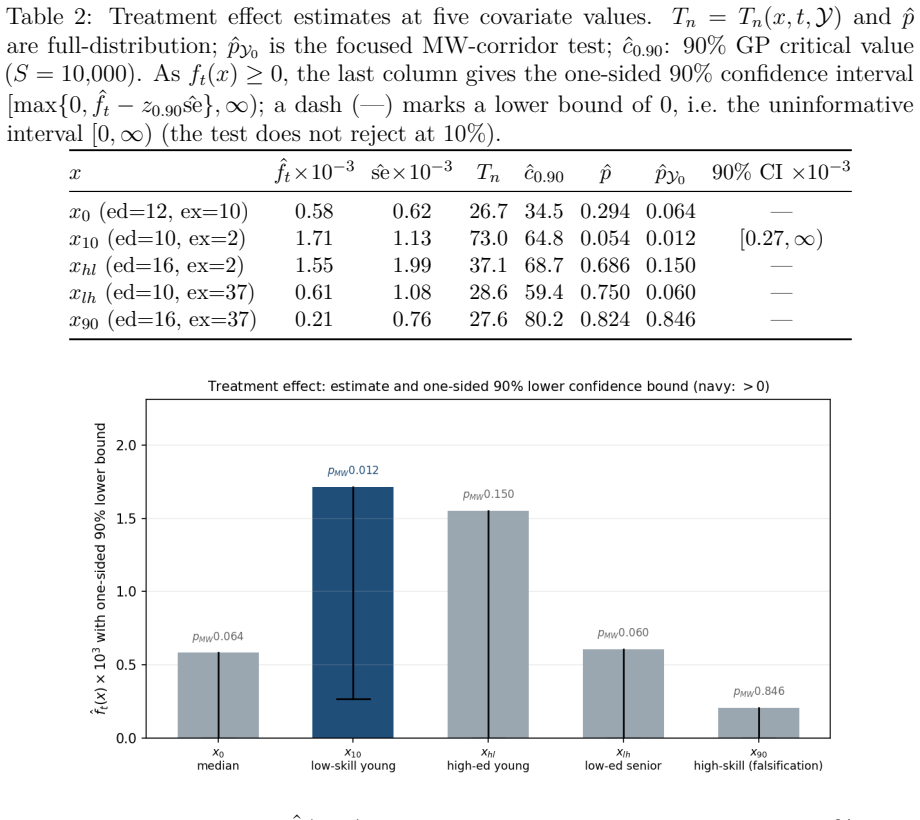
- In the 1992 New Jersey minimum wage application the estimated effects concentrate in the minimum-wage corridor for low-education, low-experience workers.
Where Pith is reading between the lines
- The same weighting device could be applied inside other semiparametric models whose parameters admit a natural parallel-trends restriction.
- The closed-form estimator may simplify computation of subgroup-specific distributional effects without separate estimations for each covariate cell.
- Researchers could examine whether the method remains valid when the adding-up constraint is relaxed or replaced by other linear restrictions on the weights.
Load-bearing premise
The parallel trends condition holds in the parameter space of the semiparametric distribution regression model so that the counterfactual conditional distribution remains inside the model class.
What would settle it
A dataset in which the actual post-treatment conditional distributions deviate from the synthetic-control predictions while the estimated parameters satisfy the parallel-trends condition, or a placebo exercise in which the test incorrectly rejects the null when no treatment occurred.
Figures


read the original abstract
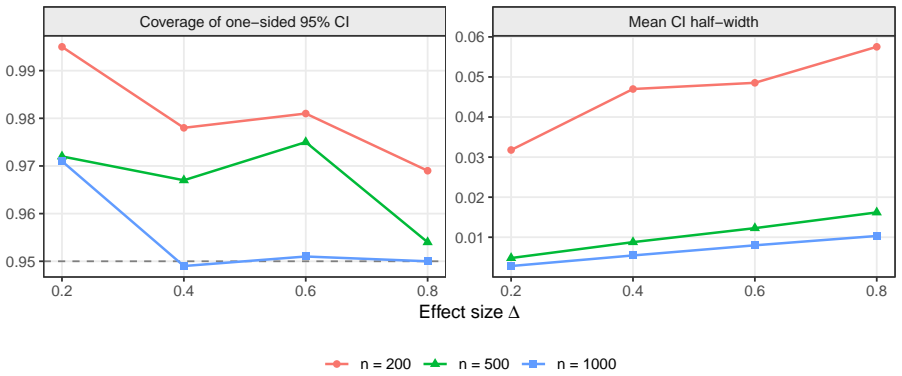
This paper proposes a synthetic control (SC) framework for the estimation of conditional distributional treatment effects. Identification rests on a parallel trends condition formulated in the parameter space of the semiparametric distribution regression (DR) model, which keeps the counterfactual conditional distribution within the model class. The weights solve a least-squares problem subject to an adding-up constraint, yielding a closed-form estimator. We derive the asymptotic distribution of the counterfactual estimator, with DR estimation error and weight estimation error contributing at the same rate to the asymptotic variance. Moreover, we propose a supremum test for the null of no treatment effect, whose limit is the supremum of a Gaussian process. Simulations illustrate that conditioning on covariates can reveal effects being difficult to detect from the unconditional distribution alone. An application to the 1992 New Jersey minimum wage increase using CPS data finds effects concentrated in the minimum-wage corridor for low-education, low-experience workers.
Editorial analysis
A structured set of objections, weighed in public.
Referee Report
Summary. The paper proposes a synthetic control (SC) framework for estimating conditional distributional treatment effects. Identification rests on a parallel trends condition formulated in the parameter space of a semiparametric distribution regression (DR) model, which keeps the counterfactual conditional distribution within the model class. The weights solve a least-squares problem subject to an adding-up constraint, yielding a closed-form estimator. The asymptotic distribution of the counterfactual estimator is derived, with DR estimation error and weight estimation error contributing at the same rate to the asymptotic variance. A supremum test for the null of no treatment effect is proposed, whose limit is the supremum of a Gaussian process. Simulations illustrate that conditioning on covariates can reveal effects difficult to detect unconditionally. An application to the 1992 New Jersey minimum wage increase using CPS data finds effects concentrated in the minimum-wage corridor for low-education, low-experience workers.
Significance. If the derivations hold, the paper makes a useful contribution by extending synthetic control methods to conditional distributional outcomes. Formulating parallel trends directly in DR parameter space ensures the counterfactual stays inside the model class, and the joint asymptotics (with both error sources entering at the same rate) plus the Gaussian-process limit for the supremum test are technical strengths. The simulations and minimum-wage application demonstrate that covariate-conditioned distributional analysis can uncover effects masked in unconditional SC estimates.
minor comments (3)
- [Abstract] Abstract: the claim that DR and weight errors 'contribute at the same rate' is central; a one-sentence reminder of the rate condition (e.g., both o_p(n^{-1/2})) would help readers immediately.
- The parallel-trends assumption is stated in DR parameter space; a short remark on how this differs from the usual SC parallel-trends assumption on the outcome itself would clarify the modeling choice for readers unfamiliar with DR.
- Simulations section: report the exact sample sizes, number of covariates, and grid points used for the supremum statistic so that the Monte Carlo design is fully reproducible.
Simulated Author's Rebuttal
We thank the referee for the positive and accurate summary of our paper and for recommending minor revision. No specific major comments were provided in the report.
Circularity Check
No significant circularity detected
full rationale
The paper formulates identification via an explicit parallel trends assumption stated directly in the DR parameter space, which is a substantive modeling choice that ensures the counterfactual distribution stays inside the semiparametric class by assumption rather than by algebraic reduction to fitted quantities. The synthetic control weights are obtained from a standard constrained least-squares problem that admits a closed-form solution, after which the joint asymptotic distribution is derived in the usual way with both DR and weight estimation errors entering at the same rate. No load-bearing self-citations, self-definitional loops, or renaming of known results appear in the identification or estimation steps. The derivation chain therefore remains self-contained with independent content supplied by the stated assumption and the explicit asymptotic analysis.
Axiom & Free-Parameter Ledger
axioms (1)
- domain assumption Parallel trends condition formulated in the parameter space of the semiparametric distribution regression model
Reference graph
Works this paper leans on
-
[1]
Abadie, A. (2021). Using synthetic controls: Feasibility, data requirements, and methodological aspects. Journal of Economic Literature , 59(2):391--425
2021
-
[2]
Abadie, A., Diamond, A., and Hainmueller, J. (2010). Synthetic control methods for comparative case studies: Estimating the effect of C alifornia's tobacco control program. Journal of the American Statistical Association , 105:493--505
2010
-
[3]
and Gardeazabal, J
Abadie, A. and Gardeazabal, J. (2003). The economic costs of conflict: A case study of the B asque country. American Economic Review , 93:113--132
2003
-
[4]
A., Imbens, G
Arkhangelsky, D., Athey, S., Hirshberg, D. A., Imbens, G. W., and Wager, S. (2021). Synthetic difference-in-differences. American Economic Review , 111:4088--4118
2021
-
[5]
H., Dorn, D., and Hanson, G
Autor, D. H., Dorn, D., and Hanson, G. H. (2013). The china syndrome: Local labor market effects of import competition in the united states. American Economic Review , 103(6):2121--2168
2013
-
[6]
H., Manning, A., and Smith, C
Autor, D. H., Manning, A., and Smith, C. L. (2016). The contribution of the minimum wage to US wage inequality over three decades: A reassessment. American Economic Journal: Applied Economics , 8(1):58--99
2016
-
[7]
Ben-Michael, E., Feller, A., and Rothstein, J. (2021). The augmented synthetic control method. Journal of the American Statistical Association , 116(536):1789--1803
2021
-
[8]
and Erhardt, P
Biewen, M. and Erhardt, P. (2025). Using post-regularization distribution regression to measure the effects of a minimum wage on hourly wages, hours worked and monthly earnings. The Econometrics Journal , page forthcoming
2025
-
[9]
Blanchard, O. J. and Katz, L. F. (1992). Regional evolutions. Brookings Papers on Economic Activity , 1992(1):1--75
1992
-
[10]
and Li, T
Callaway, B. and Li, T. (2019). Quantile treatment effects in difference in differences models with panel data. Quantitative Economics , 10:1579--1618
2019
-
[11]
and Krueger, A
Card, D. and Krueger, A. B. (1994). Minimum wages and employment: A case study of the fast-food industry in new jersey and pennsylvania. American Economic Review , 84(4):772--793
1994
-
[12]
and Lemieux, T
Card, D. and Lemieux, T. (2001). Can falling supply explain the rising return to college for younger men? a cohort-based analysis. Quarterly Journal of Economics , 116(2):705--746
2001
-
[13]
Chen, J. (2023). Synthetic control as online linear regression. Econometrica , 91(2):465--491
2023
-
[14]
Chen, S. and Feng, J. (2026). Group-heterogeneous changes-in-changes and distributional synthetic controls. arXiv , 2307.15313v2
arXiv 2026
-
[15]
Chernozhukov, V., Fern \'a ndez-Val, I., and Galichon, A. (2010). Quantile and probability curves without crossing. Econometrica , 78(3):1093--1125
2010
-
[16]
Chernozhukov, V., Fern \'a ndez-Val, I., and Melly, B. (2013). Inference on counterfactual distributions. Econometrica , 81:2205--2268
2013
-
[17]
Chernozhukov, V., W \"u thrich, K., and Zhu, Y. (2021). An exact and robust conformal inference method for counterfactual and synthetic controls. Journal of the American Statistical Association , 116(536):1849--1864
2021
-
[18]
Dette, H., M \"o llenhoff, K., and Wied, D. (2025). Practically significant differences between conditional distribution functions. arXiv , 2506.06545
arXiv 2025
-
[19]
M., and Lemieux, T
DiNardo, J., Fortin, N. M., and Lemieux, T. (1996). Labor market institutions and the distribution of wages, 1973--1992: A semiparametric approach. Econometrica , 64(5):1001--1044
1996
-
[20]
and Imbens, G
Doudchenko, N. and Imbens, G. W. (2016). Balancing, regression, difference-in-differences and synthetic control methods: A synthesis. NBER Working Paper No. 22791
2016
-
[21]
and Pinto, C
Ferman, B. and Pinto, C. (2021). Synthetic controls with imperfect pre-treatment fit. Quantitative Economics , 12(4):1197--1221
2021
-
[22]
Fernández-Val, I., Meier, J., van Vuuren, A., and Vella, F. (2026). A simple distributional difference-in-differences estimator for univariate and bivariate outcomes. arXiv , 2409.02311v3
Pith/arXiv arXiv 2026
-
[23]
M., and Lemieux, T
Firpo, S., Fortin, N. M., and Lemieux, T. (2009). Unconditional quantile regressions. Econometrica , 77(3):953--973
2009
-
[24]
R., Backman, D., Breton, E., Cooper, G., Rivera Drew, J
Flood, S., King, M., Rodgers, R., Ruggles, S., Warren, J. R., Backman, D., Breton, E., Cooper, G., Rivera Drew, J. A., Richards, S., Van Riper, D., and Williams, K. C. W. (2025). IPUMS CPS: Version 13.0 [Dataset]
2025
-
[25]
and Peracchi, F
Foresi, S. and Peracchi, F. (1995). The conditional distribution of excess returns: An empirical analysis. Journal of the American Statistical Association , 90:451--466
1995
-
[26]
Gunsilius, F. F. (2023). Distributional synthetic controls. Econometrica , 91:1105--1127
2023
-
[27]
Katz, L. F. and Murphy, K. M. (1992). Changes in relative wages, 1963--1987: Supply and demand factors. Quarterly Journal of Economics , 107(1):35--78
1992
-
[28]
Klein, N. (2024). Distributional regression for data analysis. Annual Review of Statistics and Its Application , 11:321--346
2024
-
[29]
Kneib, T., Silbersdorff, A., and S \"a fken, B. (2023). Rage against the mean--- A review of distributional regression approaches. Econometrics and Statistics , 26:99--123
2023
-
[30]
Lechner, M. (2011). The estimation of causal effects by difference-in-difference methods. Foundations and Trends in Econometrics , 4(3):165--224
2011
-
[31]
Machado, J. A. F. and Mata, J. (2005). Counterfactual decomposition of changes in wage distributions using quantile regression. Journal of Applied Econometrics , 20(4):445--465
2005
-
[32]
Melly, B. (2005). Decomposition of differences in distribution using quantile regression. Labour Economics , 12(4):577--590
2005
-
[33]
and Wascher, W
Neumark, D. and Wascher, W. (1992). Employment effects of minimum and subminimum wages: Panel data on state minimum wage laws. ILR Review , 46(1):55--81
1992
-
[34]
and Wied, D
Rothe, C. and Wied, D. (2013). Misspecification testing in a class of conditional distributional models. Journal of the American Statistical Association , 108:314--324
2013
-
[35]
and Stouli, S
Spady, R. and Stouli, S. (2025). Gaussian transforms modeling and the estimation of distributional regression functions. Econometrica , 93(5):1885--1913
2025
-
[36]
van der Vaart, A. W. and Wellner, J. A. (1996). Weak Convergence and Empirical Processes . Springer, New York
1996
-
[37]
Wied, D. (2024). Semiparametric distribution regression with instruments and monotonicity. Labour Economics , 90:102565
2024
discussion (0)
Sign in with ORCID, Apple, or X to comment. Anyone can read and Pith papers without signing in.