Revealing {α}-Element's Past with Subaru/IRD: Oxygen Abundance of 35 Very Metal-Poor Stars from Near-IR OH lines
Pith reviewed 2026-06-26 19:34 UTC · model grok-4.3
The pith
An empirical calibration aligns near-infrared OH oxygen abundances in 35 very metal-poor stars with the forbidden [OI] line, flattening the [O/Fe] trend to match Galactic chemical evolution models.
A machine-rendered reading of the paper's core claim, the machinery that carries it, and where it could break.
Core claim
After homogeneously determining stellar parameters and iron abundances, the authors measure oxygen from both OH and [OI] lines via 1D/LTE spectral synthesis. They identify a systematic discrepancy that varies with temperature and derive a multi-parameter empirical calibration to align the numerous OH-based abundances onto the [OI] reference scale. Applying the correction substantially reduces scatter and temperature dependence while flattening the [O/Fe] trend, bringing the results into fairly good agreement with Galactic chemical evolution models.
What carries the argument
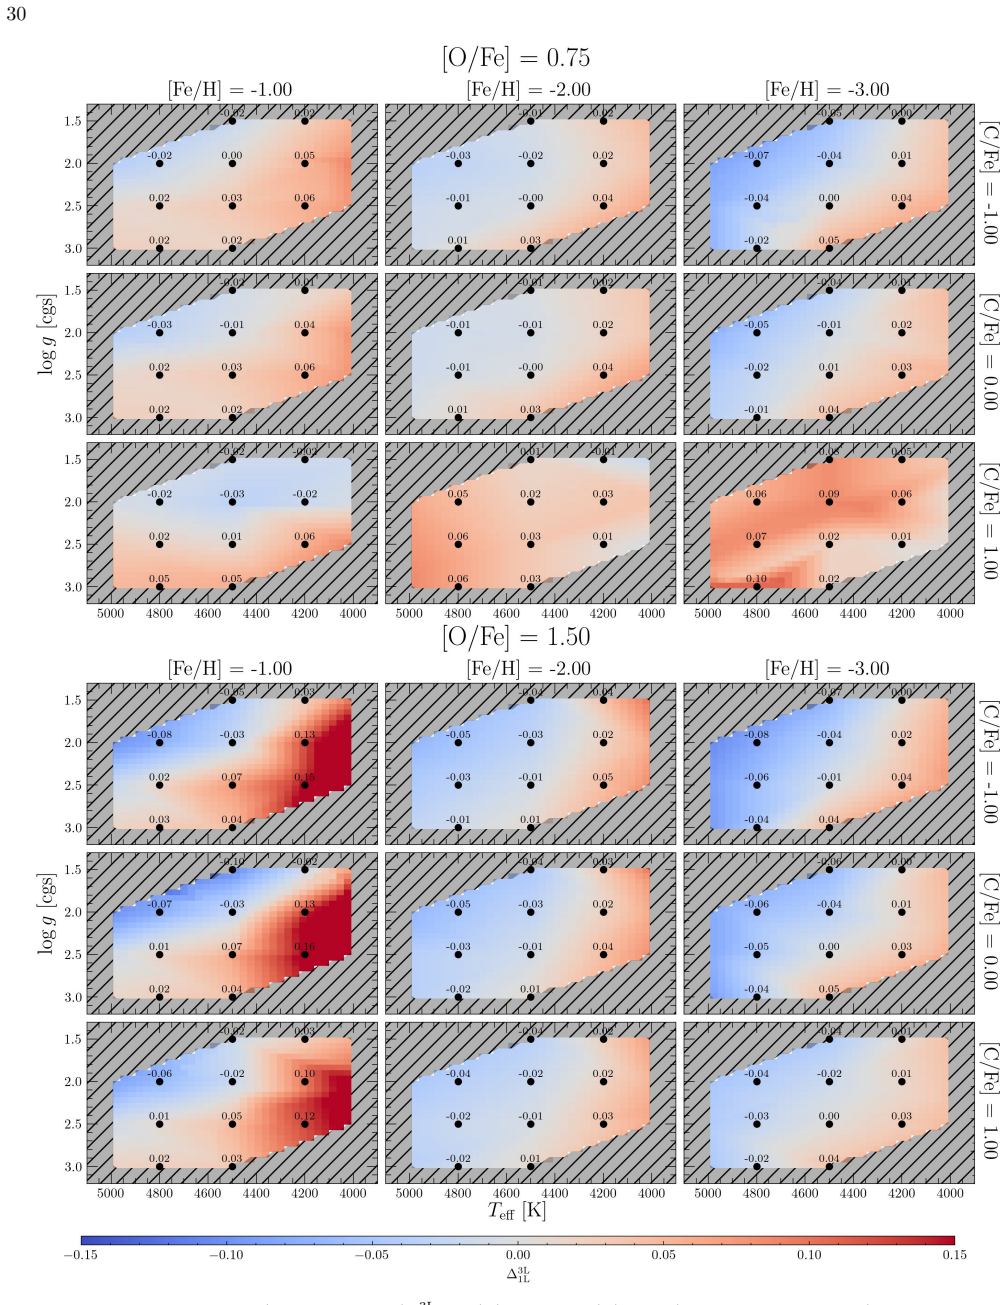
The multi-parameter empirical calibration (as a function of Teff, log g, [Fe/H], and [C/Fe]) that shifts 1D/LTE OH oxygen abundances onto the [OI] 6300Å reference scale.
If this is right
- The numerous measurable NIR OH lines yield smaller random abundance errors than the single weak [OI] line once calibrated.
- The [O/Fe] versus [Fe/H] relation for very metal-poor stars becomes flatter after correction.
- NIR OH lines become usable for precise oxygen work in metal-poor stars when the empirical adjustment is applied.
- The corrected abundances support consistency with predictions from Galactic chemical evolution models.
Where Pith is reading between the lines
- The calibration may allow oxygen measurements in additional metal-poor stars that lack suitable optical spectra for the [OI] line.
- If the [OI] reference carries unrecognized systematics, the improved model agreement could be partly coincidental rather than a true resolution of the abundance trend.
- The method could be extended to test whether similar corrections improve other molecular lines used in abundance studies of old stars.
Load-bearing premise
The forbidden [OI] 6300Å line provides a reliable, unbiased reference abundance scale for calibrating the OH lines.
What would settle it
Independent oxygen measurements in the same stars using 3D/NLTE models or UV OH lines that produce [O/Fe] values significantly different from the corrected NIR results would falsify the calibration's effectiveness.
Figures

read the original abstract
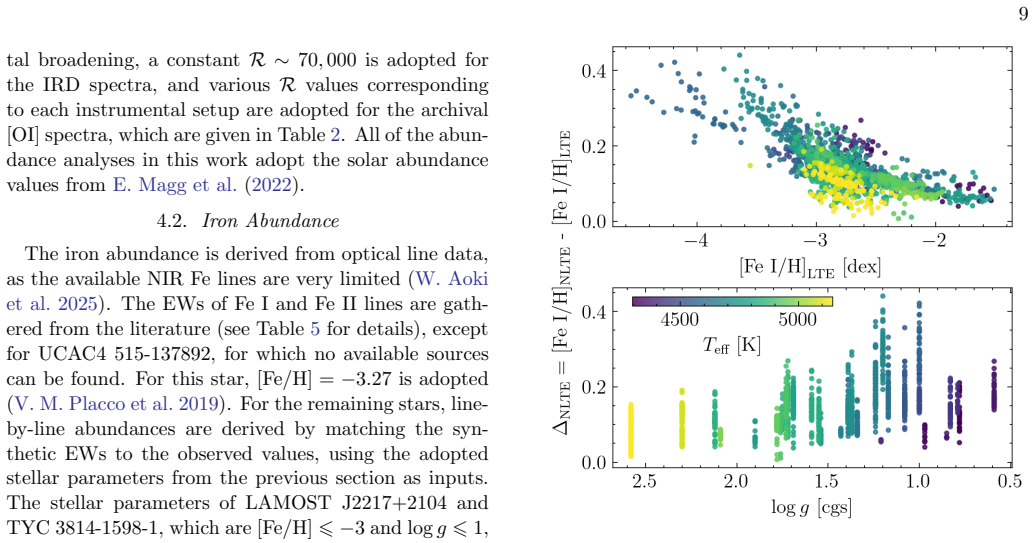
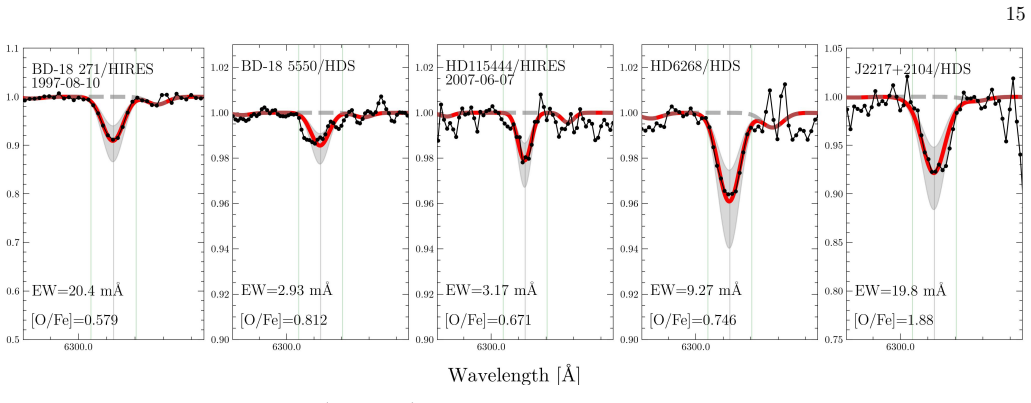
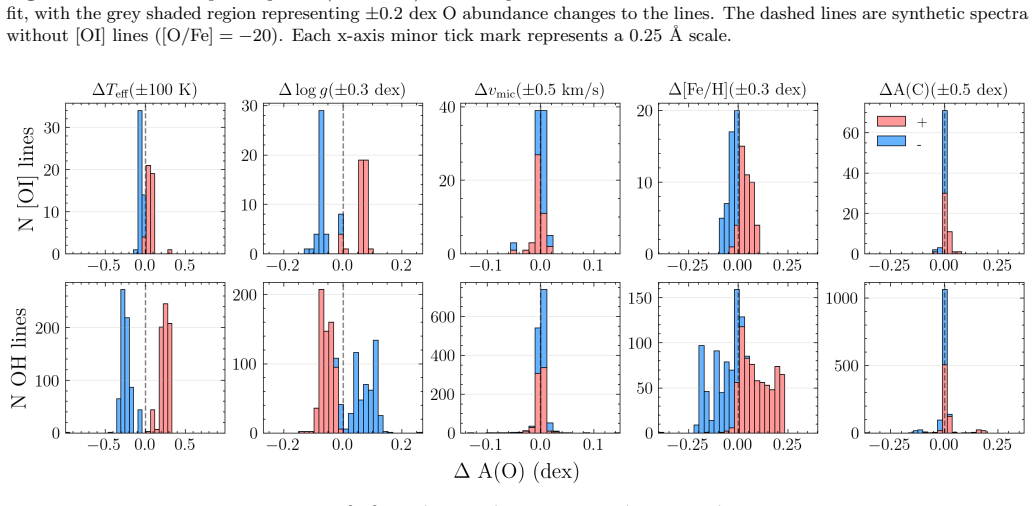
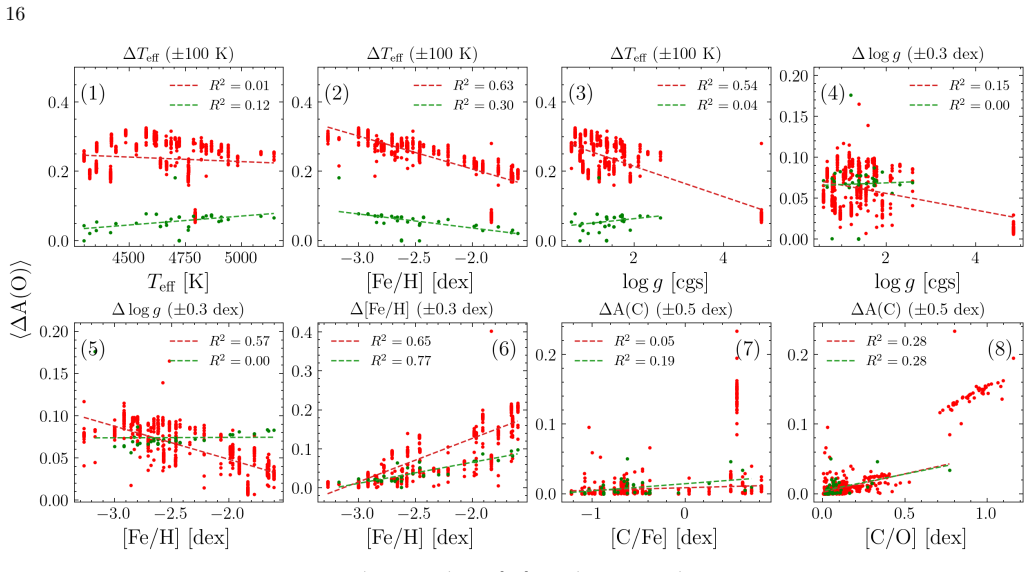
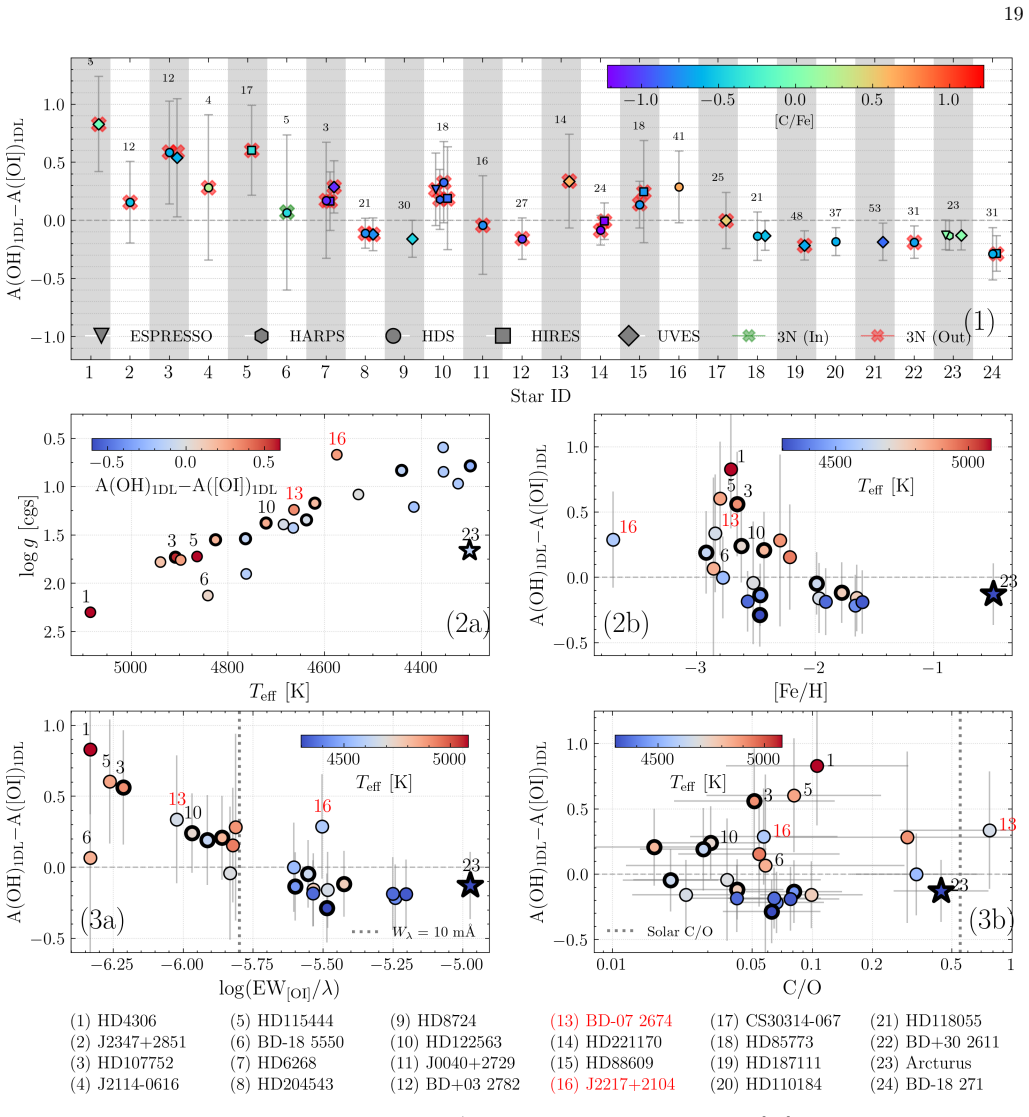
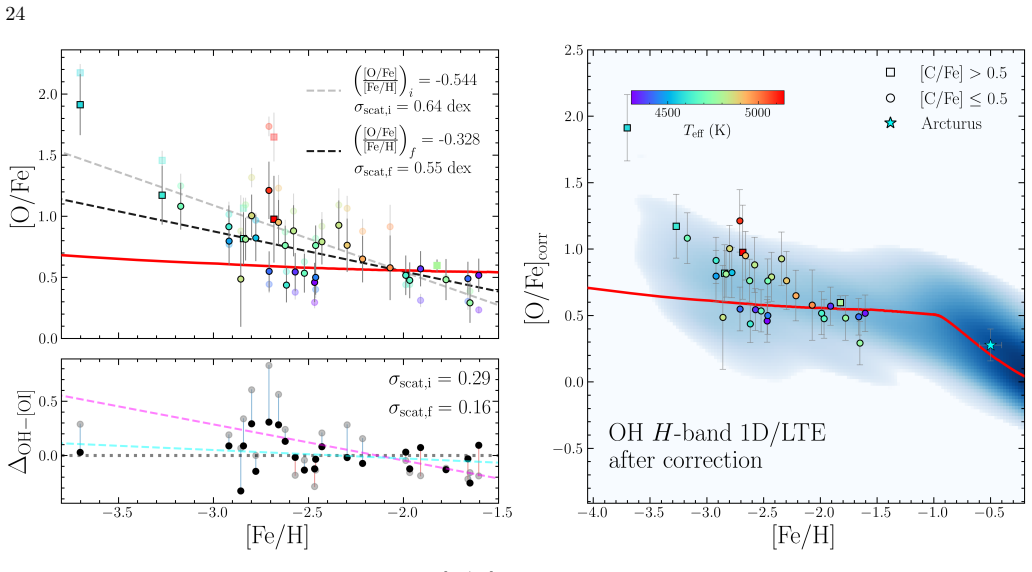
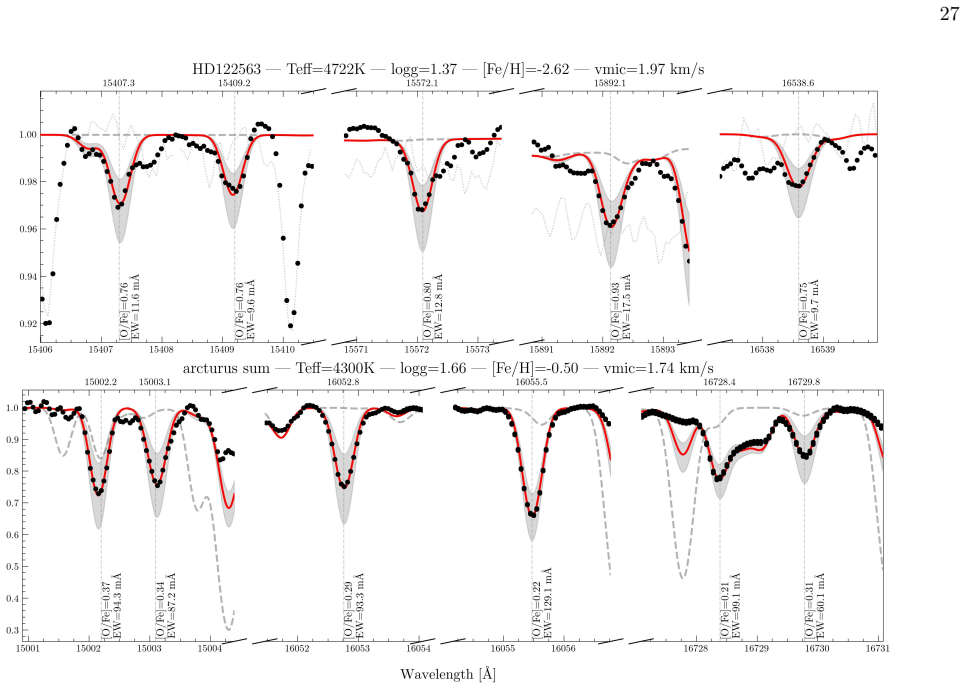
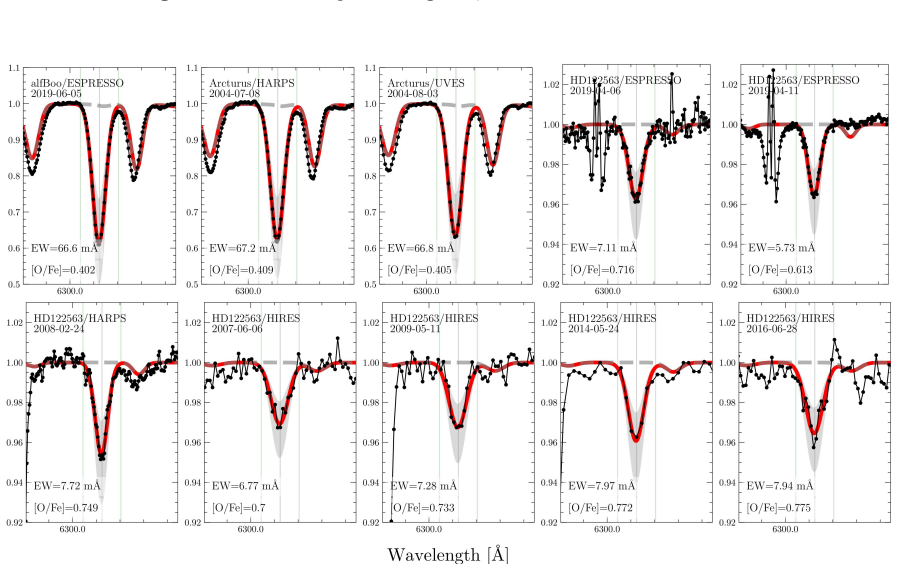
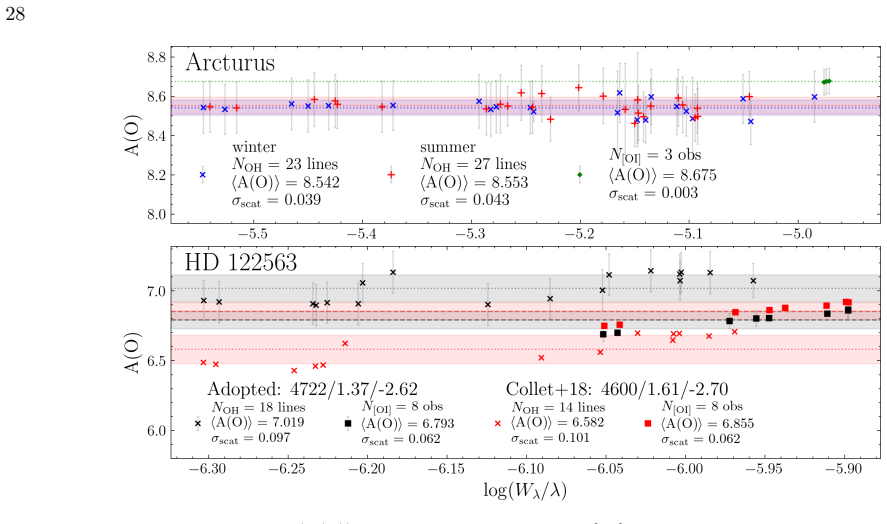
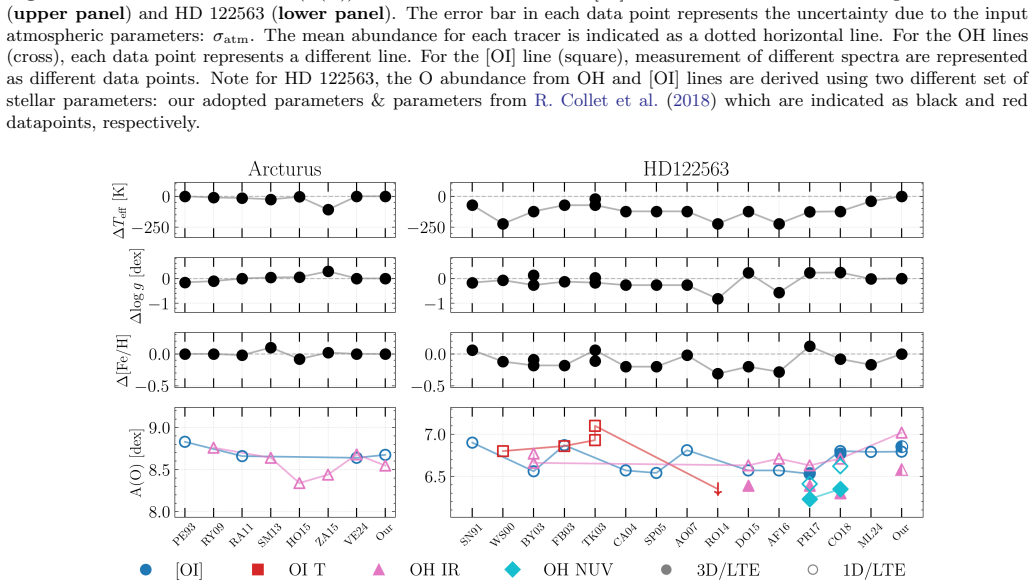
Oxygen abundances in very and extremely metal-poor (V/EMP) stars provide critical constraints on early massive stars' nucleosynthesis. An Oxygen abundance analysis is presented for 35 V/EMP stars (-4.0<[Fe/H]< -1.5) using near-infrared H-band OH vibro-rotational lines from high-resolution Subaru/IRD spectra. To examine the reliability of these NIR OH lines, the results are compared with the abundances obtained from the 3D/NLTE-insensitive forbidden [OI] 6300{\AA} line using archival high-resolution optical spectra. After homogeneously rederiving stellar parameters and 1D/NLTE Fe abundances using Gaia photo-astrometry and literature optical Fe equivalent width data, oxygen abundance from OH and [OI] lines is determined through 1D/LTE spectral synthesis. A sensitivity analysis confirms that near-IR OH lines are highly sensitive to the adopted temperature compared to the forbidden line. A temperature-dependent discrepancy between the tracers is identified: in cool red giants (Teff <4600 K), OH-based abundances are systematically lower than [OI]-based abundance by 0.05 to 0.25 dex, while warmer red giants show higher OH-based abundances as expected from 3D effects. Despite this systematic offset, the numerous measurable NIR OH lines yield significantly smaller random abundance errors than that of the single, weak [OI] line. Leveraging this statistical precision, an empirical calibration as a function of Teff, log g, [Fe/H], and [C/Fe] is derived to align the 1D/LTE OH abundances onto the [OI] scale. Applying this correction substantially reduces the scatter and temperature dependence in the [O/Fe] versus [Fe/H] plane and flattens the trend, bringing the results into fairly good agreement with Galactic chemical evolution models.
Editorial analysis
A structured set of objections, weighed in public.
Referee Report
Summary. The paper measures oxygen abundances for 35 very metal-poor stars (-4.0 < [Fe/H] < -1.5) using near-IR H-band OH vibro-rotational lines from Subaru/IRD spectra. After rederiving stellar parameters and 1D/NLTE Fe abundances, 1D/LTE abundances are derived from both OH lines and the forbidden [OI] 6300Å line. A temperature-dependent offset is identified between the tracers, and a 4-parameter empirical calibration (Teff, log g, [Fe/H], [C/Fe]) is derived from the OH-[OI] differences within the sample to align the OH abundances onto the [OI] scale. Application of this correction reduces scatter and temperature dependence in the [O/Fe] vs [Fe/H] plane and improves agreement with Galactic chemical evolution models.
Significance. If the calibration is demonstrated to be robust and generalizable, the work would be significant because the numerous OH lines offer substantially smaller random errors than the single weak [OI] line, enabling tighter constraints on oxygen yields from early massive stars. The identification of the temperature-dependent discrepancy and the statistical advantage of OH lines are clear strengths.
major comments (1)
- Abstract: the empirical calibration is derived 'to align the 1D/LTE OH abundances onto the [OI] scale' from the differences within these same 35 stars and is then applied to the identical sample to claim reduced scatter, removal of temperature dependence, and improved model agreement. Because the fit is constructed to minimize exactly those differences, the reported improvements are at risk of being tautological; the manuscript must demonstrate that the functional form is physically motivated and generalizes via cross-validation, hold-out tests, or an external sample.
Simulated Author's Rebuttal
We thank the referee for their constructive review and for highlighting the need to demonstrate that the empirical calibration generalizes beyond the fitting sample. We agree this is an important point and will revise the manuscript accordingly.
read point-by-point responses
-
Referee: Abstract: the empirical calibration is derived 'to align the 1D/LTE OH abundances onto the [OI] scale' from the differences within these same 35 stars and is then applied to the identical sample to claim reduced scatter, removal of temperature dependence, and improved model agreement. Because the fit is constructed to minimize exactly those differences, the reported improvements are at risk of being tautological; the manuscript must demonstrate that the functional form is physically motivated and generalizes via cross-validation, hold-out tests, or an external sample.
Authors: We acknowledge the validity of this concern. The calibration is indeed derived from the same 35-star sample, so the reported reductions in scatter and temperature dependence could partly reflect the fitting process itself. The four-parameter form was selected because the sensitivity analysis already showed that the OH-[OI] offset correlates strongly with Teff (and secondarily with log g, [Fe/H], and [C/Fe]), providing a physical basis rather than an arbitrary choice. Nevertheless, to demonstrate generalization we will add a leave-one-out cross-validation analysis in the revised manuscript, reporting the typical prediction error on held-out stars. We will also expand the discussion of the physical motivation for the chosen parameters. We do not have an independent external sample with both OH and [OI] measurements, so cross-validation is the route we will pursue. revision: yes
Circularity Check
Empirical 4-parameter calibration fitted to OH-[OI] differences in the 35-star sample then applied to the same sample to reduce scatter
specific steps
-
fitted input called prediction
[Abstract]
"Leveraging this statistical precision, an empirical calibration as a function of Teff, log g, [Fe/H], and [C/Fe] is derived to align the 1D/LTE OH abundances onto the [OI] scale. Applying this correction substantially reduces the scatter and temperature dependence in the [O/Fe] versus [Fe/H] plane and flattens the trend, bringing the results into fairly good agreement with Galactic chemical evolution models."
The calibration coefficients are obtained by fitting to the observed OH minus [OI] abundance differences within the identical 35-star sample; applying the resulting function to those same stars necessarily shrinks the residuals (scatter, temperature trend) by construction, rendering the reported improvement tautological absent independent validation.
full rationale
The paper derives an empirical correction (function of Teff, log g, [Fe/H], [C/Fe]) explicitly 'to align the 1D/LTE OH abundances onto the [OI] scale' using differences measured in the analyzed stars, then reports that applying the correction 'substantially reduces the scatter and temperature dependence' and improves model agreement. This matches the fitted_input_called_prediction pattern: the improvement is the direct statistical consequence of minimizing the very offsets used to construct the fit, with no cross-validation, hold-out set, or external sample cited to demonstrate generalization beyond the input data.
Axiom & Free-Parameter Ledger
free parameters (1)
- coefficients of the empirical calibration function
axioms (2)
- domain assumption The forbidden [OI] 6300Å line is insensitive to 3D and NLTE effects and therefore serves as the ground-truth reference.
- domain assumption 1D/LTE spectral synthesis is adequate once an empirical correction is applied.
Reference graph
Works this paper leans on
-
[1]
2016, ApJ, 819, 103, doi: 10.3847/0004-637X/819/2/103
Af¸ sar, M., Sneden, C., Frebel, A., et al. 2016, ApJ, 819, 103, doi: 10.3847/0004-637X/819/2/103
-
[2]
M., Asplund, M., Collet, R., & Leenaarts, J
Amarsi, A. M., Asplund, M., Collet, R., & Leenaarts, J. 2016a, MNRAS, 455, 3735, doi: 10.1093/mnras/stv2608
-
[3]
M., Liljegren, S., & Nissen, P
Amarsi, A. M., Liljegren, S., & Nissen, P. E. 2022, A&A, 668, A68, doi: 10.1051/0004-6361/202244542
-
[4]
2016b, MNRAS, 463, 1518, doi: 10.1093/mnras/stw2077
Collet, R. 2016b, MNRAS, 463, 1518, doi: 10.1093/mnras/stw2077
-
[5]
Barklem, P. S. 2019a, A&A, 622, L4, doi: 10.1051/0004-6361/201834480 32
-
[6]
Amarsi, A. M., Nissen, P. E., & Sk´ ulad´ ottir,´A. 2019b, A&A, 630, A104, doi: 10.1051/0004-6361/201936265
-
[7]
2015, ApJ, 811, 64, doi: 10.1088/0004-637X/811/1/64
Aoki, W. 2015, ApJ, 811, 64, doi: 10.1088/0004-637X/811/1/64
-
[8]
2018, PASJ, 70, 94, doi: 10.1093/pasj/psy092
Aoki, W., Matsuno, T., Honda, S., et al. 2018, PASJ, 70, 94, doi: 10.1093/pasj/psy092
-
[9]
Aoki, W., Norris, J. E., Ryan, S. G., Beers, T. C., & Ando, H. 2002, ApJ, 567, 1166, doi: 10.1086/338756
-
[10]
Aoki, W., Honda, S., Beers, T. C., et al. 2007, ApJ, 660, 747, doi: 10.1086/512601
-
[11]
Aoki, W., Beers, T. C., Sivarani, T., et al. 2008, ApJ, 678, 1351, doi: 10.1086/533517
-
[12]
Aoki, W., Beers, T. C., Honda, S., et al. 2022, PASJ, 74, 273, doi: 10.1093/pasj/psab123
-
[13]
Aoki, W., Beers, T. C., Honda, S., et al. 2025, PASJ, psaf017, doi: 10.1093/pasj/psaf017
-
[14]
2019, A&A, 621, A108, doi: 10.1051/0004-6361/201834146
Arentsen, A., Starkenburg, E., Shetrone, M.-D., et al. 2019, A&A, 621, A108, doi: 10.1051/0004-6361/201834146
-
[15]
Asplund, M., & Garc´ ıa P´ erez, A. E. 2001, A&A, 372, 601, doi: 10.1051/0004-6361:20010483
-
[16]
Asplund, M., Nordlund, ˚A., Trampedach, R., & Stein, R. F. 1999, A&A, 346, L17, doi: 10.48550/arXiv.astro-ph/9905059 Astropy Collaboration, Robitaille, T. P., Tollerud, E. J., et al. 2013, A&A, 558, A33, doi: 10.1051/0004-6361/201322068 Astropy Collaboration, Price-Whelan, A. M., Sip˝ ocz, B. M., et al. 2018, AJ, 156, 123, doi: 10.3847/1538-3881/aabc4f As...
work page internal anchor Pith review Pith/arXiv arXiv doi:10.48550/arxiv.astro-ph/9905059 1999
-
[17]
Balachandran, S. C., & Carney, B. W. 1996, AJ, 111, 946, doi: 10.1086/117842
-
[18]
2003, ApJ, 588, 1072, doi: 10.1086/374312
Barbuy, B., Mel´ endez, J., Spite, M., et al. 2003, ApJ, 588, 1072, doi: 10.1086/374312
-
[19]
2024,, Astrophysics Source Code Library, record ascl:2407.001 http://ascl.net/2407.001
Barlow, T. 2024,, Astrophysics Source Code Library, record ascl:2407.001 http://ascl.net/2407.001
2024
-
[20]
Beers, T. C., & Christlieb, N. 2005, ARA&A, 43, 531, doi: 10.1146/annurev.astro.42.053102.134057
-
[21]
2012, MNRAS, 427, 1344, doi: 10.1111/j.1365-2966.2012.22008.x
Bergemann, M., Lind, K., Collet, R., Magic, Z., & Asplund, M. 2012, MNRAS, 427, 27, doi: 10.1111/j.1365-2966.2012.21687.x
-
[22]
2014, in Determination of Atmospheric Parameters of B, ed
Bergemann, M., & Nordlander, T. 2014, in Determination of Atmospheric Parameters of B, ed. E. Niemczura, B. Smalley, & W. Pych, 169–185, doi: 10.1007/978-3-319-06956-2 16
-
[23]
2021, MNRAS, 508, 2236, doi: 10.1093/mnras/stab2160
Bergemann, M., Hoppe, R., Semenova, E., et al. 2021, MNRAS, 508, 2236, doi: 10.1093/mnras/stab2160
-
[24]
2014, A&A, 569, A111, doi: 10.1051/0004-6361/201423945
Blanco-Cuaresma, S., Soubiran, C., Heiter, U., & Jofr´ e, P. 2014, A&A, 569, A111, doi: 10.1051/0004-6361/201423945
-
[25]
Bonifacio, P., Monai, S., & Beers, T. C. 2000, AJ, 120, 2065, doi: 10.1086/301566
-
[26]
2026, ApJ, 997, 203, doi: 10.3847/1538-4357/ae27a1
Tennyson, J. 2026, ApJ, 997, 203, doi: 10.3847/1538-4357/ae27a1
-
[27]
Brooke, J. S. A., Bernath, P. F., Western, C. M., et al. 2016, JQSRT, 168, 142, doi: 10.1016/j.jqsrt.2015.07.021
-
[28]
2018, ApJ, 864, 43, doi: 10.3847/1538-4357/aad37d
Cain, M., Frebel, A., Gull, M., et al. 2018, ApJ, 864, 43, doi: 10.3847/1538-4357/aad37d
-
[29]
Cardelli, J. A., Clayton, G. C., & Mathis, J. S. 1989, ApJ, 345, 245, doi: 10.1086/167900
-
[30]
Casagrande, L., Portinari, L., Glass, I. S., et al. 2014, MNRAS, 439, 2060, doi: 10.1093/mnras/stu089
-
[31]
2004, A&A, 416, 1117, doi: 10.1051/0004-6361:20034074
Cayrel, R., Depagne, E., Spite, M., et al. 2004, A&A, 416, 1117, doi: 10.1051/0004-6361:20034074
-
[32]
2016, ApJ, 823, 102, doi: 10.3847/0004-637X/823/2/102
Choi, J., Dotter, A., Conroy, C., et al. 2016, ApJ, 823, 102, doi: 10.3847/0004-637X/823/2/102
work page internal anchor Pith review doi:10.3847/0004-637x/823/2/102 2016
-
[33]
2007, A&A, 469, 687, doi: 10.1051/0004-6361:20066321
Collet, R., Asplund, M., & Trampedach, R. 2007, A&A, 469, 687, doi: 10.1051/0004-6361:20066321
-
[34]
2018, MNRAS, 475, 3369, doi: 10.1093/mnras/sty002
Trampedach, R. 2018, MNRAS, 475, 3369, doi: 10.1093/mnras/sty002
-
[35]
2000, in Society of Photo-Optical Instrumentation Engineers (SPIE) Conference Series, Vol
Kotzlowski, H. 2000, in Society of Photo-Optical Instrumentation Engineers (SPIE) Conference Series, Vol. 4008, Optical and IR Telescope Instrumentation and Detectors, ed. M. Iye & A. F. Moorwood, 534–545, doi: 10.1117/12.395512
-
[36]
2015, A&A, 576, A128, doi: 10.1051/0004-6361/201424885
Dobrovolskas, V., Kuˇ cinskas, A., Bonifacio, P., et al. 2015, A&A, 576, A128, doi: 10.1051/0004-6361/201424885
-
[37]
2016, ApJS, 222, 8, doi: 10.3847/0067-0049/222/1/8
Dotter, A. 2016, ApJS, 222, 8, doi: 10.3847/0067-0049/222/1/8
work page internal anchor Pith review doi:10.3847/0067-0049/222/1/8 2016
-
[38]
Mello, G. F., & Steffen, M. 2016, A&A, 585, A75, doi: 10.1051/0004-6361/201526783
-
[39]
2024, A&A, 688, A52, doi: 10.1051/0004-6361/202348448
Eitner, P., Bergemann, M., Hoppe, R., et al. 2024, A&A, 688, A52, doi: 10.1051/0004-6361/202348448
-
[40]
Akerman, C. 2009, A&A, 500, 1143, doi: 10.1051/0004-6361/200810095 Fernandes de Melo, R., Lombardo, L., Alencastro Puls, A., et al. 2024, A&A, 691, A220, doi: 10.1051/0004-6361/202451173
-
[41]
Fulbright, J. P. 2000, AJ, 120, 1841, doi: 10.1086/301548
-
[42]
Fulbright, J. P., & Johnson, J. A. 2003, ApJ, 595, 1154, doi: 10.1086/377443 Gaia Collaboration, Babusiaux, C., van Leeuwen, F., et al. 2018, A&A, 616, A10, doi: 10.1051/0004-6361/201832843 Gaia Collaboration, Vallenari, A., Brown, A. G. A., et al. 2023, A&A, 674, A1, doi: 10.1051/0004-6361/202243940 33
-
[43]
J., Caffau, E., Bonifacio, P., et al
Gallagher, A. J., Caffau, E., Bonifacio, P., et al. 2016, A&A, 593, A48, doi: 10.1051/0004-6361/201628602
-
[44]
Gerber, J. M., Magg, E., Plez, B., et al. 2023, A&A, 669, A43, doi: 10.1051/0004-6361/202243673
-
[45]
2008, A&A, 486, 951, doi: 10.1051/0004-6361:200809724
Gustafsson, B., Edvardsson, B., Eriksson, K., et al. 2008, A&A, 486, 951, doi: 10.1051/0004-6361:200809724
-
[46]
Hansen, T. T., Holmbeck, E. M., Beers, T. C., et al. 2018, ApJ, 858, 92, doi: 10.3847/1538-4357/aabacc
-
[47]
2011, A&A, 529, A158, doi: 10.1051/0004-6361/201015782
Hayek, W., Asplund, M., Collet, R., & Nordlund, ˚A. 2011, A&A, 529, A158, doi: 10.1051/0004-6361/201015782
-
[48]
2021, A&A, 645, A106, doi: 10.1051/0004-6361/201936291
Heiter, U., Lind, K., Bergemann, M., et al. 2021, A&A, 645, A106, doi: 10.1051/0004-6361/201936291
-
[49]
1995, PASP, 107, 1042, doi: 10.1086/133660
Hinkle, K., Wallace, L., & Livingston, W. 1995, PASP, 107, 1042, doi: 10.1086/133660
-
[50]
Hinkle, K. H., & Lambert, D. L. 1975, MNRAS, 170, 447, doi: 10.1093/mnras/170.3.447 Høg, E., Fabricius, C., Makarov, V. V., et al. 2000, A&A, 355, L27
-
[51]
Hollek, J. K., Frebel, A., Roederer, I. U., et al. 2011, ApJ, 742, 54, doi: 10.1088/0004-637X/742/1/54
-
[52]
Holmbeck, E. M., Beers, T. C., Roederer, I. U., et al. 2018, ApJL, 859, L24, doi: 10.3847/2041-8213/aac722
-
[53]
Holtzman, J. A., Shetrone, M., Johnson, J. A., et al. 2015, AJ, 150, 148, doi: 10.1088/0004-6256/150/5/148
-
[54]
Honda, S., Aoki, W., Beers, T. C., & Takada-Hidai, M. 2011, ApJ, 730, 77, doi: 10.1088/0004-637X/730/2/77
-
[55]
2004, ApJ, 607, 474, doi: 10.1086/383406
Honda, S., Aoki, W., Kajino, T., et al. 2004, ApJ, 607, 474, doi: 10.1086/383406
-
[56]
2024, The Astrophysical Journal, 975, 19, doi: 10.3847/1538-4357/ad7110
Huber, D., Slumstrup, D., Hon, M., et al. 2024, The Astrophysical Journal, 975, 19, doi: 10.3847/1538-4357/ad7110
-
[57]
Ishigaki, M. N., Aoki, W., & Chiba, M. 2013, ApJ, 771, 67, doi: 10.1088/0004-637X/771/1/67
-
[58]
Ishigaki, M. N., Chiba, M., & Aoki, W. 2012, ApJ, 753, 64, doi: 10.1088/0004-637X/753/1/64
-
[59]
2016, in IOS Press, 87–90, doi: 10.3233/978-1-61499-649-1-87
Kluyver, T., Ragan-Kelley, B., P´ erez, F., et al. 2016, in IOS Press, 87–90, doi: 10.3233/978-1-61499-649-1-87
-
[60]
Kobayashi, C., Karakas, A. I., & Lugaro, M. 2020, ApJ, 900, 179, doi: 10.3847/1538-4357/abae65
-
[61]
2018, in Society of Photo-Optical Instrumentation Engineers (SPIE) Conference Series, Vol
Kotani, T., Tamura, M., Nishikawa, J., et al. 2018, in Society of Photo-Optical Instrumentation Engineers (SPIE) Conference Series, Vol. 10702, Ground-based and Airborne Instrumentation for Astronomy VII, ed. C. J
2018
-
[62]
Evans, L. Simard, & H. Takami, 1070211, doi: 10.1117/12.2311836
-
[63]
Kraft, R. P., Suntzeff, N. B., Langer, G. E., et al. 1982, PASP, 94, 55, doi: 10.1086/130941
-
[64]
Stempels, H. C., & Weiss, W. W. 2000, Baltic Astronomy, 9, 590, doi: 10.1515/astro-2000-0420
-
[65]
Lai, D. K., Johnson, J. A., Bolte, M., & Lucatello, S. 2007, ApJ, 667, 1185, doi: 10.1086/520949
-
[66]
2022, ApJ, 931, 147, doi: 10.3847/1538-4357/ac6514
Li, H., Aoki, W., Matsuno, T., et al. 2022, ApJ, 931, 147, doi: 10.3847/1538-4357/ac6514
-
[67]
Li, H. N., Ludwig, H. G., Caffau, E., Christlieb, N., & Zhao, G. 2013, ApJ, 765, 51, doi: 10.1088/0004-637X/765/1/51
-
[68]
Lind, K., & Amarsi, A. M. 2024, ARA&A, 62, 475, doi: 10.1146/annurev-astro-052722-103557
-
[69]
2022, A&A, 661, A140, doi: 10.1051/0004-6361/202142971
Magg, E., Bergemann, M., Serenelli, A., et al. 2022, A&A, 661, A140, doi: 10.1051/0004-6361/202142971
-
[70]
2013, A&A, 557, A26, doi: 10.1051/0004-6361/201321274
Magic, Z., Collet, R., Asplund, M., et al. 2013, A&A, 557, A26, doi: 10.1051/0004-6361/201321274
-
[71]
2025, The Astrophysical Journal, 986, 144, doi: 10.3847/1538-4357/add0b4
Marasco, C., Tayar, J., & Nidever, D. 2025, The Astrophysical Journal, 986, 144, doi: 10.3847/1538-4357/add0b4
-
[72]
2011, A&A, 528, A87, doi: 10.1051/0004-6361/201015336
Grupp, F. 2011, A&A, 528, A87, doi: 10.1051/0004-6361/201015336
-
[73]
2017, A&A, 608, A89, doi: 10.1051/0004-6361/201731582
Mashonkina, L., Jablonka, P., Sitnova, T., Pakhomov, Y., & North, P. 2017, A&A, 608, A89, doi: 10.1051/0004-6361/201731582
-
[74]
2003, The Messenger, 114, 20 Mel´ endez, J., & Barbuy, B
Mayor, M., Pepe, F., Queloz, D., et al. 2003, The Messenger, 114, 20 Mel´ endez, J., & Barbuy, B. 2002, ApJ, 575, 474, doi: 10.1086/341142 Mel´ endez, J., Barbuy, B., & Spite, F. 2001, ApJ, 556, 858, doi: 10.1086/321624
-
[75]
2024, A&A, 687, A229, doi: 10.1051/0004-6361/202449816
Mishenina, T., Pignatari, M., Usenko, I., et al. 2024, A&A, 687, A229, doi: 10.1051/0004-6361/202449816
-
[76]
Mittal, S., & Roederer, I. U. 2025, AJ, 169, 172, doi: 10.3847/1538-3881/adadf0
-
[77]
Morton, T. D. 2015,, Astrophysics Source Code Library, record ascl:1503.010 http://ascl.net/1503.010
2015
-
[78]
2021, A&A, 653, A90, doi: 10.1051/0004-6361/202140979
Mucciarelli, A., Bellazzini, M., & Massari, D. 2021, A&A, 653, A90, doi: 10.1051/0004-6361/202140979
-
[79]
2002, PASJ, 54, 855, doi: 10.1093/pasj/54.6.855
Noguchi, K., Aoki, W., Kawanomoto, S., et al. 2002, PASJ, 54, 855, doi: 10.1093/pasj/54.6.855
-
[80]
2013, ARA&A, 51, 457, doi: 10.1146/annurev-astro-082812-140956
Nomoto, K., Kobayashi, C., & Tominaga, N. 2013, ARA&A, 51, 457, doi: 10.1146/annurev-astro-082812-140956
discussion (0)
Sign in with ORCID, Apple, or X to comment. Anyone can read and Pith papers without signing in.