Simultaneous Prediction Intervals for Patient-Specific Survival Curves
Pith reviewed 2026-05-25 16:09 UTC · model grok-4.3
The pith
Adapts existing and introduces new methods to add simultaneous prediction intervals to patient-specific survival curves produced by ISD models.
A machine-rendered reading of the paper's core claim, the machinery that carries it, and where it could break.
Core claim
an existing method for estimating simultaneous prediction intervals from samples can easily be adapted for patient-specific survival curve analysis and yields accurate results. Furthermore, we introduce both a modification to the existing method and a novel method for estimating simultaneous prediction intervals and show that they offer competitive performance.
Load-bearing premise
That sampling the distribution of interest is tractable and that the adaptation of the sampling-based interval method preserves accuracy when applied to survival curves (stated as a general condition in the abstract).
Figures




read the original abstract
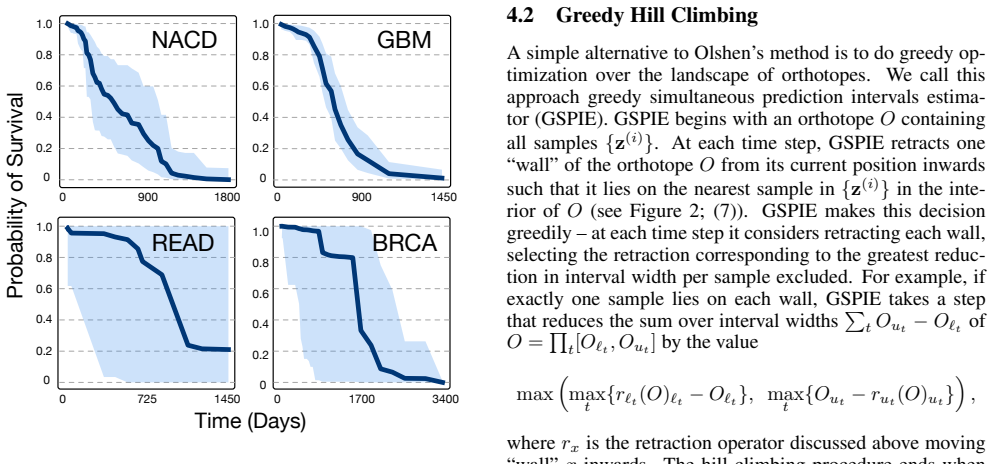
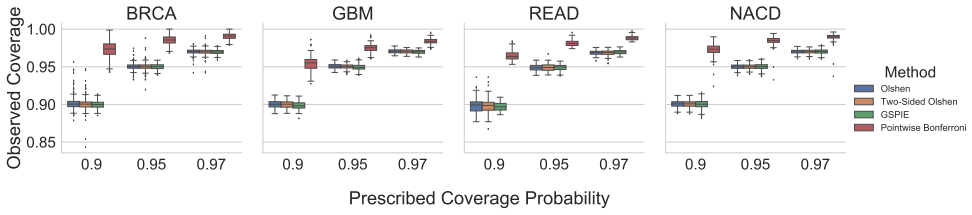
Accurate models of patient survival probabilities provide important information to clinicians prescribing care for life-threatening and terminal ailments. A recently developed class of models - known as individual survival distributions (ISDs) - produces patient-specific survival functions that offer greater descriptive power of patient outcomes than was previously possible. Unfortunately, at the time of writing, ISD models almost universally lack uncertainty quantification. In this paper, we demonstrate that an existing method for estimating simultaneous prediction intervals from samples can easily be adapted for patient-specific survival curve analysis and yields accurate results. Furthermore, we introduce both a modification to the existing method and a novel method for estimating simultaneous prediction intervals and show that they offer competitive performance. It is worth emphasizing that these methods are not limited to survival analysis and can be applied in any context in which sampling the distribution of interest is tractable. Code is available at https://github.com/ssokota/spie .
Editorial analysis
A structured set of objections, weighed in public.
Referee Report
Summary. The manuscript claims that an existing sampling-based procedure for constructing simultaneous prediction intervals can be directly adapted to individual survival distributions (ISDs), that a simple modification of that procedure and a new method also yield competitive coverage, and that the approach applies to any distribution from which samples can be drawn. Public code is supplied.
Significance. If the empirical claims hold, the work supplies the first practical route to simultaneous interval estimates for patient-specific survival curves, addressing a clear gap in ISD modeling. The explicit generality statement and the release of reproducible code are concrete strengths that increase the potential impact beyond survival analysis.
major comments (1)
- [§4.3, Table 2] §4.3 and Table 2: the reported coverage probabilities for the novel method are shown only on three datasets; without an ablation that isolates the effect of the censoring mechanism on the sampling step, it is unclear whether the competitive performance generalizes to heavily censored regimes that are common in clinical survival data.
minor comments (2)
- The notation for the survival function S(t|x) is introduced without an explicit statement of the support of t; adding this would remove ambiguity when the methods are applied to discrete-time ISDs.
- Figure 3 caption does not state the number of Monte Carlo samples used to generate the intervals; this detail is needed to reproduce the visual results.
Simulated Author's Rebuttal
We thank the referee for the constructive comment and the recommendation of minor revision. We address the point below.
read point-by-point responses
-
Referee: [§4.3, Table 2] §4.3 and Table 2: the reported coverage probabilities for the novel method are shown only on three datasets; without an ablation that isolates the effect of the censoring mechanism on the sampling step, it is unclear whether the competitive performance generalizes to heavily censored regimes that are common in clinical survival data.
Authors: We agree that an explicit ablation isolating the censoring mechanism would strengthen the empirical claims. The three datasets in Table 2 already span a range of censoring rates (approximately 30-70%), and the sampling-based procedures are applied post-training to draws from the fitted ISD. Nevertheless, to directly address the concern, we will add results on one or more additional datasets with censoring rates above 80% and include a short ablation that varies the censoring level while holding the ISD model fixed. These additions will appear in the revised §4.3 and an expanded Table 2. revision: yes
Circularity Check
No significant circularity
full rationale
The paper frames its contribution as an adaptation of an existing sampling-based method for simultaneous prediction intervals to individual survival distributions, plus a modification and novel method, all under the general condition that sampling the target distribution is tractable. The abstract and provided context contain no equations, fitted parameters, or self-citations that reduce the claimed results to inputs by construction; empirical validation on accuracy is reported separately, and the methods are explicitly positioned as general-purpose rather than survival-specific. This leaves the derivation chain self-contained against external benchmarks with no load-bearing self-referential steps.
Axiom & Free-Parameter Ledger
axioms (1)
- domain assumption Sampling the distribution of interest is tractable
Reference graph
Works this paper leans on
-
[1]
Analysis-ready standardized tcga data from broad gdac firehose 2016 01 28 run,
[Broad Institute TCGA Genome Data Analysis Center, 2016] Broad Institute TCGA Genome Data Analysis Center. Analysis-ready standardized tcga data from broad gdac firehose 2016 01 28 run,
work page 2016
-
[2]
Pre- dicting survival probabilities with semiparametric trans- formation models
[Cheng et al., 1997] SC Cheng, LJ Wei, and Z Ying. Pre- dicting survival probabilities with semiparametric trans- formation models. Journal of the American Statistical Association,
work page 1997
-
[3]
[Colditz and Rosner, 2000] Graham A. Colditz and Bernard A Rosner. Cumulative risk of breast cancer to age 70 years according to risk factor status: data from the nurses’ health study. American journal of epidemiology,
work page 2000
-
[4]
Regression models and life- tables
[Cox, 1972] David R Cox. Regression models and life- tables. Journal of the Royal Statistical Society: Series B (Methodological), 34(2):187–202,
work page 1972
-
[5]
[Giunchiglia et al., 2018] Eleonora Giunchiglia, Anton Nemchenko, and Mihaela van der Schaar. Rnn-surv: 4One can simply take more model samples to verify that esti- mated intervals meet their prescription, as was done in our experi- ments. A deep recurrent model for survival analysis. In In- ternational Conference on Artificial Neural Networks . Springer,
work page 2018
-
[6]
A report on the natural duration of cancer
[Greenwood and others, 1926] Major Greenwood et al. A report on the natural duration of cancer. A Report on the Natural Duration of Cancer.,
work page 1926
-
[7]
Evaluating derivatives: principles and techniques of algorithmic differentiation , volume
[Griewank and Walther, 2008] Andreas Griewank and An- drea Walther. Evaluating derivatives: principles and techniques of algorithmic differentiation , volume
work page 2008
-
[8]
Effective ways to build and evaluate individual survival distributions
[Haider et al., 2018] Humza Haider, Bret Hoehn, Sarah Davis, and Russell Greiner. Effective ways to build and evaluate individual survival distributions. arXiv:1811.11347,
-
[9]
Confidence bands for a survival curve from censored data
[Hall and Wellner, 1980] Wendy J Hall and Jon A Wellner. Confidence bands for a survival curve from censored data. Biometrika,
work page 1980
-
[10]
The no-u-turn sampler: adaptively setting path lengths in hamiltonian monte carlo
[Hoffman and Gelman, 2014] Matthew D Hoffman and An- drew Gelman. The no-u-turn sampler: adaptively setting path lengths in hamiltonian monte carlo. Journal of Ma- chine Learning Research,
work page 2014
-
[11]
[Ishwaran and Lu, 2008] Hemant Ishwaran and Min Lu. Random survival forests. Wiley StatsRef: Statistics Refer- ence Online, pages 1–13,
work page 2008
-
[12]
[Kalbfleisch and Prentice, 2002 ] J. D. Kalbfleisch and R. L. Prentice. The Statistical Analysis of Failure Time Data . John Wiley & Sons, 2nd edition,
work page 2002
-
[13]
[Kaplan and Meier, 1958] E. L. Kaplan and Paul Meier. Nonparametric estimation from incomplete observations. Journal of the American Statistical Association,
work page 1958
-
[14]
Deep survival: A deep cox proportional hazards network
[Katzman et al., 2016] Jared L Katzman, Uri Shaham, Alexander Cloninger, Jonathan Bates, Tingting Jiang, and Yuval Kluger. Deep survival: A deep cox proportional hazards network. stat,
work page 2016
-
[15]
Con- fidence bands for survival curves under the proportional hazards model
[Lin et al., 1994] DY Lin, TR Fleming, and LJ Wei. Con- fidence bands for survival curves under the proportional hazards model. Biometrika,
work page 1994
-
[16]
Deep Learning for Patient-Specific Kidney Graft Survival Analysis
[Luck et al., 2017] Margaux Luck, Tristan Sylvain, H´elo¨ıse Cardinal, Andrea Lodi, and Yoshua Bengio. Deep learn- ing for patient-specific kidney graft survival analysis. arXiv:1705.10245,
work page internal anchor Pith review Pith/arXiv arXiv 2017
-
[17]
Confidence bands for survival functions with censored data: a comparative study
[Nair, 1984] Vijayan N Nair. Confidence bands for survival functions with censored data: a comparative study. Tech- nometrics,
work page 1984
-
[18]
Gait analysis and the bootstrap
[Olshen et al., 1989] Richard A Olshen, Edmund N Biden, Marilynn P Wyatt, and David H Sutherland. Gait analysis and the bootstrap. The annals of statistics,
work page 1989
-
[19]
[Ranganath et al., 2016] Rajesh Ranganath, Adler Perotte, No´emie Elhadad, and David Blei. Deep survival analysis. arXiv:1608.02158,
work page internal anchor Pith review Pith/arXiv arXiv 2016
-
[20]
Probabilistic programming in python using pymc3
[Salvatier et al., 2016] John Salvatier, Thomas V Wiecki, and Christopher Fonnesbeck. Probabilistic programming in python using pymc3. PeerJ Computer Science,
work page 2016
-
[21]
Learning patient-specific cancer survival distributions as a sequence of dependent regres- sors
[Yu et al., 2011] Chun-Nam Yu, Russell Greiner, Hsiu-Chin Lin, and Vickie Baracos. Learning patient-specific cancer survival distributions as a sequence of dependent regres- sors. In Advances in Neural Information Processing Sys- tems, 2011
work page 2011
discussion (0)
Sign in with ORCID, Apple, or X to comment. Anyone can read and Pith papers without signing in.