A multiscale Laplacian of Gaussian (LoG) filtering approach to pulmonary nodule detection from whole-lung CT scans
Pith reviewed 2026-05-24 19:22 UTC · model grok-4.3
The pith
A multiscale Laplacian of Gaussian filter detects 99.8 percent of solid pulmonary nodules in whole-lung CT scans.
A machine-rendered reading of the paper's core claim, the machinery that carries it, and where it could break.
Core claim
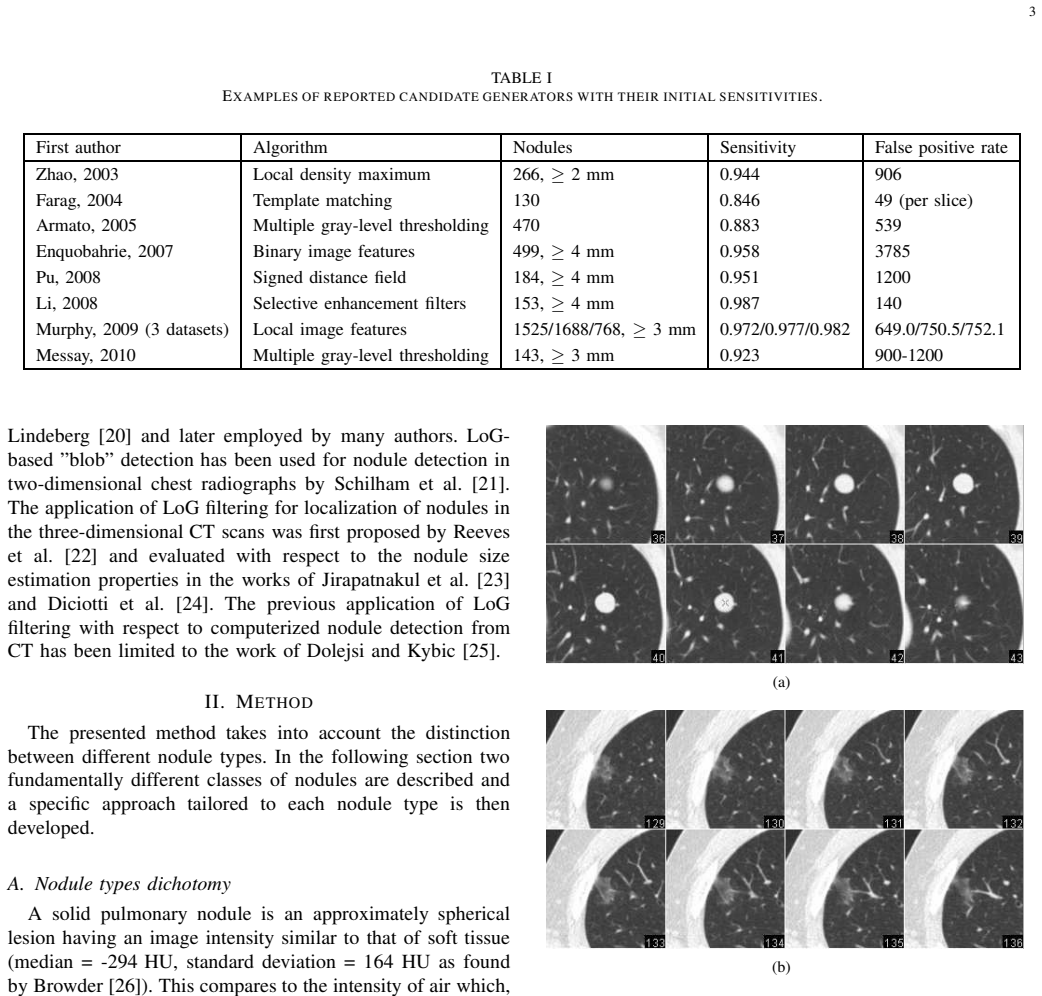
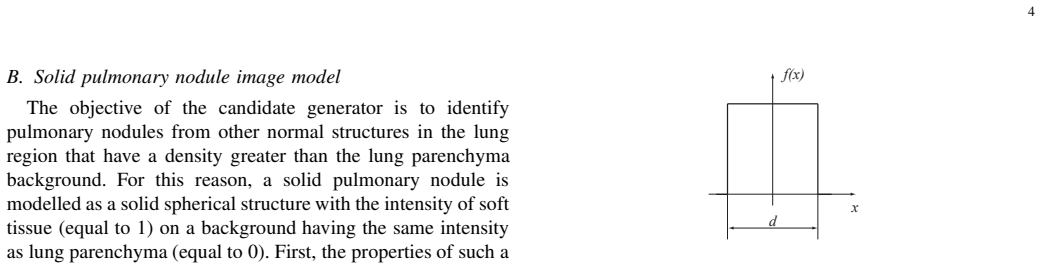
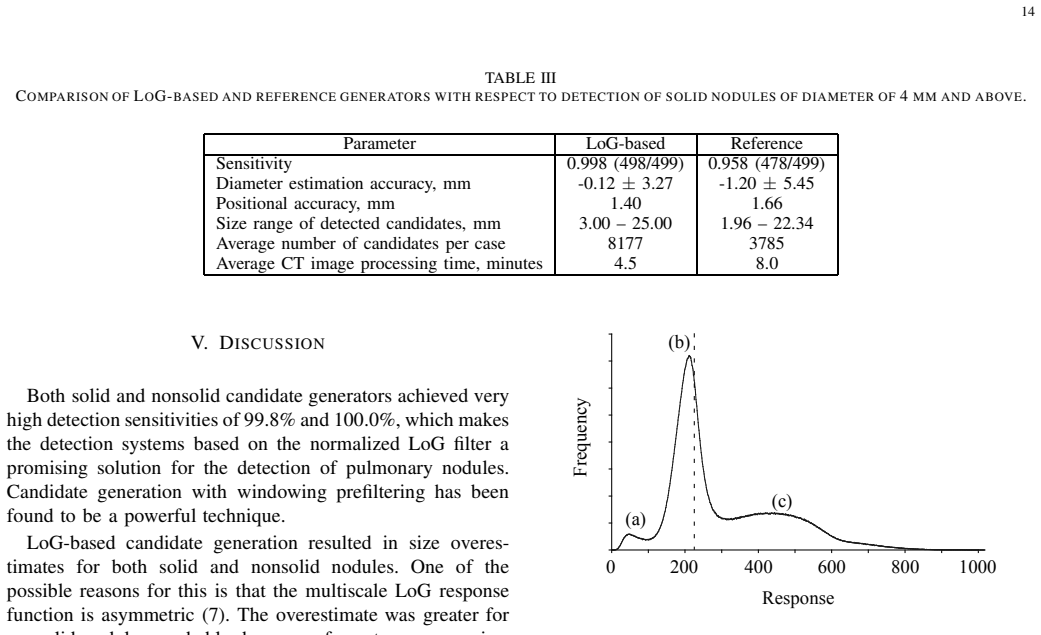
The multiscale scale-normalized Laplacian of Gaussian filtering method creates a list of nodule candidate locations and sizes by detecting blob-like structures across scales. When applied to a size-enriched database of 706 whole-lung low-dose CT scans that contained 499 solid nodules of 4 mm or larger and 107 nonsolid nodules of 6 mm or larger, the method achieved sensitivities of 0.998 and 1.000. It also produced average size estimation errors of 0.12 mm for solid nodules and 1.27 mm for nonsolid nodules, together with average centroid localization distances of 1.41 mm and 1.43 mm compared with radiologist annotations.
What carries the argument
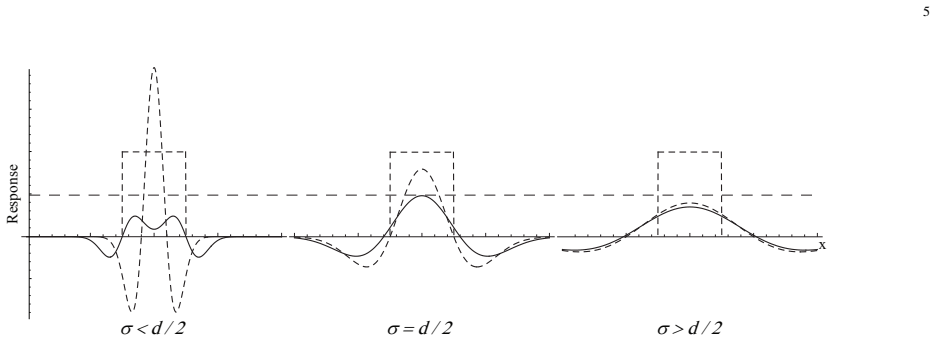
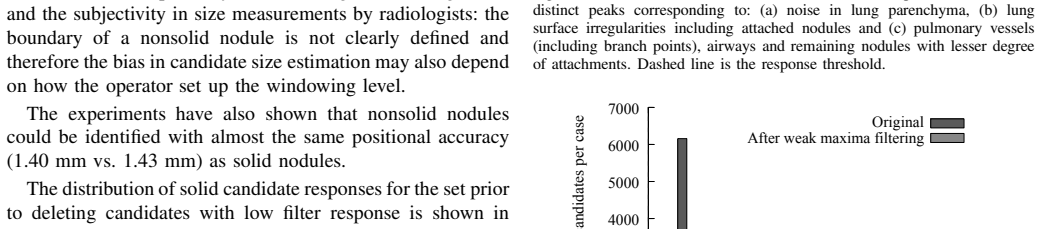
Multiscale scale-normalized Laplacian of Gaussian (LoG) filtering, which applies normalized second-derivative filters at multiple scales to locate and size blob-like intensity patterns that correspond to nodules.
If this is right
- The LoG method supplies the initial candidate list and size estimates needed by later stages of a CAD pipeline.
- The same filter set works for both solid and nonsolid nodule types at the reported size thresholds.
- Size and centroid outputs are close enough to radiologist values to serve as starting points for further analysis.
- High sensitivity at the candidate stage reduces the risk that a nodule is omitted from the final CAD output.
Where Pith is reading between the lines
- If the reported sensitivities hold on unenriched consecutive screening cases, the method could be inserted directly into existing CAD workflows without retraining.
- The scale-normalized LoG approach may transfer to detection of other approximately spherical lesions in volumetric CT or MR data.
- Accurate automatic centroid placement could support longitudinal tracking of nodule growth across multiple scans.
Load-bearing premise
The size-enriched validation database represents the range of nodule sizes and appearances that appear in routine low-dose CT screening populations.
What would settle it
Running the same multiscale LoG method on a large consecutive series of unenriched screening CT scans and measuring whether sensitivity for solid nodules of 4 mm or larger falls below 0.99.
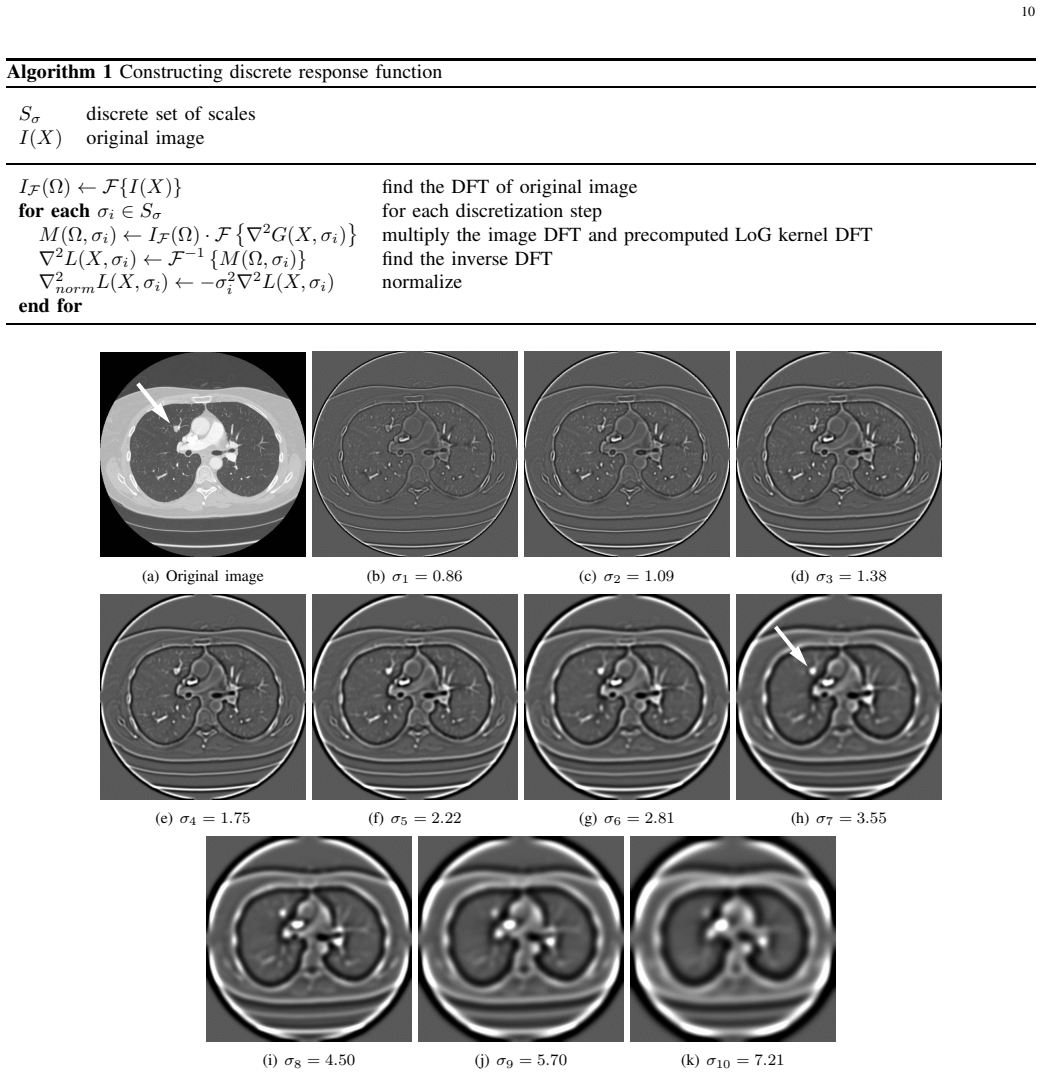
Figures


read the original abstract
Candidate generation, the first stage for most computer aided detection (CAD) systems, rapidly scans the entire image data for any possible abnormality locations, while the subsequent stages of the CAD system refine the candidates list to determine the most probable or significant of these candidates. The candidate generator creates a list of the locations and provides a size estimate for each candidate. A multiscale scale-normalized Laplacian of Gaussian (LoG) filtering method for detecting pulmonary nodules in whole-lung CT scans, presented in this paper, achieves a high sensitivity for both solid and nonsolid pulmonary nodules. The pulmonary nodule LoG filtering method was validated on a size-enriched database of 706 whole-lung low-dose CT scans containing 499 solid (>= 4 mm) and 107 nonsolid (>= 6 mm) pulmonary nodules. The method achieved a sensitivity of 0.998 (498/499) for solid nodules and a sensitivity of 1.000 (107/107) for nonsolid nodules. Furthermore, compared to radiologist measurements, the method provided low average nodule size estimation error of 0.12 mm for solid and 1.27 mm for nonsolid nodules. The average distance between automatically and manually determined nodule centroids were 1.41 mm and 1.43 mm, respectively.
Editorial analysis
A structured set of objections, weighed in public.
Referee Report
Summary. The manuscript presents a multiscale scale-normalized Laplacian of Gaussian (LoG) filtering method for candidate generation in pulmonary nodule detection from whole-lung low-dose CT scans. Validation is reported on a size-enriched database of 706 scans containing 499 solid (>=4 mm) and 107 nonsolid (>=6 mm) nodules, achieving sensitivities of 0.998 (498/499) and 1.000 (107/107), respectively, with average size estimation errors of 0.12 mm (solid) and 1.27 mm (nonsolid) and centroid localization errors of 1.41 mm and 1.43 mm.
Significance. If the performance generalizes, the method supplies a straightforward scale-space technique for high-sensitivity candidate generation that handles both solid and nonsolid nodules and supplies usable size and position estimates. The sizable nodule count in the validation set is a strength for a candidate-generation paper.
major comments (2)
- [Abstract] Abstract: The validation set is labeled 'size-enriched' with no description of the enrichment procedure, no nodule size or attenuation histograms, and no comparison to an unenriched screening cohort. This detail is load-bearing for the central sensitivity claims (0.998/1.000), because enrichment may preferentially retain nodules whose scale and contrast align with the chosen LoG kernels, limiting claims of general performance on routine screening populations.
- [Abstract] Abstract: No false-positive rate, candidates per scan, or operating-point trade-off is supplied. For a candidate-generation stage the sensitivity-specificity balance is essential to judge downstream CAD utility; its absence prevents assessment of whether the reported sensitivities are achieved at a usable false-positive burden.
minor comments (1)
- [Abstract] Abstract: The larger size-estimation error for nonsolid nodules (1.27 mm) versus solid (0.12 mm) is reported without comment; a short explanation of the difference would aid interpretation.
Simulated Author's Rebuttal
We thank the referee for the thorough review and valuable comments on our manuscript. We address each of the major comments in detail below.
read point-by-point responses
-
Referee: [Abstract] Abstract: The validation set is labeled 'size-enriched' with no description of the enrichment procedure, no nodule size or attenuation histograms, and no comparison to an unenriched screening cohort. This detail is load-bearing for the central sensitivity claims (0.998/1.000), because enrichment may preferentially retain nodules whose scale and contrast align with the chosen LoG kernels, limiting claims of general performance on routine screening populations.
Authors: The term 'size-enriched' indicates that the database was constructed to include nodules spanning a range of sizes to allow evaluation across different scales. We agree that more details would be beneficial. In the revised manuscript, we will expand the description of the database construction to include the enrichment procedure and provide histograms of nodule sizes and attenuations. A comparison to an unenriched screening cohort is not available from the current dataset. revision: partial
-
Referee: [Abstract] Abstract: No false-positive rate, candidates per scan, or operating-point trade-off is supplied. For a candidate-generation stage the sensitivity-specificity balance is essential to judge downstream CAD utility; its absence prevents assessment of whether the reported sensitivities are achieved at a usable false-positive burden.
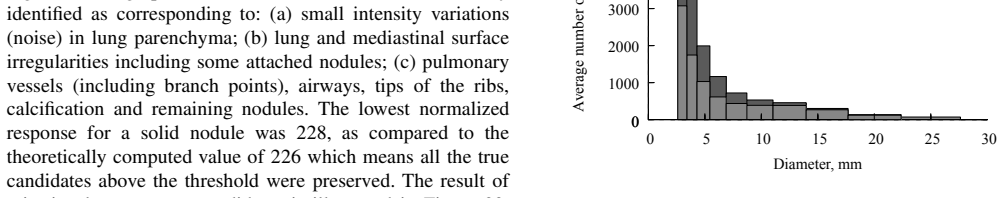
Authors: We acknowledge the importance of reporting the false-positive characteristics for a candidate generation method. The manuscript prioritizes demonstrating the high sensitivity and accurate size/centroid estimation. We will revise the manuscript to include the average number of candidates per scan and discuss the implications for downstream processing. revision: yes
- Comparison of the method's performance on an unenriched routine screening population is not possible with the available data.
Circularity Check
No significant circularity; validation metrics are direct counts against external annotations
full rationale
The paper describes a standard multiscale LoG filter for candidate generation and reports sensitivity as the direct ratio of detected nodules to the total number of manually annotated nodules in the 706-scan database. No equations, parameters, or predictions are shown to be fitted from the evaluation set and then re-used to compute the same sensitivities. The size-enrichment issue raised by the skeptic affects external validity but does not create a self-referential derivation inside the paper. No self-citation chains or ansatzes are invoked to justify the core detection step.
Axiom & Free-Parameter Ledger
axioms (1)
- domain assumption Pulmonary nodules appear as approximately Gaussian blobs in CT intensity volumes at clinically relevant scales.
Reference graph
Works this paper leans on
-
[1]
D. Wormanns, K. Ludwig, F. Beyer, W. Heindel, and S. Diede rich, “Detection of pulmonary nodules at multirow-detector CT: e ffectiveness of double reading to improve sensitivity at standard-dose a nd low-dose chest CT,” European radiology, vol. 15, no. 1, pp. 14–22, 2005
work page 2005
-
[2]
Pulmonary nodule det ection with low-dose CT of the lung: agreement among radiologists,
J. K. Leader, T. E. Warfel, C. R. Fuhrman, S. K. Golla, J. L. Weissfeld, R. S. Avila, W. D. Turner, and B. Zheng, “Pulmonary nodule det ection with low-dose CT of the lung: agreement among radiologists, ” American Journal of Roentgenology , vol. 185, no. 4, p. 973, 2005
work page 2005
-
[3]
K. Marten, C. Engelke, T. Seyfarth, A. Grillhosl, S. Oben auer, and E. J. Rummeny, “Computer-aided detection of pulmonary nodules: influence of nodule characteristics on detection performance,” Clinical Radiology, vol. 60, no. 2, pp. 196–206, 2005
work page 2005
-
[4]
Sm all pulmonary nodules: effect of two computer-aided detection systems on radiologist performance,
M. Das, G. Muhlenbruch, A. H. Mahnken, T. G. Flohr, L. Gund el, S. Stanzel, T. Kraus, R. W. Gunther, and J. E. Wildberger, “Sm all pulmonary nodules: effect of two computer-aided detection systems on radiologist performance,” Radiology, vol. 241, no. 2, p. 564, 2006
work page 2006
-
[5]
F. Beyer, L. Zierott, E. M. Fallenberg, K. U. Juergens, J. Stoeckel, W. Heindel, and D. Wormanns, “Comparison of sensitivity and reading time for the use of computer-aided detection (CAD) of pulmon ary nodules at MDCT as concurrent or second reader,” European Radiology, vol. 17, no. 11, pp. 2941–2947, 2007
work page 2007
-
[6]
Computer analysis of computed tomography scans of the lung: a survey,
I. Sluimer, A. Schilham, M. Prokop, and B. van Ginneken, “ Computer analysis of computed tomography scans of the lung: a survey, ” IEEE Transactions on Medical Imaging , vol. 25, no. 4, pp. 385–405, April 2006
work page 2006
-
[7]
Recent progress in computer-aided diagnosis of l ung nodules on thin-section CT,
Q. Li, “Recent progress in computer-aided diagnosis of l ung nodules on thin-section CT,” Computerized Medical Imaging and Graphics , vol. 31, no. 4-5, pp. 248–257, 2007. 16
work page 2007
-
[8]
Comput er-Aided Diagnosis of Lung Cancer and Pulmonary Embolism in Computed Tomography – A Review,
H. P . Chan, L. Hadjiiski, C. Zhou, and B. Sahiner, “Comput er-Aided Diagnosis of Lung Cancer and Pulmonary Embolism in Computed Tomography – A Review,” Academic Radiology, vol. 15, no. 5, pp. 535– 555, 2008
work page 2008
-
[9]
Automatic detection of small lung nodules on CT utilizing a local density maximum algorithm,
B. Zhao, “Automatic detection of small lung nodules on CT utilizing a local density maximum algorithm,” Journal of applied clinical medical physics, vol. 4, no. 3, p. 248, 2003
work page 2003
-
[10]
A. A. Farag, A. El-Baz, G. G. Gimel farb, R. Falk, and S. G. Hushek, “Automatic detection and recognition of lung abnormalitie s in helical CT images using deformable templates,” Lecture Notes in Computer Science, pp. 856–864, 2004
work page 2004
-
[11]
S. G. Armato, A. S. Roy, H. Macmahon, F. Li, K. Doi, S. Sone , and M. B. Altman, “Evaluation of automated lung nodule detec tion on low-dose computed tomography scans from a lung cancer scr eening program,” Academic Radiology, vol. 12, no. 3, pp. 337–46, March 2005
work page 2005
-
[12]
A. Enquobahrie, A. P . Reeves, D. F. Y ankelevitz, and C. I . Henschke, “Automated Detection of Small Solid Pulmonary Nodules in Wh ole Lung CT Scans from a Lung Cancer Screening Study,” Academic Radiology, vol. 14, no. 5, pp. 579–593, 2007
work page 2007
-
[13]
J. Pu, B. Zheng, J. K. Leader, X. H. Wang, and D. Gur, “An au tomated CT based lung nodule detection scheme using geometric analy sis of signed distance field,” Medical Physics , vol. 35, p. 3453, 2008
work page 2008
-
[14]
Q. Li, F. Li, and K. Doi, “Computerized Detection of Lung Nodules in Thin-Section CT Images by Use of Selective Enhancement Fi lters and an Automated Rule-Based Classifier,” Academic radiology, vol. 15, no. 2, pp. 165–175, 2008
work page 2008
-
[15]
K. Murphy, B. van Ginneken, A. M. Schilham, B. J. de Hoop, H. A. Gi- etema, and M. Prokop, “A large-scale evaluation of automati c pulmonary nodule detection in chest CT using local image features and k -nearest- neighbour classification,” Medical image analysis , vol. 13, no. 5, p. 757, 2009
work page 2009
-
[16]
A new computationa lly efficient cad system for pulmonary nodule detection in ct imagery,
T. Messay, R. Hardie, and S. Rogers, “A new computationa lly efficient cad system for pulmonary nodule detection in ct imagery,” Medical image analysis , vol. 14, no. 3, pp. 390–406, 2010
work page 2010
-
[17]
D. Marr and E. Hildreth, “Theory of edge detection,” Proceedings of the Royal Society of London. Series B, Biological Sciences , pp. 187–217, 1980
work page 1980
-
[18]
Identification and boundar y extraction of blobs in complex imagery,
T. Jiang and M. B. Merickel, “Identification and boundar y extraction of blobs in complex imagery,” Computerized Medical Imaging and Graphics, vol. 13, no. 5, pp. 369–382, 1989
work page 1989
-
[19]
Shape from texture: Integrat ing texture- element extraction and surface estimation,
D. Blostein and N. Ahuja, “Shape from texture: Integrat ing texture- element extraction and surface estimation,” Pattern Analysis and Ma- chine Intelligence, IEEE Transactions on , vol. 11, no. 12, pp. 1233– 1251, 1989
work page 1989
-
[20]
T. Lindeberg, “Detecting salient blob-like image stru ctures and their scales with a scale-space primal sketch: A method for focus- of- attention,” International Journal of Computer Vision , vol. 11, no. 4, pp. 283–318, 1993
work page 1993
-
[21]
Multi-s cale Nodule Detection in Chest Radiographs,
A. M. R. Schilham, B. van Ginneken, and M. Loog, “Multi-s cale Nodule Detection in Chest Radiographs,” LECTURE NOTES IN COMPUTER SCIENCE, pp. 602–609, 2003
work page 2003
-
[22]
On measuring the change in size of pulmonar y nodules,
A. P . Reeves, A. B. Chan, D. F. Y ankelevitz, C. I. Henschk e, B. Kressler, and W. J. Kostis, “On measuring the change in size of pulmonar y nodules,” Medical Imaging, IEEE Transactions on , vol. 25, no. 4, pp. 435–450, 2006
work page 2006
-
[23]
A. C. Jirapatnakul, S. V . Fotin, A. P . Reeves, A. M. Bianc ardi, D. F. Y ankelevitz, and C. I. Henschke, “Automated nodule locatio n and size estimation using a multi-scale laplacian of gaussian filter ing approach,” in 31st Annual International Conference of the IEEE Engineeri ng in Medicine and Biology Society , Sept. 2009, pp. 1028–1031
work page 2009
-
[24]
The LoG Characteristic Scale: A Consistent M easure- ment of Lung Nodule Size in CT Imaging
S. Diciotti, S. Lombardo, G. Coppini, L. Grassi, M. Falc hini, and M. Mascalchi, “The LoG Characteristic Scale: A Consistent M easure- ment of Lung Nodule Size in CT Imaging.” IEEE transactions on medical imaging , vol. 29, no. 2, p. 397, 2010
work page 2010
-
[25]
Automatic Two-Step Detection of Pulmonary Nodules,
M. Dolejsi and J. Kybic, “Automatic Two-Step Detection of Pulmonary Nodules,” in Proceedings of SPIE , vol. 6514, 2007, p. 65143J
work page 2007
-
[26]
The segmentation of nonsolid pulmonary no dules in CT images,
W. Browder, “The segmentation of nonsolid pulmonary no dules in CT images,” Master’s thesis, Cornell University, 2007
work page 2007
-
[27]
J. H. M. Austin, N. L. Muller, P . J. Friedman, D. M. Hansel l, D. P . Naidich, M. Remy-Jardin, W. R. Webb, and E. A. Zerhouni, “Glo ssary of terms for CT of the lungs: recommendations of the Nomencla ture Committee of the Fleischner Society,” Radiology, vol. 200, no. 2, pp. 327–332, 1996
work page 1996
-
[28]
Early Lung Cancer Action Project: overall design and findings from baseline screening,
C. I. Henschke, D. I. McCauley, D. F. Y ankelevitz, D. P . N aidich, G. McGuinness, O. S. Miettinen, D. M. Libby, M. W. Pasmantier , J. Koizumi, N. K. Altorki et al. , “Early Lung Cancer Action Project: overall design and findings from baseline screening,” The Lancet , vol. 354, no. 9173, pp. 99–105, 1999
work page 1999
-
[29]
Nodule management protocol of the NELSON randomised lung c ancer screening trial,
D. M. Xu, H. Gietema, H. de Koning, R. V ernhout, K. Nackae rts, M. Prokop, C. Weenink, J. W. Lammers, H. Groen, M. Oudkerk et al. , “Nodule management protocol of the NELSON randomised lung c ancer screening trial,” Lung Cancer , vol. 54, no. 2, pp. 177–184, 2006
work page 2006
-
[30]
A. Lopes Pegna, G. Picozzi, M. Mascalchi, F. Maria Caroz zi, L. Car- rozzi, C. Comin, C. Spinelli, F. Falaschi, M. Grazzini, F. In nocenti et al., “Design, recruitment and baseline results of the ITALUNG tr ial for lung cancer screening with low-dose CT,” Lung Cancer , vol. 64, no. 1, pp. 34–40, 2009
work page 2009
-
[31]
Early processing of visual information,
D. Marr, “Early processing of visual information,” Philosophical Trans- actions of the Royal Society of London. Series B, Biological Sciences, vol. 275, no. 942, pp. 483–519, 1976
work page 1976
-
[32]
Feature detection with automatic scale selection,
T. Lindeberg, “Feature detection with automatic scale selection,” Inter- national Journal of Computer Vision , vol. 30, no. 2, pp. 79–116, 1998
work page 1998
-
[33]
W. A. Browder, A. P . Reeves, T. V . Apananosovich, M. D. Ch am, D. F. Y ankelevitz, and C. I. Henschke, “Automated volumetric seg mentation method for growth consistency of nonsolid pulmonary nodule s in high- resolution CT,” in Proc. of SPIE V ol , vol. 6514, 2007, pp. 65 140Y –1
work page 2007
-
[34]
The design and implementati on of FFTW3,
M. Frigo and S. G. Johnson, “The design and implementati on of FFTW3,” Proceedings of the IEEE , vol. 93, no. 2, pp. 216–231, 2005
work page 2005
-
[35]
Recursive implementation of LoG fil tering,
J. S. Jin and Y . Gao, “Recursive implementation of LoG fil tering,” Real- Time Imaging, vol. 3, no. 1, pp. 59–65, 1997
work page 1997
discussion (0)
Sign in with ORCID, Apple, or X to comment. Anyone can read and Pith papers without signing in.