Testing for Coefficient Randomness in Local-to-Unity Autoregressions
Pith reviewed 2026-05-24 10:30 UTC · model grok-4.3
The pith
A new test for random coefficients in local-to-unity autoregressions keeps its power even when the coefficient correlates with the error term.
A machine-rendered reading of the paper's core claim, the machinery that carries it, and where it could break.
Core claim
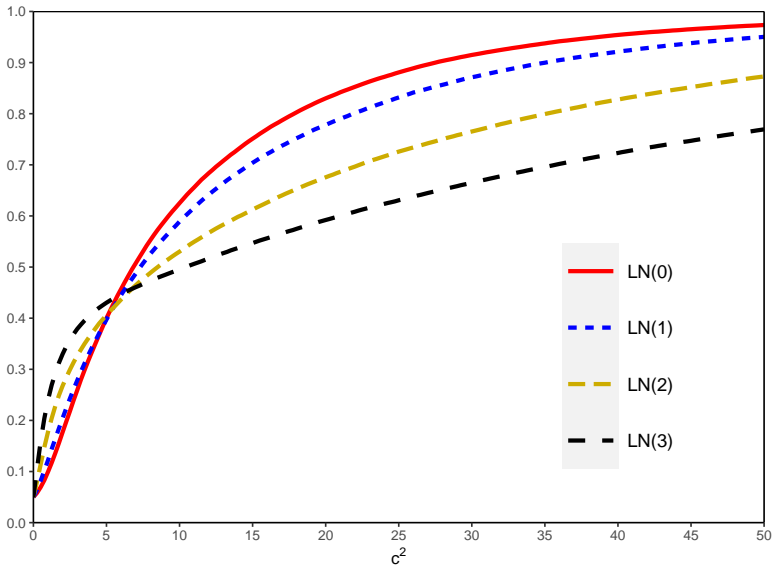
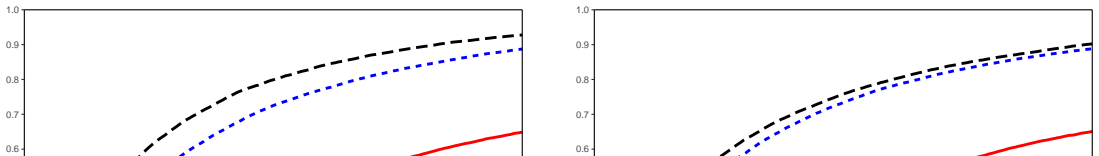
Under a local-to-unity specification for the autoregressive coefficient, the correlation between the random coefficient and the disturbance affects the power of tests for coefficient randomness, so that tests from earlier studies perform poorly when the correlation is moderate to large; the test proposed here is constructed to have a power function robust to this correlation, and a modified version of the test statistic is shown to have an asymptotic null distribution free from the nuisance parameter ψ with better power properties than existing tests in large and finite samples.
What carries the argument
The test statistic for coefficient randomness, modified so its asymptotic null distribution does not depend on the nuisance parameter ψ measuring correlation between the disturbance and its square.
If this is right
- Existing tests lose power as the correlation between the random coefficient and the disturbance grows from small to moderate or large values.
- The proposed test maintains its detection rate for coefficient randomness across all levels of that correlation.
- The modified test statistic has a null distribution that does not require knowledge of or estimation for the nuisance parameter ψ.
- Both asymptotic theory and finite-sample simulations show higher power for the modified test relative to earlier procedures.
Where Pith is reading between the lines
- The same correlation-robust construction could be applied to tests for time variation in other highly persistent economic series.
- Applied work that searches for parameter instability in macro data might adopt the modified statistic to reduce the chance of missing randomness due to overlooked error correlations.
- The dependence on ψ in many unit-root-related tests points to a general need for nuisance-free versions when the error distribution is unknown.
Load-bearing premise
The autoregressive coefficient is specified to be local to unity and may vary randomly with possible correlation to the disturbance term.
What would settle it
Monte Carlo experiments or empirical series in which the modified test rejects the null of fixed coefficients more often than prior tests when moderate correlation is present, while keeping the correct rejection rate under the null.
Figures


read the original abstract
In this study, we propose a test for the coefficient randomness in autoregressive models where the autoregressive coefficient is local to unity, which is empirically relevant given the results of earlier studies. Under this specification, we theoretically analyze the effect of the correlation between the random coefficient and disturbance on tests' properties, which remains largely unexplored in the literature. Our analysis reveals that the correlation crucially affects the power of tests for coefficient randomness and that tests proposed by earlier studies can perform poorly when the degree of the correlation is moderate to large. The test we propose in this paper is designed to have a power function robust to the correlation. Because the asymptotic null distribution of our test statistic depends on the correlation $\psi$ between the disturbance and its square as earlier tests do, we also propose a modified version of the test statistic such that its asymptotic null distribution is free from the nuisance parameter $\psi$. The modified test is shown to have better power properties than existing ones in large and finite samples.
Editorial analysis
A structured set of objections, weighed in public.
Referee Report
Summary. The paper proposes a test for coefficient randomness in local-to-unity autoregressive models that accounts for correlation between the random coefficient and the innovation. It derives the resulting power distortion for existing tests, constructs a correlation-robust statistic whose null distribution depends on the nuisance ψ (disturbance-squared correlation), and introduces a further modification that eliminates dependence on ψ. Asymptotics and simulations are used to show that the modified test has superior power properties relative to prior procedures when the correlation is moderate to large.
Significance. If the derivations and simulation evidence hold, the work is significant for filling a gap in the local-to-unity literature by explicitly treating the correlation nuisance that earlier studies left unexplored. The explicit construction of both a robust statistic and a nuisance-free refinement, together with the reported finite-sample improvements, supplies a practical advance for inference in settings where local-to-unity behavior is empirically relevant.
major comments (2)
- [§3.2] §3.2, the statement that the modified statistic is asymptotically free of ψ: the construction appears to rely on an auxiliary moment condition whose validity under the local-to-unity null should be verified explicitly, as any failure would reintroduce dependence on the nuisance parameter in the limiting distribution.
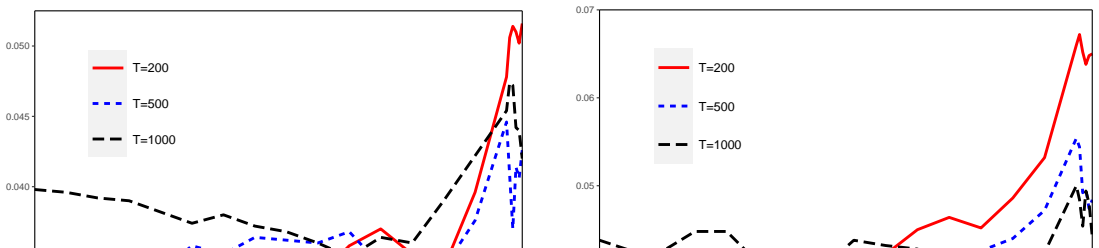
- [Table 4] Table 4, power comparisons at ψ = 0.5: the reported size-adjusted power gains for the modified test are modest (roughly 8–12 percentage points) and appear sensitive to the choice of bandwidth; a more systematic sensitivity check across bandwidth selectors would strengthen the finite-sample claim.
minor comments (2)
- [§2] The notation for the localizing coefficient sequence (c and the random component) is introduced in §2 but used without re-statement in the power-function derivations of §3; a brief reminder would improve readability.
- [Figure 2] Figure 2 caption refers to “size-adjusted power” but the plotted curves are not labeled as such in the legend; consistency between caption and figure would avoid confusion.
Simulated Author's Rebuttal
We thank the referee for the constructive comments and positive overall assessment. We address each major comment below and will incorporate the suggested changes in the revision.
read point-by-point responses
-
Referee: [§3.2] §3.2, the statement that the modified statistic is asymptotically free of ψ: the construction appears to rely on an auxiliary moment condition whose validity under the local-to-unity null should be verified explicitly, as any failure would reintroduce dependence on the nuisance parameter in the limiting distribution.
Authors: We agree that an explicit verification of the auxiliary moment condition under the local-to-unity null would strengthen the argument that the limiting distribution is free of ψ. We will add this verification, with the relevant derivations, to §3.2 and an appendix in the revised manuscript. revision: yes
-
Referee: [Table 4] Table 4, power comparisons at ψ = 0.5: the reported size-adjusted power gains for the modified test are modest (roughly 8–12 percentage points) and appear sensitive to the choice of bandwidth; a more systematic sensitivity check across bandwidth selectors would strengthen the finite-sample claim.
Authors: We acknowledge that the reported power gains at ψ = 0.5 are modest and that the finite-sample results may depend on bandwidth choice. In the revision we will add a systematic sensitivity analysis across alternative bandwidth selectors (including data-driven ones) and report the results alongside the existing Table 4. revision: yes
Circularity Check
No significant circularity detected
full rationale
The paper performs a standard local-to-unity asymptotic analysis that incorporates correlation between the random coefficient and the innovation term, derives the resulting power distortion for prior tests, and constructs a correlation-robust statistic whose null distribution is then freed from the nuisance parameter ψ via an additional modification. These steps are internally derived from the maintained specification and do not reduce to self-definition, fitted inputs renamed as predictions, or load-bearing self-citations. The claims rest on explicit limiting distributions and Monte Carlo evidence rather than circular reductions.
Axiom & Free-Parameter Ledger
free parameters (1)
- ψ
axioms (1)
- domain assumption The autoregressive coefficient is local to unity and may be random and correlated with the innovation process.
Reference graph
Works this paper leans on
-
[1]
Aue, A. and L. Horv´ ath (2011) Quasi-Likelihood Estimationin Stationary and Nonstationary Autoregressive Models with Random Coefficients. Statistica Sinica, 21 (3), 973–999. Campbell, J. Y. and M. Yogo (2006) Efficient Tests of Stock Retu rn Predictability. Journal 18 of Financial Economics , 81 (1), 27–60. Cavanagh, C. L., G. Elliott, and J. H. Stock (1995)...
work page 2011
-
[2]
McCabe, B. P. M. and R. J. Smith (1998) The Power of Some Tests f or Difference Stationarity under Local Heteroscedastic Integration. Journal of the American Statistical Association , 93 (442), 751–761. 19 McCabe, B. P. M. and A. R. Tremayne (1995) Testing a Time Serie s for Difference Station- arity. The Annals of Statistics , 23 (3), 1015–1028. Nagakura, ...
work page 1998
-
[3]
Journal of Statistical Planning and Inference , 139 (8), 2731–2745
Model When the Null Is an Integrated or a Stationary Process. Journal of Statistical Planning and Inference , 139 (8), 2731–2745. Nagakura, D. (2009b) Asymptotic Theory for Explosive Rando m Coefficient Autoregressive Models and Inconsistency of a Unit Root Test against a Stocha stic Unit Root Process. Statistics & Probability Letters , 79 (24), 2476–2483. ...
work page 1982
-
[4]
The procedure is based on simulating asymptotic distributions with 5,000 replications. In each replicatio n, we first generate {yt}T t=1 by the mechanism yt = (1 + a/T )yt− 1 + εt, t = 1, 2, . . . , T (A.1) with y0 = 0, T = 2000, a ∈ [− 300, 10] and εt ∼ i.i.d N (0, 1). Then, with given α1, we conduct the two-step procedure for the Bonferroni-Wald test exp...
work page 2000
-
[5]
Then, YT ⇒ σεJa in the Skorokhod space D[0, 1], where Ja solves dJa(r) = aJa(r)dr + dWε(r). Proof. The proof is essentially the same as that of Lemma 1(a) of Nish i and Kurozumi (2022) and hence is omitted. Lemma B.2. Consider model (2) under Assumptions 1 and
work page 2022
-
[6]
Then, we have (a) ˆσ2 ε,T (ρT ) p → σ2 ε , (b) ˆσ2 η,T (ρT ) p → σ2 η, (c) ˆψT (ρT ) p → ψ. Proof. The proofs of parts (a) and (b) are identical to those of Lemma 1(b) and (c) of Nishi and Kurozumi (2022) and hence are omitted. To prove par t (c), it suffices to show T − 1 T∑ t=1 zt(ρT ) { z2 t (ρT ) − ˆσ2 ε,T (ρT ) } p → E[ε3 t ]. A simple calculation give...
work page 2022
-
[7]
Then, we have (a) T − 3/2 T∑ t=1 ˜y2 t− 1z2 t (ρT ) ⇒ σησ2 ε ∫ 1 0 ˜Ja,2(r)dWη(r) + c2σ4 ε ∫ 1 0 (˜Ja,2)2(r)dr + 2cσ4 ε q ∫ 1 0 ˜Ja,1(r)˜Ja,2(r)dr, (b) T − 1 T∑ t=1 ˜yt− 1z2 t (ρT ) ⇒ σησε ∫ 1 0 ˜Ja,1(r)dWη(r) + c2σ3 ε ∫ 1 0 ˜Ja,1(r)˜Ja,2(r)dr + 2cσ3 ε q ∫ 1 0 (˜Ja,1)2(r)dr. (c) ˆσ2 ˜ξ∗ (ρT ) p → σ2 η, (d) ˆσ2 ˜ξ∗∗ (ρT ) p → σ2 η, where ˆσ2 ˜ξ∗ (ρT ) and ...
work page 1992
-
[8]
0.05 (0.5, 0.55] 0.44 a. Entries in the second and fourth columns are the significance level of the equal-tailed confidence in- terval for ρT when the significance levels of the Bonferroni-Wald test ( ˜α) and individual modified Wald test ( α2) are 0.05. b. To determine the α1 value for the interval (0.95, 1), we actually computed type 1 errors over (0.95, 0....
work page 1982
discussion (0)
Sign in with ORCID, Apple, or X to comment. Anyone can read and Pith papers without signing in.