REVIEW 4 major objections 5 minor 3 cited by
OpenEarthMap-SAR: A Benchmark Synthetic Aperture Radar Dataset for Global High-Resolution Land Cover Mapping
T0 review · 4 major / 5 minor · reviewed 2026-08-10 · deepseek-v4-flash
Pith's one-line read The paper introduces OpenEarthMap-SAR, a public benchmark of 5,033 sub-meter SAR images with 8-class land-cover labels, designed to advance all-weather land cover mapping.
desk verdict A useful public SAR land cover benchmark, but its label validation is optical-centric and the accounting has inconsistencies that need fixing before the benchmark claim is fully credible. read the letter →
The pith
A machine-rendered reading of the paper's core claim, the machinery that carries it, and where it could break.
The reading
What carries the argument
The load-bearing object is the dataset itself: OpenEarthMap-SAR, a collection of paired sub-meter SAR and optical images with 8-class segmentation labels and a predefined train/test split. Its design choices carry the argument: pseudo labels from pre-trained optical models give large-scale supervision without manual cost, manual labels provide a quality anchor, and the fixed evaluation protocol makes results from different methods comparable. The benchmark is what enables all-weather land-cover mapping research.
What would settle it
A fresh round of manual annotation of the same 700 tiles by a different set of experts, with per-pixel agreement computed against the existing manual labels, would settle whether the 'real' labels are a stable gold standard; if inter-annotator agreement is no higher than the 68.2% pseudo-label agreement, the benchmark's manual labels are too noisy to support reliable evaluation.
Extended reading notes
Core claim
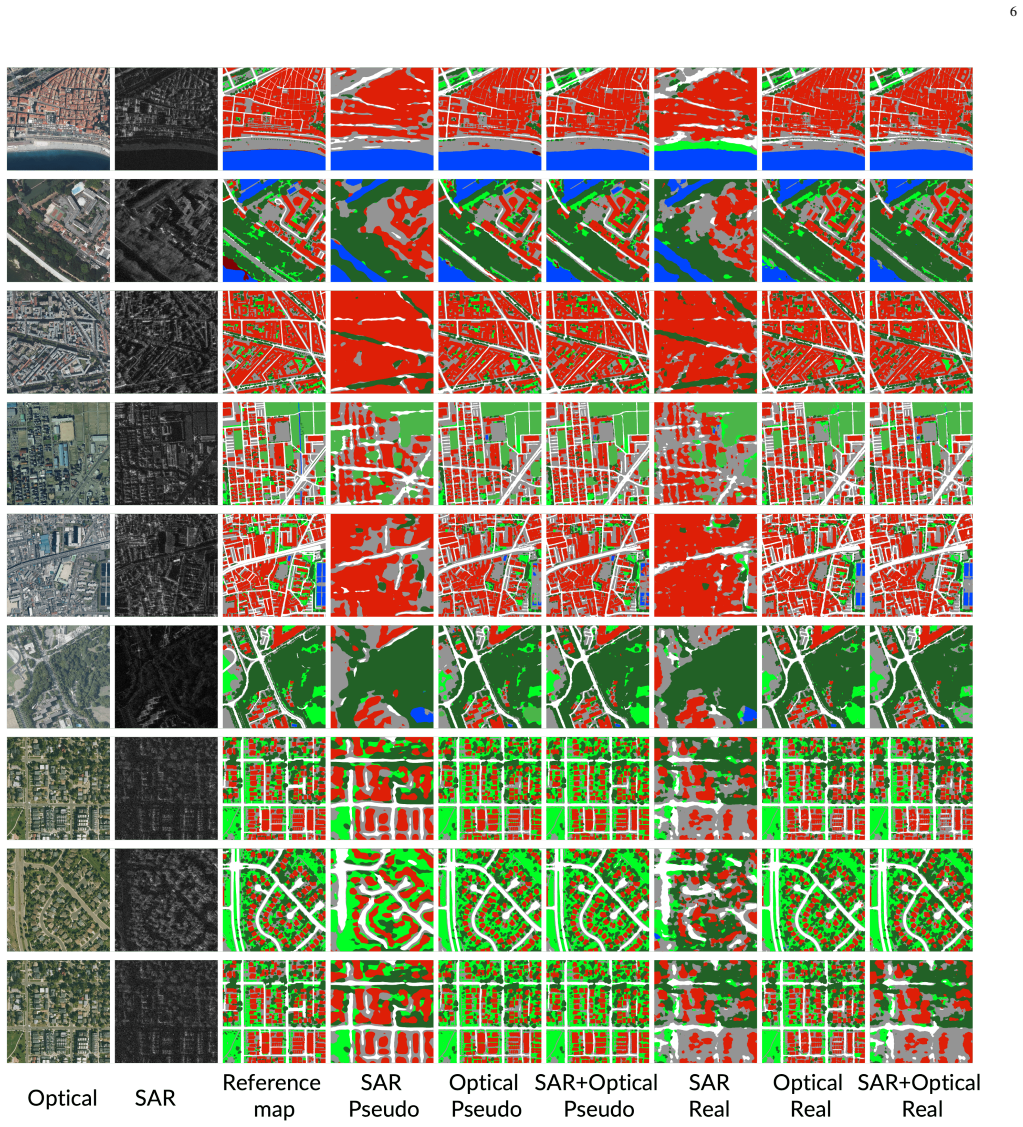
The central claim is that OpenEarthMap-SAR constitutes a large-scale, geographically diverse benchmark for high-resolution SAR land-cover segmentation, with a resolution and class count that surpass previous SAR segmentation datasets. The authors support this by assembling 5,033 SAR images from Umbra's open-data catalog, pairing each with geocoded optical imagery from NAIP, IGN, and GSI, and aligning the pairs by hand. Labels use the eight OpenEarthMap classes (bareland, rangeland, developed space, road, tree, water, agricultural land, building), generated for all images from pre-trained optical models and corrected by manual annotation of 20 images per region. Baseline evaluations of U-Net, SegFormer, and VMamba across optical-only, SAR-only, and fused inputs show that the dataset is usable but challenging: SAR-only models reach about 35% mIoU, optical-only about 57–66%, and fusion generally improves water and agriculture segmentation. The authors position the dataset as the official track for the IEEE GRSS Data Fusion Contest and publish it on Zenodo.
Load-bearing premise
The benchmark's label quality rests on the premise that pseudo labels produced by optical-trained OpenEarthMap models are accurate enough to supervise SAR segmentation, even though the paper reports only 68.2% mean agreement with manual labels and near-zero IoU for bareland.
Editorial extensions
If this is right
- All-weather mapping becomes testable: models trained on this dataset can be evaluated for land-cover segmentation when optical imagery is unavailable due to clouds.
- The fusion baselines give a reference point for future multi-modal SAR+optical models, with the paper reporting that fused inputs help classes like water and agricultural land.
- The dataset's 35 regions across three continents support studies of geographic generalization and cross-domain adaptation.
- The publicly released Zenodo repository lets researchers reproduce the baseline results and extend them with new methods.
- As the IEEE GRSS Data Fusion Contest Track I official dataset, it provides a shared challenge for improving SAR segmentation.
Reading between the lines
- Beyond the paper's claims, the low per-class agreement for bareland (2.1% IoU) suggests that the pseudo-label pipeline is unreliable for spectrally variable classes; a class-conditional confidence filter could improve the benchmark's usability.
- We infer that the manual labels, at 20 images per region, are too few to train a robust model from scratch, so the dataset's practical value depends on semi-supervised or domain-adaptive methods that combine pseudo and real labels.
- The observed gap between SAR-only (about 35% mIoU) and optical-only (about 57–66% mIoU) results implies that SAR-specific representation learning is still underdeveloped; the benchmark could be used to test self-supervised pre-training on radar imagery.
- Because the SAR imagery comes from a single commercial provider (Umbra) in Spotlight mode, results may not transfer to other sensors or modes; we infer that multi-sensor SAR benchmarks remain an open need.
Signed reviews
Editorial analysis
A structured set of objections, weighed in public.
Referee Report
Summary. This paper introduces OpenEarthMap-SAR, a public benchmark dataset for sub-meter land cover segmentation from SAR imagery. It consists of 5,033 1024x1024 SAR images paired with optical imagery from 35 regions in Japan, France, and the USA, with 8-class land cover labels: pseudo labels generated by pre-trained OpenEarthMap models for all images, and manual annotations for a subset (the paper says 20 images per region, i.e., 700 images). The paper reports baseline semantic segmentation results for U-Net, SegFormer, and VMamba under Optical, SAR, and SAR+Optical modalities and five labeling scenarios (P, P+R1, P+R5, R1, R5), and positions the dataset as the official IEEE GRSS Data Fusion Contest Track I dataset.
Significance. The dataset addresses a real gap: there is no public sub-meter SAR land cover segmentation benchmark with aligned optical imagery and multiple geographic regions. The authors make the dataset publicly available, provide a fixed evaluation protocol, and benchmark three modern architectures. They also disclose the pseudo-label/manual agreement in Table III, which is a sign of transparency. However, the label validation is currently optical-centric and the annotation accounting is inconsistent, so the benchmark claims are not yet fully supported. If revised, this could be a useful community resource.
major comments (4)
- [Section II-B, Table III] The label-quality validation is entirely optical-domain. Pseudo labels are generated with pre-trained OpenEarthMap models [21]-[25] trained on optical imagery, and the manual annotations are not stated to be drawn on SAR images; the paper only says experts manually aligned the paired optical and SAR datasets. Because Umbra Spotlight SAR at 0.15-0.5 m GSD is subject to layover, shadow, and speckle, residual geocoding misalignment can produce pixel-level label-SAR mismatches even after alignment. As a result, the low SAR-only mIoU values in Table IV (e.g., 35.13% for U-Net P and 34.74% for VMamba P) may reflect label misalignment rather than intrinsic SAR difficulty. Please state whether annotators labeled optical or SAR images, report a quantitative residual-alignment metric, and include at least one SAR-grounded label-consistency check (e.g., manual labels drawn directly on SAR or a visual comparison of label boundaries overlaid on SAR).
- [Section II-B, Data split] The annotation accounting is inconsistent. The text says 20 images per region were manually annotated, which gives 700 real labels, yet the evaluation set is described as 490 images containing 14 real labels per region, and the R1 and R5 training settings use 35 and 175 real labels, respectively. These numbers do not add up unless the 20 per-region annotations are further partitioned or some images are unused; the paper does not specify this partition. Please provide an exact per-region split table (manual annotations, evaluation, each training scenario) and reconcile the '700 real labels' statement with the split.
- [Table II and Abstract] The abstract and conclusion claim '1.5 million segments,' but the segment counts in Table II sum to 1,470,800 (1.4708M), and the pixel counts sum to 5,267M, whereas 5,033 x 1,024 x 1,024 = 5,277M pixels. The differences may be due to rounding or to excluded no-data pixels, but this should be stated so the dataset statistics are reproducible.
- [Tables III and IV] Bareland has near-zero IoU in almost all experiments (e.g., 0.00-0.16 for SAR and 0.00-1.47 for Optical in most settings) and the lowest pseudo/manual agreement in Table III (agreement 0.1063, IoU 0.0211). The paper reports this class among the eight benchmark classes without discussing why it is essentially unlearnable. This is relevant to the benchmark claim because it suggests the class definition, its rarity, or its label reliability is problematic; the authors should either provide a class-level failure analysis or revise the class set.
minor comments (5)
- [Section II-B] The word 'pesudo' is a typo and should be 'pseudo'.
- [Table II and text] The class name is inconsistent: 'Agriculture land' in Table II but 'agricultural land' in the text and abstract. Please unify the terminology.
- [References] References [2] and [18] are the same article (Adriano et al., ISPRS J. Photogramm. Remote Sens., 2021) and should not be listed twice.
- [Section II-B, Data split] In the training scenario list, the phrase '4333 images, respectively' is unclear; specify whether these are the images without manual annotations and how this number relates to the 700 manually annotated images.
- [Abstract] The phrase 'The dataset also serves the official dataset for IEEE GRSS Data Fusion Contest Track I' should be reworded to 'serves as the official dataset' for grammatical correctness.
Circularity Check
No significant circularity: pseudo-label provenance is self-cited but independently checked against manual labels.
full rationale
OpenEarthMap-SAR is a dataset and benchmark paper rather than a derivation paper: its contributions are image collection, pseudo labels, manual labels, and baseline evaluations. The pseudo labels are generated by pre-trained OpenEarthMap models [21]-[25], which are prior works by the same group; this is a self-citation, but it is not load-bearing in a circular sense because the paper does not treat the pseudo-label generator as ground truth. It independently compares pseudo labels against 700 manually annotated labels in Table III, reporting 68.2% mean agreement and 56.02% mean IoU, and it explicitly acknowledges pseudo-label noise and cross-modal acquisition mismatches as limitations in the Conclusion. The baseline segmentation results are evaluated on the manually labeled 490-image set, not on the pseudo labels, so the reported mIoU values are not forced by the pseudo-labeling procedure. No equation or fitted parameter is reused as a prediction, and there is no imported uniqueness theorem or ansatz disguised as a citation. The only proximity to circularity is that the pseudo labels originate from the authors' own OpenEarthMap series, but because this is disclosed, quantified against independent manual labels, and the manual labels anchor the evaluation protocol, it does not constitute circularity.
Assumptions & free parameters
assumptions (4)
- domain assumption Pseudo labels generated by pre-trained OpenEarthMap models are valid enough to serve as land cover supervision for SAR imagery.
- domain assumption Manual annotations by multiple experts are accurate and consistent across 35 regions.
- domain assumption Umbra SAR amplitude images in a single VV or HH polarization contain sufficient discriminative signal for 8-class land cover mapping.
- domain assumption 35 regions in Japan, France, and the USA are representative of global land cover diversity.
Cite this review
Pith. "Pith review of OpenEarthMap-SAR: A Benchmark Synthetic Aperture Radar Dataset for Global High-Resolution Land Cover Mapping." pith.science (2026). https://pith.science/paper/POW3LOP6
@misc{pith2026250110891,
  author       = {Pith},
  title        = {Pith review of: OpenEarthMap-SAR: A Benchmark Synthetic Aperture Radar Dataset for Global High-Resolution Land Cover Mapping},
  year         = {2026},
  howpublished = {\url{https://pith.science/paper/POW3LOP6}},
  note         = {Machine review of arXiv:2501.10891}
}
abstract
High-resolution land cover mapping plays a crucial role in addressing a wide range of global challenges, including urban planning, environmental monitoring, disaster response, and sustainable development. However, creating accurate, large-scale land cover datasets remains a significant challenge due to the inherent complexities of geospatial data, such as diverse terrain, varying sensor modalities, and atmospheric conditions. Synthetic Aperture Radar (SAR) imagery, with its ability to penetrate clouds and capture data in all-weather, day-and-night conditions, offers unique advantages for land cover mapping. Despite these strengths, the lack of benchmark datasets tailored for SAR imagery has limited the development of robust models specifically designed for this data modality. To bridge this gap and facilitate advancements in SAR-based geospatial analysis, we introduce OpenEarthMap-SAR, a benchmark SAR dataset, for global high-resolution land cover mapping. OpenEarthMap-SAR consists of 1.5 million segments of 5033 aerial and satellite images with the size of 1024$\times$1024 pixels, covering 35 regions from Japan, France, and the USA, with partially manually annotated and fully pseudo 8-class land cover labels at a ground sampling distance of 0.15--0.5 m. We evaluated the performance of state-of-the-art methods for semantic segmentation and present challenging problem settings suitable for further technical development. The dataset also serves the official dataset for IEEE GRSS Data Fusion Contest Track I. The dataset has been made publicly available at https://zenodo.org/records/14622048.
Figures


Forward citations
Cited by 3 Pith papers
-
Annotation-Free Open-Vocabulary Segmentation for Remote-Sensing Images
SegEarth-OV performs annotation-free open-vocabulary segmentation of remote-sensing images by upsampling CLIP features, removing global bias, and distilling optical knowledge into a SAR encoder.
-
Checkmate: interpretable and explainable RSVQA is the endgame
Checkmate answers RSVQA questions by reading a cell-level text summary of a segmentation map, and the new Chessboard dataset reduces answer bias, yet the cell grounding metric is partly solvable from question text alone.
-
Learning from Noisy Pseudo-labels for All-Weather Land Cover Mapping
A two-stage pipeline improves optical pseudo-labels with self-training and resolution alignment, then trains SAR segmentation with a symmetric cross-entropy loss, reporting first place on the GRSS DFC 2025 benchmark.
Reference graph
Works this paper leans on
-
[21]
Openearthmap: A benchmark dataset for global high-resolution land cover mapping,
J. Xia, N. Yokoya, B. Adriano, and C. Broni-Bediako, “Openearthmap: A benchmark dataset for global high-resolution land cover mapping,” in Proceedings of the IEEE/CVF Winter Conference on Applications of Computer Vision, 2023, pp. 6254–6264
work page 2023
-
[25]
H. Chen, C. Lan, J. Song, C. Broni-Bediako, J. Xia, and N. Yokoya, “ObjFormer: Learning Land-Cover Changes From Paired OSM Data and Optical High-Resolution Imagery via Object-Guided Transformer,” IEEE Transactions on Geoscience and Remote Sensing , vol. 62, pp. 1– 22, 2024
work page 2024
-
[1]
Spacenet 6: Multi-sensor all weather mapping dataset,
J. Shermeyer, D. Hogan, J. Brown, A. Van Etten, N. Weir, F. Paci- fici, R. Hansch, A. Bastidas, S. Soenen, T. Bacastow, and R. Lewis, “Spacenet 6: Multi-sensor all weather mapping dataset,” in Proceedings of the IEEE/CVF Conference on Computer Vision and Pattern Recogni- tion (CVPR) Workshops , June 2020
work page 2020
-
[3]
H. Chen, J. Song, O. Dietrich, C. Broni-Bediako, W. Xuan, J. Wang, X. Shao, Y . Wei, J. Xia, C. Lan, K. Schindler, and N. Yokoya, “Bright: A globally distributed multimodal building damage assessment dataset with very-high-resolution for all-weather disaster response,” arXiv preprint arXiv:2501.06019 , 2025. [Online]. Available: https://arxiv.org/abs/2501.06019
arXiv 2025
-
[4]
M. Gazzea, A. Solheim, and R. Arghandeh, “High-resolution mapping of forest structure from integrated SAR and optical images using an enhanced u-net method,” Science of Remote Sensing , vol. 8, p. 100093, 2023
work page 2023
-
[5]
Towards a 20 m global building map from sentinel-1 SAR data,
M. Chini, R. Pelich, R. Hostache, P. Matgen, and C. Lopez-Martinez, “Towards a 20 m global building map from sentinel-1 SAR data,” Remote Sensing , vol. 10, no. 11, 2018
work page 2018
-
[6]
S. Hafner, Y . Ban, and A. Nascetti, “Unsupervised domain adaptation for global urban extraction using sentinel-1 SAR and sentinel-2 msi data,” Remote Sensing of Environment , vol. 280, p. 113192, 2022
work page 2022
-
[7]
Deep learning-based building footprint mapping using high-resolution SAR data,
M. Recla and M. Schmitt, “Deep learning-based building footprint mapping using high-resolution SAR data,” in IGARSS 2024 - 2024 IEEE International Geoscience and Remote Sensing Symposium , 2024, pp. 9983–9986
work page 2024
Show all 29 references
-
[8]
SAR data applications in earth observation: An overview,
A. Tsokas, M. Rysz, P. M. Pardalos, and K. Dipple, “SAR data applications in earth observation: An overview,” Expert Systems with Applications, vol. 205, p. 117342, 2022
2022
-
[9]
Transfer adaptation learning for target recognition in SAR images: A survey,
X. Yang, L. Jiao, and Q. Pan, “Transfer adaptation learning for target recognition in SAR images: A survey,” IEEE Journal of Selected Topics in Applied Earth Observations and Remote Sensing , vol. 17, pp. 13 577– 13 601, 2024
2024
-
[10]
Deep learning meets SAR: Concepts, models, pitfalls, and perspectives,
X. X. Zhu, S. Montazeri, M. Ali, Y . Hua, Y . Wang, L. Mou, Y . Shi, F. Xu, and R. Bamler, “Deep learning meets SAR: Concepts, models, pitfalls, and perspectives,” IEEE Geoscience and Remote Sensing Magazine , vol. 9, no. 4, pp. 143–172, 2021
2021
-
[11]
Mcanet: A joint semantic segmentation framework of optical and SAR images for land use classification,
X. Li, G. Zhang, H. Cui, S. Hou, S. Wang, X. Li, Y . Chen, Z. Li, and L. Zhang, “Mcanet: A joint semantic segmentation framework of optical and SAR images for land use classification,” International Journal of Applied Earth Observation and Geoinformation , vol. 106, p. 102638, 2022
2022
-
[12]
SIVED: A SAR image dataset for vehicle detection based on rotatable bounding box,
X. Lin, B. Zhang, F. Wu, C. Wang, Y . Yang, and H. Chen, “SIVED: A SAR image dataset for vehicle detection based on rotatable bounding box,” Remote Sensing , vol. 15, no. 11, 2023
2023
-
[13]
Sefepnet: Scale expansion and feature enhancement pyramid network for SAR aircraft detection with small sample dataset,
P. Zhang, H. Xu, T. Tian, P. Gao, L. Li, T. Zhao, N. Zhang, and J. Tian, “Sefepnet: Scale expansion and feature enhancement pyramid network for SAR aircraft detection with small sample dataset,” IEEE Journal of Selected Topics in Applied Earth Observations and Remote Sensing ,...
2022
-
[14]
SAR- AIRcraft-1.0: High-resolution SAR aircraft detection and recognition dataset,
Z. Wang, Y . Kang, X. Zeng, Y . Wang, T. Zhang, and X. Sun, “SAR- AIRcraft-1.0: High-resolution SAR aircraft detection and recognition dataset,” Journal of Radars , vol. 12, no. 4, pp. 906–922, 2023. 8
2023
-
[15]
SARDet-100k: Towards open-source benchmark and toolkit for large- scale SAR object detection,
Y . Li, X. Li, W. Li, Q. Hou, L. Liu, M.-M. Cheng, and J. Yang, “SARDet-100k: Towards open-source benchmark and toolkit for large- scale SAR object detection,” in The Thirty-eighth Annual Conference on Neural Information Processing Systems (NeurIPS) , 2024
2024
-
[16]
Object-level semantic segmentation on the high-resolution gaofen-3 fuSAR-map dataset,
X. Shi, S. Fu, J. Chen, F. Wang, and F. Xu, “Object-level semantic segmentation on the high-resolution gaofen-3 fuSAR-map dataset,” IEEE Journal of Selected Topics in Applied Earth Observations and Remote Sensing , vol. 14, pp. 3107–3119, 2021
2021
-
[17]
A benchmark high-resolution gaofen-3 SAR dataset for building seman- tic segmentation,
J. Xia, N. Yokoya, B. Adriano, L. Zhang, G. Li, and Z. Wang, “A benchmark high-resolution gaofen-3 SAR dataset for building seman- tic segmentation,” IEEE Journal of Selected Topics in Applied Earth Observations and Remote Sensing , vol. 14, pp. 5950–5963, 2021
2021
-
[18]
Learning from multimodal and multitemporal earth observation data for building damage mapping,
B. Adriano, N. Yokoya, J. Xia, H. Miura, W. Liu, M. Matsuoka, and S. Koshimura, “Learning from multimodal and multitemporal earth observation data for building damage mapping,” ISPRS Journal of Photogrammetry and Remote Sensing , vol. 175, pp. 132–143, 2021
2021
-
[19]
Spacenet 6: Multi-sensor all weather mapping dataset,
J. Shermeyer, D. Hogan, J. Brown, A. Van Etten, N. Weir, F. Paci- fici, R. H ¨ansch, A. Bastidas, S. Soenen, T. Bacastow, and R. Lewis, “Spacenet 6: Multi-sensor all weather mapping dataset,” in 2020 IEEE/CVF Conference on Computer Vision and Pattern Recognition Workshops (CVP...
2020
-
[20]
Quickquakebuildings: Post- earthquake SAR-optical dataset for quick damaged-building detection,
Y . Sun, Y . Wang, and M. Eineder, “Quickquakebuildings: Post- earthquake SAR-optical dataset for quick damaged-building detection,” IEEE Geoscience and Remote Sensing Letters , vol. 21, pp. 1–5, 2024
2024
-
[22]
Submeter-level land cover mapping of japan,
N. Yokoya, J. Xia, and C. Broni-Bediako, “Submeter-level land cover mapping of japan,” International Journal of Applied Earth Observation and Geoinformation , vol. 127, p. 103660, 2024
2024
-
[23]
Generalized few-shot semantic segmentation in remote sensing: Chal- lenge and benchmark,
C. Broni-Bediako, J. Xia, J. Song, H. Chen, M. Siam, and N. Yokoya, “Generalized few-shot semantic segmentation in remote sensing: Chal- lenge and benchmark,” IEEE Geoscience and Remote Sensing Letters , pp. 1–5, 2024
2024
-
[24]
Generating national very high-resolution land cover product of france without any labels: A comparative study,
J. Xia, C. Broni-Bediako, and N. Yokoya, “Generating national very high-resolution land cover product of france without any labels: A comparative study,” 2023. [Online]. Available: https: //ssrn.com/abstract=4987487
2023
-
[26]
LoveDA: A remote sensing land-cover dataset for domain adaptive semantic segmentation,
J. Wang, Z. Zheng, A. Ma, X. Lu, and Y . Zhong, “LoveDA: A remote sensing land-cover dataset for domain adaptive semantic segmentation,” in Neural Information Processing Systems (NeurIPS) , 2021
2021
-
[27]
Deepglobe 2018: A challenge to parse the earth through satellite images,
I. Demir, K. Koperski, D. Lindenbaum, G. Pang, J. Huang, S. Basu, F. Hughes, D. Tuia, and R. Raskar, “Deepglobe 2018: A challenge to parse the earth through satellite images,” in Proceedings of the IEEE Conference on Computer Vision and Pattern Recognition Workshops , 2018, pp...
2018
-
[28]
U-net: Convolutional networks for biomedical image segmentation,
O. Ronneberger, P. Fischer, and T. Brox, “U-net: Convolutional networks for biomedical image segmentation,” in International Conference on Medical image computing and computer-assisted intervention . Springer, 2015, pp. 234–241
2015
-
[29]
SegFormer: Simple and efficient design for semantic segmentation with transformers,
E. Xie, W. Wang, Z. Yu, A. Anandkumar, J. M. Alvarez, and P. Luo, “SegFormer: Simple and efficient design for semantic segmentation with transformers,” in NeurIPS, 2021
2021
-
[30]
Vmamba: Visual state space model,
Y . Liu, Y . Tian, Y . Zhao, H. Yu, L. Xie, Y . Wang, Q. Ye, and Y . Liu, “Vmamba: Visual state space model,” arXiv preprint arXiv:2401.10166 , 2024
2024 arXiv
Reviewed August 10, 2026 · model on record in the stance chip above.
Discussion (0). Continue with ORCID to comment.