REVIEW 4 major objections 7 minor 22 references
Interpretable Causal Representation Learning for Biological Data in the Pathway Space
T0 review · 4 major / 7 minor · reviewed 2026-08-07 · deepseek-v4-flash
Pith's one-line read SENA-discrepancy-VAE learns causal latent factors that are readable as combinations of biological pathway activities while matching the predictive accuracy of its non-interpretable baseline on unseen double perturbations.
desk verdict SENA-δ is a useful interpretable encoder for discrepancy-VAE with solid predictive benchmarks, but the causal identifiability claim doesn't hold because interventions shift Z and U = Z^T (I-A)^{-1} couples factors. read the letter →
The pith
A machine-rendered reading of the paper's core claim, the machinery that carries it, and where it could break.
The reading
What carries the argument
The load-bearing object is the SENA-$\delta$ encoder, a two-layer masked MLP. Its first layer maps gene expression $x$ to pathway activities $\alpha$ using a sparsity mask $M$ defined by $M_{i,k}=1$ if gene $i$ belongs to pathway $k$ and $\lambda$ otherwise, so each pathway activity is a weighted sum of the expression of its genes with a small allowance for unannotated genes; its second layer maps $\alpha$ linearly to the mean and variance of the Gaussian exogenous variables $Z_j$, making every latent causal factor a linear combination of pathway activities. This construction reconciles the biological fact that a gene knockout shifts many processes with the CRL requirement, inherited from discrepancy-VAE theory, that each intervention target exactly one latent factor: the single target becomes a composite of pathway activities. The decoder stays polynomial, so the identifiability theorem (latent factors recoverable up to permutation and scaling) continues to apply, and the path matrix $(I-A)^{-1}$ of the learned causal DAG converts meta-pathway activities into the causal pathway archetypes $U$.
What would settle it
Train SENA-discrepancy-VAE on a synthetic linear-Gaussian causal model with known single-target interventions and compare the inferred intervention-to-factor assignments and adjacency matrix with the ground truth; if the recovered assignments are not equivalent up to permutation and scaling, the claimed causal interpretation fails. On real data, a direct biological test is to knock out a gene that sits in two pathways assigned to two different latent factors and measure whether the expression shift activates both factors, which the model predicts it should not.
Extended reading notes
Core claim
The central discovery is that pathway knowledge can be injected directly into the encoder of a causal representation learner while preserving the identifiability guarantees that make the latent factors causal. The SENA-$\delta$ encoder computes pathway activities $\alpha = \sigma((W \odot M)^\top x)$, where the mask $M$ encodes gene--pathway membership, and then parameterizes each latent exogenous variable $Z_j$ as a linear combination of those activities: $\mu_j = \alpha^\top \delta_j^{(\mu)}$ and $\sigma_j^2 = \alpha^\top \delta_j^{(\sigma)}$. Because each causal factor is $U = Z^\top(I-A)^{-1}$, every latent factor has an expected value that is a linear readout of pathway activities through the learned causal DAG, so the factors can be read as combinations of biological processes rather than anonymous axes. Empirically, the paper shows this design matches or slightly improves on the non-interpretable discrepancy-VAE when predicting unseen double perturbations, and that the learned factors and causal edges are biologically meaningful, stable across hyperparameters, and validated by differential-activation tests on two Perturb-seq datasets.
Load-bearing premise
The load-bearing premise is that every perturbation changes exactly one hidden causal factor: the single-target intervention assumption inherited from discrepancy-VAE theory, which the paper itself concedes in the Discussion keeps the method from fully disentangling how biological processes, perturbations, and latent factors relate.
Editorial extensions
If this is right
- At 105 latent factors and $\lambda=0.1$, SENA-discrepancy-VAE predicts unseen double-gene perturbations with MMD 1.5849 on the predicted distributions and a control-sample reconstruction MSE of 0.02134, compared with 1.5981 and 0.02152 for the original MLP-encoder discrepancy-VAE; interpretability is therefore not bought at the cost of predictive accuracy on this benchmark.
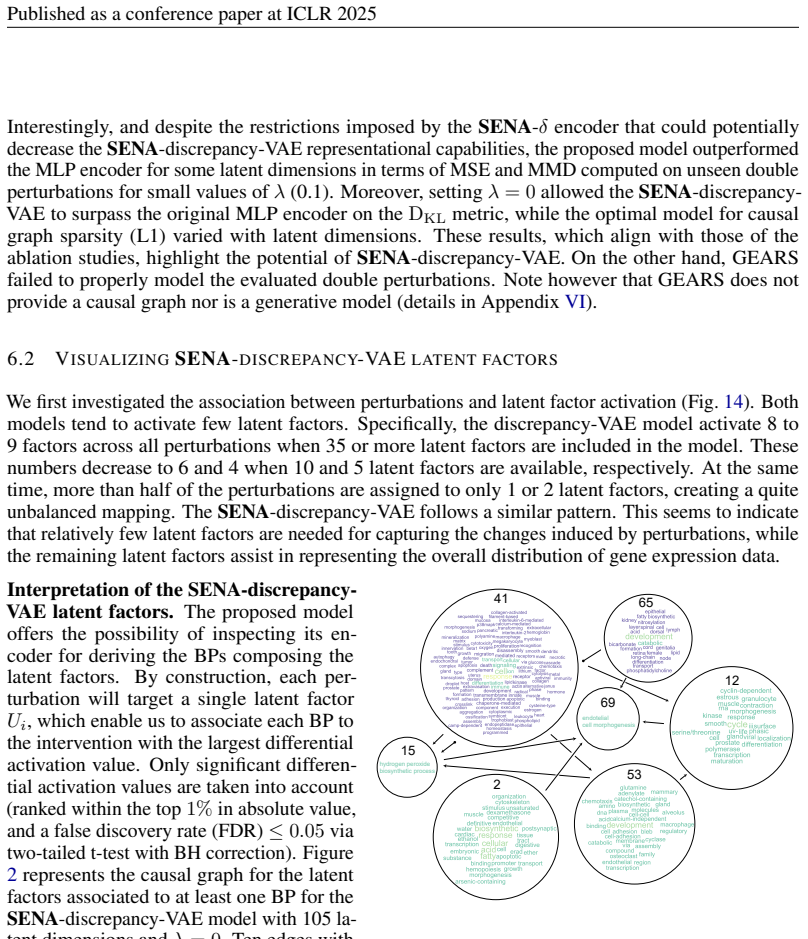
- The inferred causal graph can be read as relationships between biological processes: the model recovers a path from catechol-containing compound biosynthesis through hydrogen peroxide biosynthesis to endothelial cell morphogenesis, matching known regulatory biology in an unsupervised way.
- The pathway activity layer is itself informative: for knockout perturbations, pathways containing the targeted gene show significantly higher differential activation than other pathways (DAR > 1 for nearly all of the 37 evaluated knockouts), so the same encoder can be used to flag which biological processes a perturbation engages.
- The meta-pathway activities are significantly associated with high-level Gene Ontology categories in permutation tests, indicating that the data-driven second layer groups specific pathways into broader, biologically coherent programs.
- On the Wessels2023 dataset, where perturbations have similar transcriptomic effects, both models collapse all single-gene perturbations onto a single latent factor; this shows the limit of the approach when biological signal is weak, a finding the paper itself reports.
Reading between the lines
- Because $\lambda>0$ lets genes outside a pathway contribute to its activity, the learned weights on masked edges are a candidate resource for discovering missing gene--pathway memberships; a gene whose masked weight remains large across perturbations would be a testable, unannotated member of that pathway, an extension the paper does not perform.
- The single-target intervention assumption forces overlapping pathway sets to share a latent factor, so the framework would become more general if the identifiability theory were relaxed to interventions that shift a sparse set of factors; the paper itself marks this as the next step.
- If pathway activity levels are largely conserved across cell types, the fixed gene--pathway mask could allow causal factors to be aligned across tissues by retraining only the second layer of the encoder, enabling transfer of perturbation-response predictions between cell lines; this is a reader inference, not a paper claim.
- The generative structure of the model (sample $Z$, compute $U = Z^\top(I-A)^{-1}$, pass through the polynomial decoder) can produce counterfactual expression profiles for interventions never observed, pointing toward in silico drug-combination screening; the paper demonstrates double-perturbation prediction but does not frame the model as a screening platform.
Editorial analysis
A structured set of objections, weighed in public.
Referee Report
Summary. The paper proposes SENA-discrepancy-VAE, an extension of discrepancy-VAE in which the MLP encoder is replaced by a two-layer masked encoder (SENA-delta) that maps gene expression to the activity levels of Gene Ontology biological processes and then linearly maps those activities to the mean and variance of latent meta-pathway variables Z, with causal factors defined as U = Z^T (I-A)^{-1}. The model is trained on unperturbed and single-gene Perturb-seq data from Norman2019 and Wessels2023 and evaluated on prediction of double-gene perturbation distributions (MMD) and reconstruction (MSE). The authors report that SENA-discrepancy-VAE with lambda=0.1 matches or slightly improves on the original discrepancy-VAE at latent dimension 105, while providing pathway-based interpretations of latent factors and a causal graph with apparently plausible edges. The paper also presents DA/DAR analyses suggesting that BPs containing the targeted gene are more differentially activated, and an appendix 'validation' of the linear mapping between pathway activities and latent factors.
Significance. The intended contribution, an interpretable causal representation learning method for Perturb-seq that preserves predictive performance, is valuable and the architectural idea is simple and reusable. The paper provides code, uses two real datasets, and includes extensive ablations; the finding that a constrained, pathway-masked encoder can match a free MLP encoder at high latent dimension is informative. However, the formal causal claim is not fully supported: the transfer of identifiability guarantees is not established, and the empirical interpretability evidence is partly definitional. If the authors can clarify or relax the theoretical claims and add controls for the interpretability metrics, the paper would be a solid contribution to interpretable single-cell modeling.
major comments (4)
- [Section 3, Figure 1, Appendix I] The manuscript does not establish that the trained SENA-discrepancy-VAE satisfies the single-target intervention assumption under which discrepancy-VAE is identifiable. The interventional branch applies a learnable shift to the meta-pathway activities Z, and with U = Z^T (I-A)^{-1}, a shift in one Z_j changes multiple U_i through the generally non-monomial matrix L. If the intended target is the single U_j whose noise is shifted, this should be stated and the sparsity of the learned shift in U-space should be verified; otherwise the guarantees of Ahuja et al. (2023) and Zhang et al. (2024) do not transfer. The Discussion in Section 7 concedes that the single-target assumption prevents full disentanglement of BPs, perturbations and latent factors, which further weakens the 'principled identifiability' claim in the Introduction.
- [Appendix I, Eq. (10) and Fig. 5] The 'experimental validation' reporting r=1.00 is circular. E(U_j)=E(Z^T)L_j=mu^T L_j=alpha^T Delta^(mu) L_j is an algebraic identity that follows immediately from the definitions of mu, Delta and L, so the perfect correlation only verifies that the code implements the stated linear algebra; it provides no evidence about biological interpretability. This exercise should be reframed as a software sanity check, and the interpretability claims should rest on the DA/DAR analyses instead.
- [Section 4.3 and Section 6.3] The Hits@100 and DAR metrics are partly self-referential. A BP is classified as 'affected' by perturbation p exactly when it contains the targeted gene in the mask M, and the SENA layer computes that BP's activity as a weighted sum that includes the targeted gene's expression. Because a KO changes the targeted gene's expression, a positive differential activation for 'affected' BPs is substantially built into the construction, independent of what the model learns. The paper should include a control, e.g., permuted gene-BP masks or a fixed random-weight SENA layer, to demonstrate that the learned weights add biological signal beyond the mask.
- [Section 6.2] The biological validity of the inferred causal graph is supported only by a small number of manually selected edges (e.g., factor 15 to 69), and Appendix II shows stability across hyperparameters but not correctness. Without a quantitative comparison to known regulatory interactions or a blinded evaluation, the claim that the model 'recapitulat[es] known biological causal relationships' is anecdotal. This is load-bearing for the causal-interpretation claim and should be addressed with a systematic evaluation.
minor comments (7)
- [Introduction] In the Introduction, 'yielding talent factors' should read 'yielding latent factors'.
- [Section 2.1] The heading 'CASUAL REPRESENTATION LEARNING' contains a typo and should be 'CAUSAL REPRESENTATION LEARNING'.
- [Eq. (4)] Equation (4) uses the indicator function I[.] without defining it; please define the notation or use standard indicator notation.
- [Table 1] The caption of Table 1 states 'mean ± variance', but the reported quantities appear to be standard deviations; the caption should be corrected.
- [Figure 8 caption] The caption of Figure 8 refers to 'Eq.??'; the equation number is missing and should be filled in.
- [Section 6.2 and Section 6.3] There are typos in gene names: 'JUNE' in Section 6.2 should be 'JUN', and 'TXB3' in Section 6.3 should be 'TBX3'.
- [Appendix V] The dataset is called 'Wessels2023' in the text but the cited paper is Wessels et al. (2022); please unify the dataset label with the reference.
Circularity Check
SENA's interpretability 'validations' are algebraic identities of the encoder definition; the double-perturbation predictive benchmark is independent.
-
self definitional
[Appendix I, Eqs. (6)-(10) and Fig. 5]
"Finally, we experimentally validated, using the Norman2019 dataset, that Eq. (9) holds for both the original discrepancy-VAE (MLP), and the proposed SENA-δ model for both λ={0,0.1}... There is a perfect correlation among these two terms, and this patterns is maintained across models and perturbations."
Eq. (10) is not an empirical relation: U is defined as Z^T (I-A)^{-1} in Eq. (8), E(Z_j)=mu_j=alpha^T delta_j^{(mu)} in Eqs. (6)-(7), so E(U_j)=mu·L_j=alpha^T Delta^{(mu)} L_j holds by pure algebra. The Figure 5 scatter compares two computations of the same definitional quantity, so the reported r=1.00 is guaranteed. The 'experimental validation' therefore checks arithmetic, not whether the latent factors are biologically meaningful.
-
self definitional
[Section 4.3, Eqs. (1), (4)-(5); used in Section 6.3]
"we define Wp as the set of BPs that contain the targeted gene i: Wp ={BP k|Mi,k = 1}. ... Intuitively, we would expect BPs containing the targeted gene to be the most affected by the intervention, while the other processes should only suffer indirect effects."
The same mask M both constructs the pathway activities in Eq. (1) (alpha = sigma((W⊙M)^T x)) and labels BPs as 'affected' in Wp. For a perturbation of gene i, every BP in Wp receives x_i directly through M_{i,k}=1, so a knockout-induced change in x_i mechanically feeds into alpha_k. Hits@N and DAR therefore partly measure the encoder's own input wiring rather than an independent biological signal; the affected/not-affected split is not external to the model definition even though the mask values come from GO.
full rationale
The strongest circularity is in Appendix I: Eq. (10) is an algebraic identity following from U=Z^T(I-A)^{-1}, E(Z)=mu, and mu=alpha^T Delta, so the r=1.00 'experimental validation' is a tautology, not an empirical result. A second definitional loop affects the interpretability metrics: Section 4.3 labels BPs as 'affected' using the same mask M that builds the SENA layer's alpha in Eq. (1), so elevated differential activation for those BPs is partly enforced by construction. These are genuine circular validations of the interpretability claim. However, the paper's other central claim—comparable predictive performance on unseen double perturbations—is benchmarked against discrepancy-VAE and GEARS on held-out double KOs in Table 1 and on the Wessels dataset in Table 5; this part is external and non-circular. The gap between the single-target identifiability assumption and the coupled mapping U=Z^T(I-A)^{-1} is a correctness or assumption-violation concern, not a circularity, and the Discussion's concession that the assumption 'does not allow CRL methods to thoroughly disentangle' supports that concern without changing the circularity score. Overall, partial circularity in the interpretability evidence, with independent predictive content, warrants a score of 6.
Assumptions & free parameters
free parameters (4)
- Mask relaxation lambda =
0, 0.1, 1e-2, 1e-3 (ablation); lambda=0.1 and lambda=0 for main model
- Latent dimension d =
5, 10, 35, 70, 105 (Norman2019); 14, 28, 50 (Wessels2023)
- BP selection thresholds =
GO terms with <30 genes, >=5 genes in data, overlap removal, ancestor removal, resulting in 454 BPs
- Hits@100 N =
100
assumptions (4)
- domain assumption Each intervention targets exactly one latent causal factor and the latent causal graph is a DAG.
- domain assumption The decoder h is a full-rank polynomial and the encoder f is non-collapsing.
- domain assumption Pathway activity is a linear function of gene expression, and meta-pathway expectations are linear in pathway activity.
- domain assumption The curated GO gene sets are a faithful and sufficiently complete prior for active biological processes in the studied cell lines.
invented entities (2)
-
Meta-pathway activities Z_j
-
Causal pathway archetypes U_i
Cite this review
Pith. "Pith review of Interpretable Causal Representation Learning for Biological Data in the Pathway Space." pith.science (2026). https://pith.science/paper/ZB5IL4RL
@misc{pith2026250612439,
  author       = {Pith},
  title        = {Pith review of: Interpretable Causal Representation Learning for Biological Data in the Pathway Space},
  year         = {2026},
  howpublished = {\url{https://pith.science/paper/ZB5IL4RL}},
  note         = {Machine review of arXiv:2506.12439}
}
read the original abstract
Predicting the impact of genomic and drug perturbations in cellular function is crucial for understanding gene functions and drug effects, ultimately leading to improved therapies. To this end, Causal Representation Learning (CRL) constitutes one of the most promising approaches, as it aims to identify the latent factors that causally govern biological systems, thus facilitating the prediction of the effect of unseen perturbations. Yet, current CRL methods fail in reconciling their principled latent representations with known biological processes, leading to models that are not interpretable. To address this major issue, we present SENA-discrepancy-VAE, a model based on the recently proposed CRL method discrepancy-VAE, that produces representations where each latent factor can be interpreted as the (linear) combination of the activity of a (learned) set of biological processes. To this extent, we present an encoder, SENA-{\delta}, that efficiently compute and map biological processes' activity levels to the latent causal factors. We show that SENA-discrepancy-VAE achieves predictive performances on unseen combinations of interventions that are comparable with its original, non-interpretable counterpart, while inferring causal latent factors that are biologically meaningful.
Figures


Figures from the paper (11 more)


Reference graph
Works this paper leans on
-
[1]
and in this section’s Table 6 to compare against MSE. When analyzing these results, we found that the MSE on double perturbations exhibited scores 10 times larger than the one reported during training for validation folds (0.00368 ± 0.000363 across different latent dimension sizes for one seed), which suggest a potential lack of generalization. Moreover, ...
-
[2]
The Wessels2023 study focused on perturbing myeloid differentiation regulators Wessels et al. (2022). This resulted in all perturbations having similar effects at the transcriptomics levels, as shown in Fig
work page 2022
-
[6]
doi: 10.1038/s41556-022-01072-x
ISSN 1476-4679. doi: 10.1038/s41556-022-01072-x. URL https://doi.org/10.1038/ s41556-022-01072-x. Soha Mcheik, Leticia Aptecar, Peter Coopman, Véronique D’Hondt, and Gilles Freiss. Dual role of the ptpn13 tyrosine phosphatase in cancer.Biomolecules, 10(12),
-
[9]
URL https://dl.acm.org/doi/10.5555/ 3495724.3495797
doi: 10.5555/3495724.3495797. URL https://dl.acm.org/doi/10.5555/ 3495724.3495797. Judea Pearl. Causal inference in statistics: An overview.Statistics Surveys,
-
[10]
ISSN 2589-0042. doi: https://doi. org/10.1016/j.isci.2024.109478. URL https://www.sciencedirect.com/science/ article/pii/S2589004224006990. Yusuf Roohani, Kexin Huang, and Jure Leskovec. Predicting transcriptional outcomes of novel multigene perturbations with gears.Nature Biotechnology, 42(6):927–935,
-
[11]
While in the Norman2019 datasets cells affected by different perturbations tend to cluster separately (panel A), most of the interventions in Wessels2023 are grouped together (panel B), indicating similar profiles. Moreover, the number of genes that are differentially expressed following a perturbation is generally lower in the Wessels2023 study than in N...
work page 2025
-
[12]
URL https://arxiv.org/ abs/2310.14935. Korneel Vandenbroucke, Steven Robbens, Klaas Vandepoele, Dirk Inzé, Yves Van de Peer, and Frank Van Breusegem. Hydrogen peroxide-induced gene expression across kingdoms: a comparative analysis.Mol. Biol. Evol., 25(3):507–516, March
-
[20]
per perturbation in the Norman2019 and Wessels2023 dataset. Table 5: Performance comparison between SENA-discrepancy-V AE and discrepancy-V AE on the Wessel2023 dataset across different lambda values and latent factors for double perturbation samples. Note that KLD and L1 losses are not dependent on the samples, but computed after the training process is ...
Show all 22 references
-
[22]
Each row lists a latent factor, the number of targeted perturbations, and associated biological processes within it
details. Each row lists a latent factor, the number of targeted perturbations, and associated biological processes within it. Latent Factor Targeting Perturbations Biological Processes 41 41 57 65 6 10 2 18 14 53 25 10 69 1 1 15 1 1 12 9 10 Table 8:Top 6 (knockout, gene set) p...
2025
-
[35]
7 A-B shows the histogram of permuted vs true contributions for every L2BP on the first meta-pathway factor and Fig
Fig. 7 A-B shows the histogram of permuted vs true contributions for every L2BP on the first meta-pathway factor and Fig. 7-C depict the distribution of corrected p-values for ev- ery meta-pathway and L2BP, where blanks represent non-significant contributions (corrected p-valu...
2022
-
[105]
,105}by forwarding the cells and averaging (over 10,000 realization of Z∼ N(µ, σ2)) the obtained pathway archetype scores (i.e., the causal latent factors Us)
To this end, we first computed E(Uj) for every latent dimension j∈ {1, . . . ,105}by forwarding the cells and averaging (over 10,000 realization of Z∼ N(µ, σ2)) the obtained pathway archetype scores (i.e., the causal latent factors Us). On the other hand, we multiplied the BP ...
2025
-
[2000]
Kingma and Max Welling
Diederik P. Kingma and Max Welling. Auto-Encoding Variational Bayes. In2nd International Conference on Learning Representations, ICLR 2014, Banff, AB, Canada, April 14-16, 2014, Conference Track Proceedings,
2014
-
[2002]
12 Published as a conference paper at ICLR 2025 Alejandro Tejada-Lapuerta, Paul Bertin, Stefan Bauer, Hananeh Aliee, Yoshua Bengio, and Fabian J. Theis. Causal machine learning for single-cell genomics,
2025
-
[2012]
Gilles Gut, Stefan G Stark, Gunnar Rätsch, and Natalie R Davidson
URL http://jmlr.org/papers/v13/gretton12a.html. Gilles Gut, Stefan G Stark, Gunnar Rätsch, and Natalie R Davidson. Pmvae: Learning interpretable single-cell representations with pathway modules.bioRxiv, pp. 2021–01,
2021
-
[2016]
Season combinatorial intervention predictions with salt & peper.arXiv preprint arXiv:2404.16907,
Thomas Gaudelet, Alice Del Vecchio, Eli M Carrami, Juliana Cudini, Chantriolnt-Andreas Kapourani, Caroline Uhler, and Lindsay Edwards. Season combinatorial intervention predictions with salt & peper.arXiv preprint arXiv:2404.16907,
-
[2018]
doi: 10.1186/ s13059-017-1382-0
ISSN 1474-760X. doi: 10.1186/ s13059-017-1382-0. URLhttp://dx.doi.org/10.1186/s13059-017-1382-0. Jiaqi Zhang, Kristjan Greenewald, Chandler Squires, Akash Srivastava, Karthikeyan Shanmugam, and Caroline Uhler. Identifiability guarantees for causal disentanglement from soft int...
-
[2019]
Deep structural causal models for tractable counterfactual inference
Nick Pawlowski, Daniel C Castro, and Ben Glocker. Deep structural causal models for tractable counterfactual inference. InAdvances in Neural Information Processing Systems 33 (NeurIPS 2020),
2020
-
[2020]
doi: 10.3390/biom10121659
ISSN 2218-273X. doi: 10.3390/biom10121659. URLhttps://www.mdpi.com/2218-273X/10/12/1659. Seyednami Niyakan, Xihaier Luo, Byung-Jun Yoon, and Xiaoning Qian. Biologically interpretable vae with supervision for transcriptomics data under ordinal perturbations.bioRxiv, pp. 2024–03,
-
[2021]
13 Published as a conference paper at ICLR 2025 APPENDIX I INTERPRETABILITY OF LATENT FACTORS AND CAUSAL GRAPH THROUGH OUR PROPOSED SPARSE LAYER In the variational autoencoder proposed at Zhang et al. (2024), the exogenous variable Zj is sampled from a normal distribution, whe...
2024
-
[2022]
doi: 10.1038/S41592-022-01705-X
ISSN 15487105. doi: 10.1038/S41592-022-01705-X. URL https://pmc.ncbi.nlm.nih.gov/articles/PMC10030154/. F. Alexander Wolf, Philipp Angerer, and Fabian J. Theis. Scanpy: large-scale single-cell gene expression data analysis.Genome Biology, 19(1), February
-
[2023]
scGen predicts single-cell perturbation responses.Nature Methods, 16(8):715–721,
11 Published as a conference paper at ICLR 2025 Mohammad Lotfollahi, Felix A Wolf, and Fabian J Theis. scGen predicts single-cell perturbation responses.Nature Methods, 16(8):715–721,
2025
-
[2024]
doi: 10.1038/s41587-023-01940-3
ISSN 1546-1696. doi: 10.1038/s41587-023-01940-3. URL https://doi.org/10. 1038/s41587-023-01940-3. Romain Lopez, Jeffrey Regier, Michael B Cole, Michael I Jordan, and Nir Yosef. Deep generative modeling for single-cell transcriptomics.Nature Methods, 15(12):1053–1058,
Reviewed August 7, 2026 · model on record in the stance chip above.
Discussion (0). Continue with ORCID to comment.