REVIEW 4 major objections 5 minor 15 references
FundaQ-8: A Clinically-Inspired Scoring Framework for Automated Fundus Image Quality Assessment
T0 review · 4 major / 5 minor · reviewed 2026-08-06 · deepseek-v4-flash
Pith's one-line read FundaQ-8 is an eight-attribute scoring rubric that lets a small regression network rate retinal image quality on a continuous 0 to 1 scale, matching expert scores on its test set and stratifying diabetic retinopathy detection.
desk verdict The eight-attribute rubric and external EyeQ correlation are real, but the DR experiment is internally inconsistent and the clinical claim does not survive it. read the letter →
The pith
A machine-rendered reading of the paper's core claim, the machinery that carries it, and where it could break.
The reading
What carries the argument
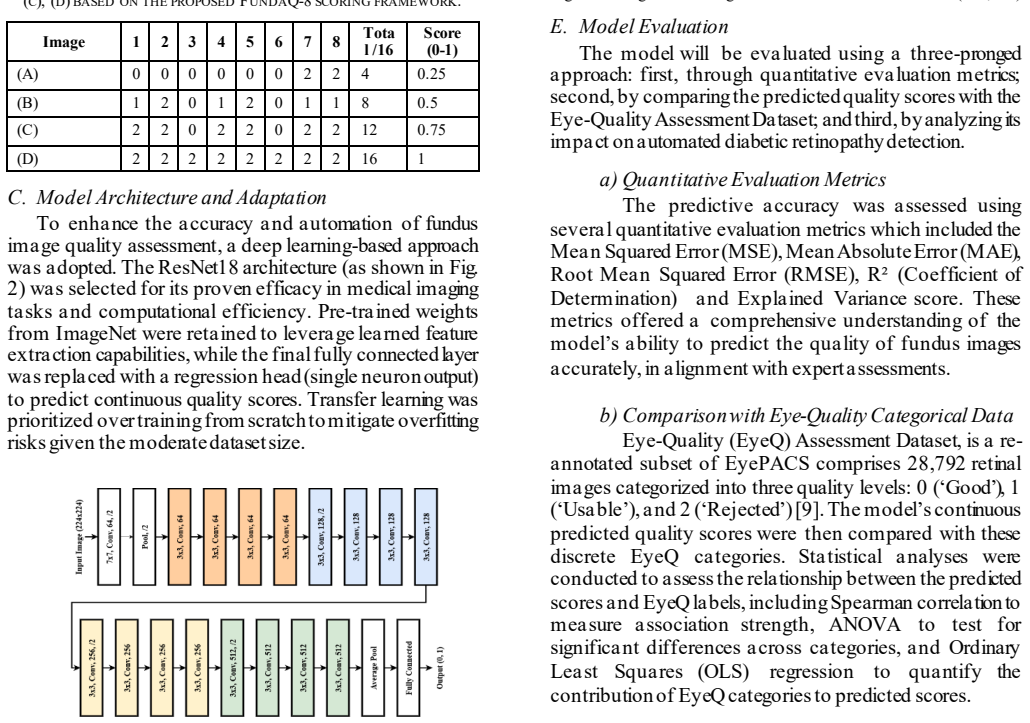
The central object is the FundaQ-8 scoring rubric: eight named attributes, each rated on a 0 to 2 Likert scale with descriptions tied to diagnostic usability, summed and normalized to a continuous 0 to 1 score. This rubric carries the argument by converting subjective expert judgment into structured labels; a ResNet18 with a single-neuron regression head is then trained to predict those labels, and the rubric's attribute-level detail is what gives the score its interpretability.
What would settle it
Have an independent panel of ophthalmologists rate the same images with their own quality criteria and compare against FundaQ-8; near-zero agreement would show the rubric does not reproduce expert judgment. A more direct test would measure whether clinically significant lesions are missed in images the model scores above 0.8 as often as in images scored below 0.4; if low-scoring images are no more likely to hide pathology, the score is not a diagnostic-quality measure.
Extended reading notes
Core claim
The central claim is that a continuous, interpretable quality score for retinal images can be derived from eight explicit clinical attributes, and that a small transfer-learned network can learn to predict that score well enough to align with expert judgment. The paper reports test-set MAE of 0.0992 and $R^2$ of 0.7734, a strong negative correlation with EyeQ quality categories (Spearman -0.752), and DR detection accuracy that is substantially higher for images scored good than for images scored bad. In the authors' framing, this shows that a structured expert rubric can serve as a reproducible training target, giving automated quality assessment a granular and clinically meaningful output rather than a coarse category.
Load-bearing premise
The load-bearing premise is that the eight attributes chosen by the authors' ophthalmologists, weighted equally, capture what actually makes a retinal image diagnostically usable; if they do not, the model's scores inherit that blind spot.
Editorial extensions
If this is right
- Screening programs could use the continuous score to reject low-quality images before they reach a human reader, potentially reducing the 12-25% retake burden cited in the paper.
- The model's alignment with EyeQ categories (Spearman -0.752) suggests the learned score transfers to an independent categorical labeling scheme, not just the training labels.
- Because DR grading accuracy is higher for images the model scores as good, quality filtering could make automated diabetic retinopathy screening more reliable in clinical deployment.
- The eight-attribute design gives clinicians a checklist to audit why an image scored as it did, rather than relying on a black-box quality number.
- Continuous 0 to 1 scores allow flexible quality thresholds that can be tuned to the cost of false negatives in a given screening context.
Reading between the lines
- The rubric weights all eight attributes equally by construction; a natural extension the paper does not test is learning attribute weights from downstream diagnostic outcomes, which could change scores without changing the rubric's structure.
- The strong correlation with EyeQ categories suggests the learned score could serve as a soft label for semi-supervised quality assessment on unlabeled clinical archives, but the paper does not demonstrate this.
- A testable prediction follows from the DR-grading results: filtering screening images by a FundaQ-8 quality threshold should reduce false negatives in a real screening population, not just in the EyeQ subset; that remains to be shown.
Signed reviews
Editorial analysis
A structured set of objections, weighed in public.
Referee Report
Summary. The manuscript proposes FundaQ-8, an eight-attribute scoring rubric for fundus image quality, and trains a ResNet18 regression model on 1,800 images labeled with this rubric to predict a continuous 0–1 quality score. The model is evaluated on a held-out test set (MAE 0.0992, R² 0.7734), compared against the EyeQ categorical quality labels (Spearman -0.752, OLS R² 0.653), and used to group images by predicted quality in a diabetic retinopathy grading experiment. The central claims are that FundaQ-8 provides an objective, interpretable, expert-validated quality score and that incorporating it into DR grading improves diagnostic robustness.
Significance. If the claims are established, a continuous, interpretable FIQA score trained from a structured clinical rubric would be a practically useful contribution to fundus image quality assessment, particularly for screening workflows. The paper has notable strengths: the regression evaluation is straightforward and the reported in-distribution errors are plausible; the external EyeQ validation on a large dataset (n=28,792) is a useful sanity check; and the eight-attribute rubric is transparent and clinically motivated. However, the load-bearing evidence for clinical utility is the DR experiment, and that experiment is internally inconsistent and missing a necessary baseline. The objectivity claim is also not supported by any inter-rater reliability data. With corrections, the core regression modeling could be acceptable, but the clinical-validity and DR-robustness claims require substantial additional evidence.
major comments (4)
- [Section V.C, Table V] Table V reports identical values for accuracy, sensitivity, specificity, and F1 within each quality group (0.5464 for Bad, 0.4846 for Medium, 0.7357 for Good). For any real binary or multiclass confusion matrix, these four metrics cannot coincide except in degenerate cases. The prose in the same section reports different values, e.g., Good accuracy 0.7832, sensitivity 0.6108, specificity 0.8136, and F1 0.6258, while Bad sensitivity and F1 are given as 0.4846 and 0.4152. The table and text cannot both be correct, and the DR robustness claim is therefore unverifiable as presented. Please report the full confusion matrices and recompute all metrics consistently.
- [Section V.C and Abstract] The DR experiment compares grading performance across quality groups but does not include a baseline condition without FundaQ-8 filtering or an alternative quality-assessment filter. Consequently, the results, even if corrected, would only demonstrate that higher-quality images are easier to grade, not that 'incorporating FundaQ-8 into deep learning models for diabetic retinopathy grading improves diagnostic robustness' as claimed in the abstract. A proper comparison between DR grading on the full dataset and DR grading after FundaQ-8-based filtering is needed to support the stated conclusion.
- [Section III.B] The claim that FundaQ-8 is 'objective' and 'expert-validated' currently rests on face validity alone. The scoring process 'included iterative reviews to ensure inter-rater reliability,' but no inter-rater reliability statistics (e.g., Cohen's kappa or intraclass correlation) are reported. Additionally, the eight attributes are combined by simple summation and normalization to a 0–1 score, effectively assigning equal weights, with no sensitivity analysis or justification. Because the model is trained and evaluated on this self-defined rubric, the test-set R² largely measures consistency with the rubric rather than independent clinical utility; the external EyeQ correlation provides only indirect support.
- [Section V.C and Section III.E(c)] The DR grading task is simplified to three classes, but the manuscript does not describe how sensitivity, specificity, and F1 are computed for this multiclass setting. Without a defined multiclass averaging scheme, the numerical values cannot be interpreted, and the inconsistency in Table V suggests the computations may be incorrect. Please clarify the evaluation protocol and provide class-wise counts.
minor comments (5)
- [Throughout] There are multiple typos and spacing errors, including 'fundus iamge' (Section III introduction), 'Opthalmologist' (author affiliation), and 'inval uabl e' (Acknowledgment). A careful proofread is needed.
- [Section III.E(c) and Table V] The quality-group boundaries are inconsistently defined: the text defines Good as 'score≥0.8', but Table V writes 'Score > 0.8', and Medium is '0.4<Score<0.8', leaving the boundary values 0.4 and 0.8 undefined. Please specify inclusive/exclusive ranges.
- [Section V.B] The EyeQ dataset is cited as reference [9], but [9] is a survey on fundus image quality assessment; please cite the original EyeQ dataset source (e.g., Fu et al., 'Evaluation of Retinal Image Quality Assessment Networks in Different Color-Spaces' or the appropriate dataset paper).
- [Section V.A and Section VI] The 'clinically acceptable 15% threshold' for MAE is introduced without a citation or definition. Please provide a source or justification for this threshold.
- [Section III.D] The claim of stratified partitioning into training, validation, and test sets should be supported by reporting the score distributions for each split, not only the overall histogram in Fig. 3.
Circularity Check
The DR robustness claim reduces to the definition of the quality score, but the core regression and EyeQ validation are independent.
-
renaming known result
[Abstract; Section V.C (Table V); Section VI (Discussion)]
"The performance of the DR detection model (Table V) was evaluated within each quality group by comparing the predicted DR grades to the ground truth DR grades. ... By filtering out low-quality inputs, FundaQ-8 not only enhances model performance but also improves resource efficiency."
No DR model is trained or evaluated with vs. without FundaQ-8 filtering; the experiment only stratifies EyeQ images by predicted FundaQ-8 score and compares DR metrics across the Bad/Medium/Good strata. Because FundaQ-8 is by definition an image-quality score and it is already known that image quality affects DR gradability, the conclusion that 'incorporating FundaQ-8 improves diagnostic robustness' restates the score's definition plus a known correlation rather than measuring an effect of the framework. The claimed benefit is thus equivalent to the input assumption that the score captures diagnostic usability.
full rationale
The FundaQ-8 regression model is trained and tested on the authors' own eight-attribute rubric; the reported MAE/R² are legitimate held-out predictions of that self-defined target, but they are not independent evidence of clinical validity. The external EyeQ comparison (Spearman -0.752, n=28,792) provides genuine independent grounding for the model's quality ranking, so the central scoring claim is not circular overall. No load-bearing self-citations appear; all cited prior work is external. The main circularity is the DR-robustness claim: it is presented as a demonstrated benefit of FundaQ-8, yet the only experiment stratifies by predicted quality and shows that higher-quality images are easier to grade, which is the definition of the score plus the known image-quality/gradability relationship, not a measured improvement from incorporating the framework. Additionally, Table V is internally inconsistent (all four metrics identical per group, and prose values differ from table values), a correctness risk that should be resolved but is not itself a circularity. Overall: partial circularity in one supporting claim, while the primary quality-scoring model has independent external validation.
Assumptions & free parameters
free parameters (3)
- Quality group thresholds for DR analysis =
Bad <0.4, Medium 0.4-0.8, Good ≥0.8
- Attribute score weighting =
Equal weights (sum /16)
- Clinically acceptable MAE threshold =
15%
assumptions (3)
- ad hoc to paper The FundaQ-8 rubric accurately captures clinically meaningful quality
- domain assumption Expert annotations are reliable ground truth
- domain assumption EyeQ categories serve as a valid external quality benchmark
Cite this review
Pith. "Pith review of FundaQ-8: A Clinically-Inspired Scoring Framework for Automated Fundus Image Quality Assessment." pith.science (2026). https://pith.science/paper/3IHAXVJV
@misc{pith2026250620303,
  author       = {Pith},
  title        = {Pith review of: FundaQ-8: A Clinically-Inspired Scoring Framework for Automated Fundus Image Quality Assessment},
  year         = {2026},
  howpublished = {\url{https://pith.science/paper/3IHAXVJV}},
  note         = {Machine review of arXiv:2506.20303}
}
read the original abstract
Automated fundus image quality assessment (FIQA) remains a challenge due to variations in image acquisition and subjective expert evaluations. We introduce FundaQ-8, a novel expert-validated framework for systematically assessing fundus image quality using eight critical parameters, including field coverage, anatomical visibility, illumination, and image artifacts. Using FundaQ-8 as a structured scoring reference, we develop a ResNet18-based regression model to predict continuous quality scores in the 0 to 1 range. The model is trained on 1800 fundus images from real-world clinical sources and Kaggle datasets, using transfer learning, mean squared error optimization, and standardized preprocessing. Validation against the EyeQ dataset and statistical analyses confirm the framework's reliability and clinical interpretability. Incorporating FundaQ-8 into deep learning models for diabetic retinopathy grading also improves diagnostic robustness, highlighting the value of quality-aware training in real-world screening applications.
Figures


Figures from the paper (2 more)


Reference graph
Works this paper leans on
-
[12]
Automatic fundus image quality assessment on a continuous scale,
R. A. Karlsson, B. A. Jonsson, S. H. Hardarson, O. B. Olafsdotti r , G. H. Halldorsson, and E. Stefansson, “Automatic fundus image quality assessment on a continuous scale,” Computers in Biology and Medicine , vol. 129, p. 104114, Feb. 2021, doi: https://doi.org/10.1016/j.compbiomed.2020.104114
-
[1]
W. L. Wong et al., “Global prevalence of age- related macular degeneration and disease burden projection for 2020 and 2040: a systematic review and meta- analysis,” The Lancet Global Health, vol. 2, no. 2, pp. e106–e116, Feb. 2014,doi: https://doi.org/10.1016/s2214- 109x(13)70145-1
doi:10.1016/s2214- 2020
-
[2]
Factors associated with eye disorders and diseases: A retrospective study,
O. Goktas, “Factors associated with eye disorders and diseases: A retrospective study,” Pakistan Journal of Medical Sciences, vol. 41, no. 1, pp. 176–181, Dec. 2024, doi: https://doi.org/10.12669/pjms.41.1.9728
-
[3]
Retinal Imaging and Image Analysis,
M. D. Abràmoff, M. K. Garvin, and M. Sonka, “Retinal Imaging and Image Analysis,” IEEE Reviews in Biomedical Engineering, vol. 3, pp. 169–208, Dec. 2010, doi: https://doi.org/10.1109/RBME.2010.2084567
-
[4]
Deep image mining for diabetic retinopathy screening,
G. Quellec, K. Charrière, Y. Boudi, B. Cochener, and M. Lamard, “Deep image mining for diabetic retinopathy screening,” Medical Image Analysis, vol. 39, pp. 178–193, Jul. 2017, doi: https://doi.org/10.1016/j.media.2017.04.012
-
[5]
Intermediate Assouad-like dimensions for measures
S. Philip, “The impact of the Health Technology Board for Scotland’s grading model on referrals to ophthalmology services,” British Journal of Ophthalmology, vol. 89, no. 7, pp. 891–896, Jul. 2005, doi: https://doi.org/10.1136/bjo.2004.051334
work page Pith review arXiv 2005
-
[6]
Evaluation of Retinal Image Quality Assessment Networks in Different Color -Spaces,
H. Fu et al., “Evaluation of Retinal Image Quality Assessment Networks in Different Color -Spaces,” Lecture Notes in Computer Science, pp. 48 –56, Jan. 2019, doi: https:/ /doi.org/10.1007/978-3- 030-32239-7_6
doi:10.1007/978-3- 2019
-
[7]
Acquire Precise and Comparable Fundus Image Quality Score: FTHNet and FQS Dataset
Z. Gong et al., “Acquire Precise and Comparable Fundus Image Quality Score: FTHNet and FQS Dataset,” doi: https://doi.org/10.48550/arXiv.2411.12273. unpublished
Show all 15 references
-
[8]
FundusQ -Net: A regression quality assessment deep learning algorithm for fundus images quality grading,
O. Abramovich et al., “FundusQ -Net: A regression quality assessment deep learning algorithm for fundus images quality grading,” Computer Methods and Programs in Biomedicine, vol. 239, pp. 107522–107522, Sep. 2023, doi: https://doi.org/10.1016/j.cmpb.2023.107522
2023
-
[9]
Fundus image quality assessment: survey, challenges, and future scope,
A. Raj, A. K. Tiwari, and M. G. Martini, “Fundus image quality assessment: survey, challenges, and future scope,” IET Image Processing, vol. 13, no. 8, pp. 1211–1224, Jun. 2019, doi: https://doi.org/10.1049/iet -ipr.2018.6212
2019
-
[10]
EfficientNetV2 Based Ensemble Model for Quality Estimation of Diabetic Retinopathy Images from DeepDRiD,
S. Tummala, V. S. G. Thadikemalla, S. Kadry, M. Sharaf, and H. T. Rauf, “EfficientNetV2 Based Ensemble Model for Quality Estimation of Diabetic Retinopathy Images from DeepDRiD,” Diagnostics, vol. 13, no. 4, p. 622, Fe b. 2023, doi: https://doi.org/10.3390/diagnostics13040622
2023 doi
-
[11]
Human Visual System-Based Fundus Image Quality Assessment of Portable Fundus Camera Photographs,
S. Wang, K. Jin, H. Lu, C. Cheng, J. Ye, and D. Qian, “Human Visual System-Based Fundus Image Quality Assessment of Portable Fundus Camera Photographs,” IEEE Transactions on Medical Imaging, vol. 35, no. 4, pp. 1046–1055, Apr. 2016, doi: https://doi.org/10.1109/tmi.2015.2506902
2016
-
[13]
Validating Retinal Fundus Image Analysis Algorithms: Issues and a Proposal,
E. Trucco et al., “Validating Retinal Fundus Image Analysis Algorithms: Issues and a Proposal,” Investigative Ophthalmology & Visual Science, vol. 54, no. 5, pp. 3546–3559, May 2013, doi: https://doi.or g/10.1167/iovs.12- 10347
2013 doi
-
[14]
Deep Learning in Automatic Diabetic Retinopathy Detection and Grading Systems: A Comprehensive Survey and Comparison of Methods,
I. Y. Abushawish, S. Modak, E. Abdel-Raheem, S. A. Mahmoud a nd A. Jaafar Hussain, “Deep Learning in Automatic Diabetic Retinopathy Detection and Grading Systems: A Comprehensive Survey and Comparison of Methods,” IEEE Access, vol. 12, no. 2169–3536, pp. 84785–84802, Jun. 2024...
2024
-
[15]
A Catalog of Public Glauco ma Datasets for Machine Learning Applications,
R. Kiefer, M. Abid, J. Steen, Mahsa Raeisi Ardali, and Ehsan Amjadian, “A Catalog of Public Glauco ma Datasets for Machine Learning Applications,” May 2023, doi: https://doi.org/10.1145/3603765.3603779
2023
Reviewed August 6, 2026 · model on record in the stance chip above.
Discussion (0). Continue with ORCID to comment.