Impact of Cosmic Filaments on Galaxy Morphological Evolution and Predictions of Early Cosmic Web Structure for Roman
Pith reviewed 2026-05-18 13:26 UTC · model grok-4.3
The pith
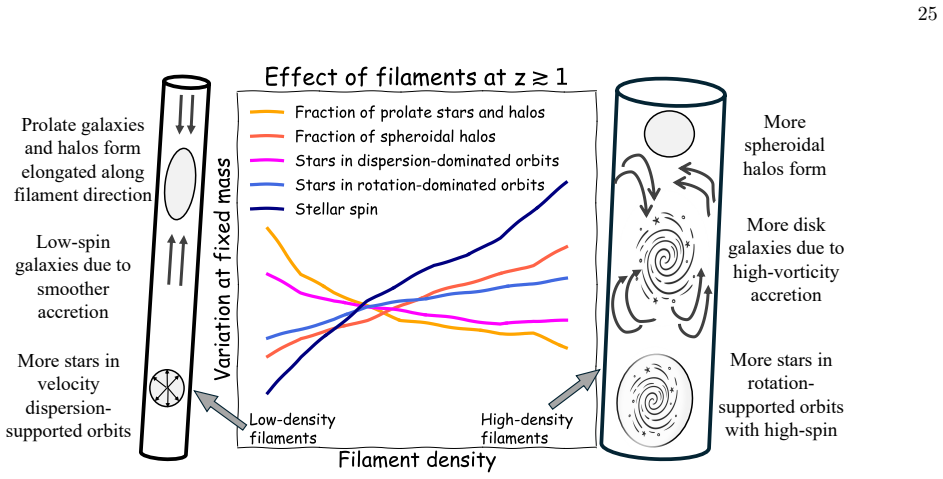
Higher-density cosmic filaments favor extended rotationally supported disk galaxies while lower-density filaments more often host smaller dispersion-supported systems.
A machine-rendered reading of the paper's core claim, the machinery that carries it, and where it could break.
Core claim
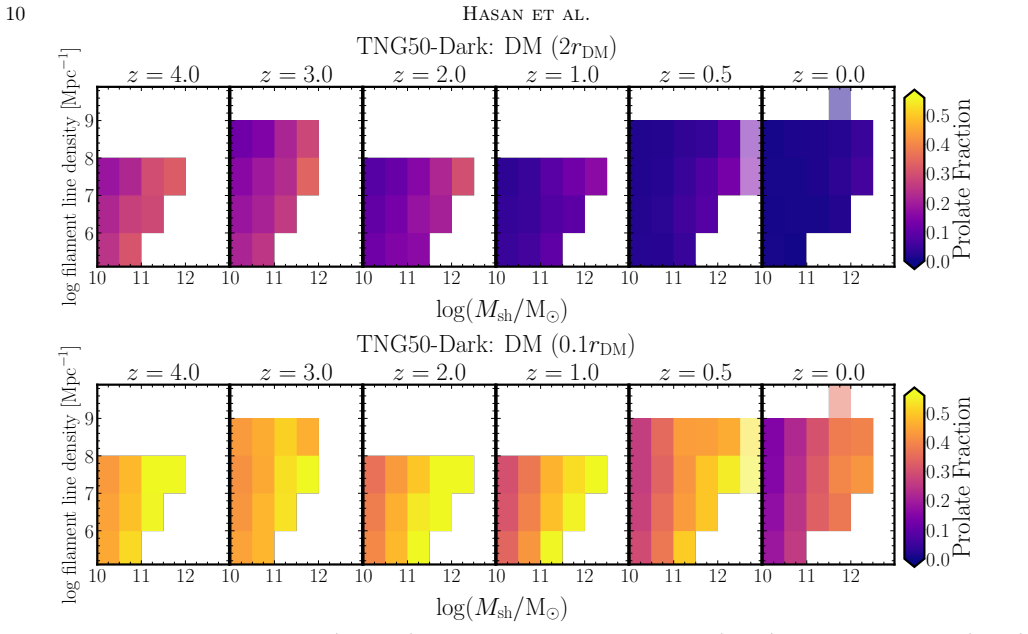
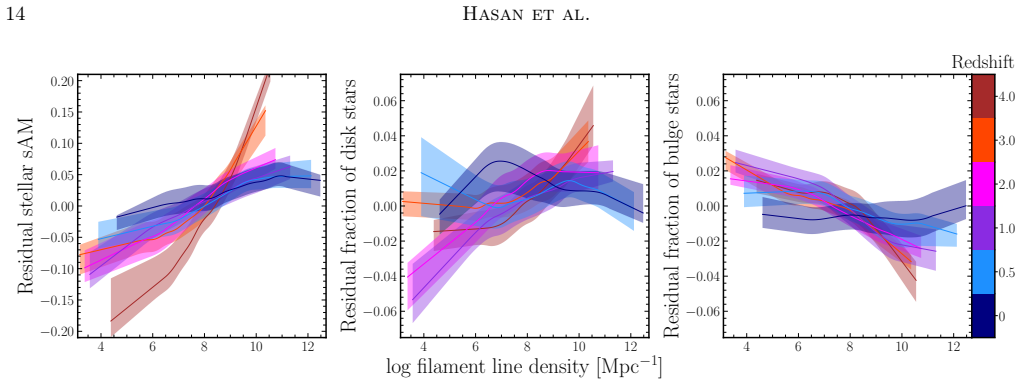
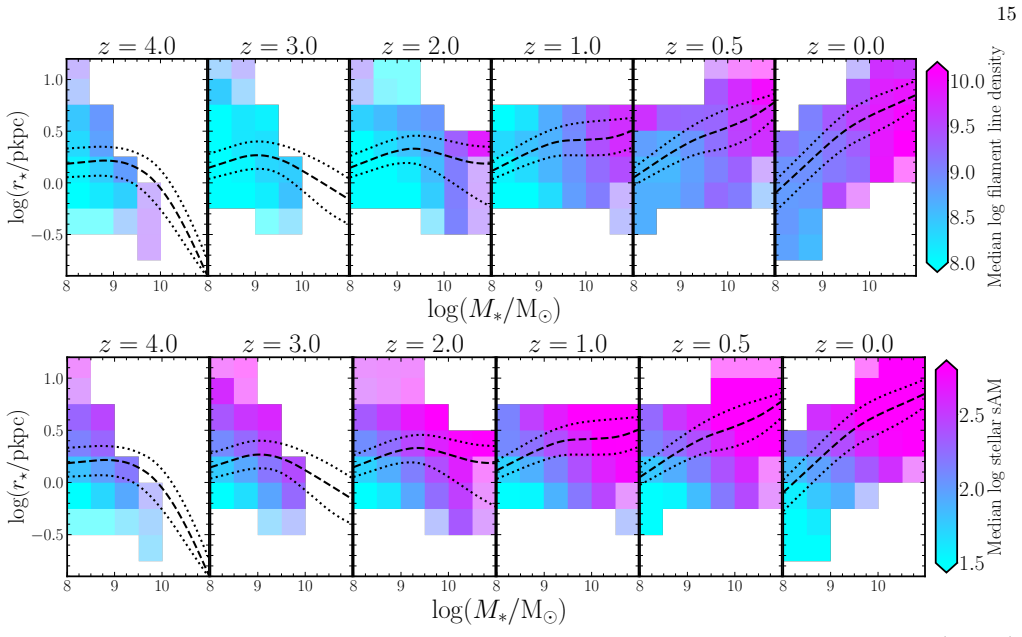
Using the IllustrisTNG50 and TNG100 simulations, dark matter halos start mostly prolate and aligned with nearby filaments, with prolate shapes more common at lower stellar masses, higher redshifts, and in lower-density filaments. Higher-density filaments preferentially contain extended rotationally supported disks, while lower-density filaments host smaller dispersion-supported systems. Mock catalogs show that the spectroscopic depth planned for Roman's High-Latitude Wide-Area Survey produces a highly incomplete sample that does not accurately trace the z=1 cosmic web, although the HLWAS Deep field can still locate most overdensities.
What carries the argument
Cosmic web reconstruction via the Monte Carlo Physarum Machine density estimator and DisPerSE structure finder, which classifies filaments by local density and correlates those densities with galaxy shape (prolate versus oblate) and kinematic support (rotational versus dispersion).
If this is right
- The fraction of prolate galaxies and halos increases toward lower stellar mass, higher redshift, and lower-density filaments.
- Oblate and spheroidal galaxies show weaker dependence on filament density, while spheroidal halos prefer higher-density filaments.
- Prolate galaxies retain strong shape alignment with their outer halos to later times.
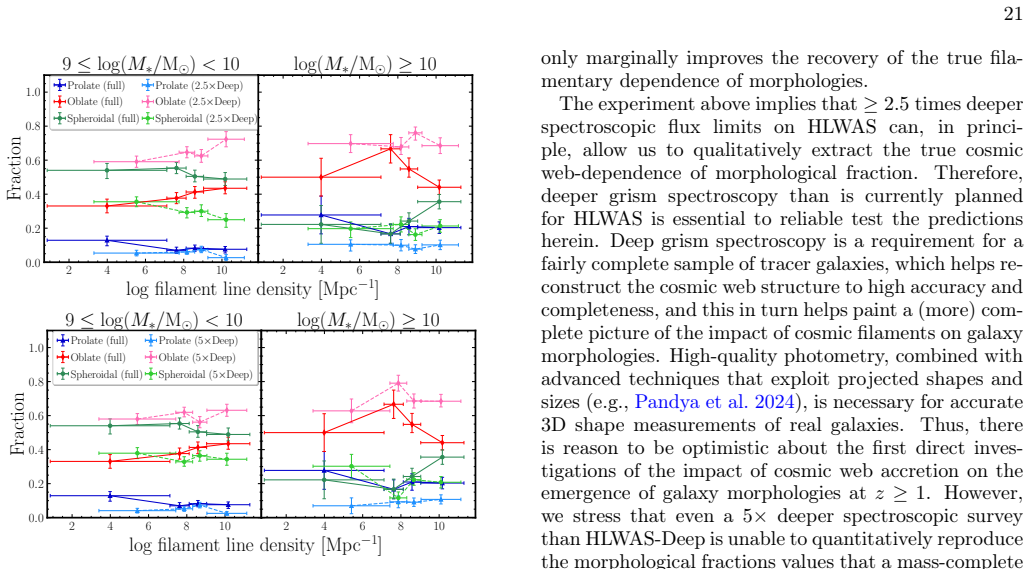
- The planned HLWAS spectroscopic depth yields an incomplete galaxy sample that does not accurately trace the z=1 cosmic web.
- A survey at least 2.5 times deeper over a few square degrees would enable proper filament reconstruction and reveal the filament-morphology relations.
Where Pith is reading between the lines
- If the simulated trends hold, targeted deeper spectroscopy around the overdensities already detectable in the HLWAS Deep field could efficiently map early filamentary structure without a full wide-area deep survey.
- The morphology-filament link implies that large-scale density influences processes such as gas accretion or merger rates that set galaxy rotation and size.
- Comparing these trends across different simulation suites could test whether the reported relations depend on the specific galaxy formation physics.
- Future wide-field spectroscopic surveys at similar redshifts could use the simulation results to optimize depth and area choices for cosmic web studies.
Load-bearing premise
The IllustrisTNG simulations faithfully reproduce the real relationships between filament environment and galaxy morphology at redshifts up to z=4.
What would settle it
High-redshift observations that show no trend or the opposite trend between filament density and the fraction of rotationally supported disk galaxies.
Figures


read the original abstract
We leverage the IllustrisTNG cosmological simulations to test how the large-scale cosmic web shapes galaxy morphology and to forecast the early cosmic web structure that the Nancy Grace Roman Space Telescope will reveal. In the hydrodynamic TNG50 and $N$-body TNG50-Dark runs, we reconstruct the cosmic web at redshifts $z=0$, 0.5, 1, 2, 3, and 4 with the Monte Carlo Physarum Machine density estimator and the DisPerSE structure identification framework. We confirm that dark matter halos start out predominantly prolate (elongated) and their shapes are aligned with their nearest filaments; prolate galaxies retain strong shape-alignment with their outer halos to later times. The fraction of prolate galaxies and halos increases toward lower stellar mass, higher redshift, and lower-density filaments. Oblate and spheroidal galaxies show weaker trends with filament density, but spheroidal halos preferentially reside in higher-density filaments. We also find that higher-density filaments favor extended rotationally-supported disks, whereas lower-density filaments more often host smaller dispersion-supported systems. Then, generating mock galaxy samples from TNG100 and TNG50, we predict the early cosmic web accessible to Roman. We find that the spectroscopic emission-line depth planned for the High-Latitude Wide-Area Survey (HLWAS) yields a highly incomplete galaxy sample that does not accurately trace the $z=1$ cosmic web. A survey $\geq2.5\times$ deeper over a few square degrees would enable a proper reconstruction and reveal qualitatively correct filament-galaxy morphology relationships. Nevertheless, the planned HLWAS Deep field should still identify most galaxy overdensities; targeted deeper spectroscopy of these regions would efficiently and adequately map the early filamentary structure.
Editorial analysis
A structured set of objections, weighed in public.
Referee Report
Summary. The paper uses IllustrisTNG50 and TNG100 simulations (hydrodynamic and dark-matter-only) to reconstruct the cosmic web via the Monte Carlo Physarum Machine and DisPerSE at z=0 to 4. It reports that prolate shapes dominate at low mass/high z/low-density filaments, with shape alignments persisting, and that higher-density filaments preferentially host extended rotationally supported disks while lower-density filaments host smaller dispersion-supported systems. Mock catalogs are then used to forecast that the Roman HLWAS spectroscopic depth produces an incomplete z=1 galaxy sample that fails to trace the cosmic web, recommending a survey at least 2.5 times deeper over limited area.
Significance. If the TNG-derived morphology-filament trends are robust, the work supplies concrete guidance for Roman survey design and highlights the value of deeper targeted spectroscopy on overdensities. The consistent application of the same web finder across redshifts and simulation types, plus the use of both TNG50 and TNG100 volumes, constitutes a strength for internal reproducibility of the reported trends.
major comments (2)
- [§4] §4 (morphology-filament results): The reported preference for rotationally-supported disks in high-density filaments versus dispersion-supported systems in low-density filaments is derived entirely from TNG50/TNG100 without any quantitative comparison to observed kinematic fractions (V/σ) or morphological type fractions versus local density at z=1–3. This relation is load-bearing for both the environmental-evolution claim and the subsequent Roman forecast.
- [§5] §5 (Roman predictions): The incompleteness forecast for HLWAS is obtained by passing TNG mocks through the identical web-reconstruction pipeline used to calibrate the morphology-filament relations; any systematic offset between TNG and reality in the environmental dependence of Sérsic index or V/σ would therefore propagate directly into the required survey depth and the conclusion that HLWAS fails to trace the z=1 web.
minor comments (2)
- [§5.1] Figure 8 caption and §5.1 text: the factor “≥2.5× deeper” is stated without an explicit derivation from the completeness curves; adding the precise scaling calculation would improve clarity.
- Notation: the distinction between “prolate galaxies” and “prolate halos” is used interchangeably in several paragraphs; consistent subscripting (e.g., galaxy vs. halo) would reduce ambiguity.
Simulated Author's Rebuttal
We thank the referee for the constructive and detailed report. The comments correctly identify that our morphology-filament relations and Roman forecasts rest on simulation-derived trends without direct observational calibration at z=1–3. We address each point below, have revised the manuscript to add explicit caveats and robustness tests, and clarify the predictive scope of the work.
read point-by-point responses
-
Referee: [§4] §4 (morphology-filament results): The reported preference for rotationally-supported disks in high-density filaments versus dispersion-supported systems in low-density filaments is derived entirely from TNG50/TNG100 without any quantitative comparison to observed kinematic fractions (V/σ) or morphological type fractions versus local density at z=1–3. This relation is load-bearing for both the environmental-evolution claim and the subsequent Roman forecast.
Authors: We agree that a quantitative comparison to observed V/σ or morphological fractions versus local density at z=1–3 would strengthen the interpretation. Such data remain sparse at these redshifts, particularly with sufficient sample size and environmental coverage. Our analysis is therefore presented as a set of robust, internally consistent predictions from the IllustrisTNG suite, which has been validated against lower-redshift observations. We have added a dedicated paragraph in Section 4 that (i) compares our z=0 trends to existing SDSS and MaNGA results on morphology-density relations, (ii) discusses the expected evolution of these trends to z=1–3, and (iii) explicitly states that the Roman HLWAS and future JWST programs will provide the first direct tests. This revision makes the predictive nature of the load-bearing relation transparent while preserving the simulation-based conclusions. revision: yes
-
Referee: [§5] §5 (Roman predictions): The incompleteness forecast for HLWAS is obtained by passing TNG mocks through the identical web-reconstruction pipeline used to calibrate the morphology-filament relations; any systematic offset between TNG and reality in the environmental dependence of Sérsic index or V/σ would therefore propagate directly into the required survey depth and the conclusion that HLWAS fails to trace the z=1 web.
Authors: We acknowledge the possibility of systematic propagation. To quantify its impact we have performed two additional tests: (1) varying the assumed morphology-density slope by ±30% around the TNG value while keeping the same galaxy number density, and (2) repeating the web reconstruction after perturbing the Sérsic-index distribution to mimic plausible observational offsets. In both cases the qualitative conclusion—that the nominal HLWAS depth yields an incomplete z=1 sample—remains unchanged; only the precise numerical factor (currently 2.5×) shifts by at most 0.4×. We have inserted these sensitivity results into Section 5 together with an explicit statement that the recommended depth increase is conservative with respect to moderate systematics. The primary driver of incompleteness is the emission-line flux limit and resulting galaxy number density, which is independent of the detailed morphology-environment slope to first order. revision: partial
Circularity Check
No significant circularity; simulation forward-modeling is self-contained
full rationale
The paper derives filament-galaxy morphology relations by applying the Monte Carlo Physarum Machine density estimator and DisPerSE directly to the TNG50 and TNG100 simulation outputs at multiple redshifts, producing statistics on prolate/oblate fractions, alignments, and disk vs. dispersion support as functions of filament density. The Roman HLWAS forecast then generates mock catalogs from the same simulations, applies the planned emission-line selection function, and re-runs the identical reconstruction pipeline to quantify incompleteness and web-tracing fidelity. This is standard forward modeling within a fixed simulation framework rather than any parameter fit to a subset of data followed by a tautological prediction, self-definition of quantities, or load-bearing self-citation chain. No equations or steps reduce the reported trends or survey conclusions to their inputs by construction; the outputs remain independent consequences of the hydrodynamic model and the chosen reconstruction algorithms.
Axiom & Free-Parameter Ledger
axioms (1)
- domain assumption IllustrisTNG simulations accurately model galaxy formation and cosmic web evolution
Lean theorems connected to this paper
-
IndisputableMonolith/Cost/FunctionalEquation.leanwashburn_uniqueness_aczel unclear?
unclearRelation between the paper passage and the cited Recognition theorem.
We leverage the IllustrisTNG cosmological simulations to test how the large-scale cosmic web shapes galaxy morphology... higher-density filaments favor extended rotationally-supported disks, whereas lower-density filaments more often host smaller dispersion-supported systems.
-
IndisputableMonolith/Foundation/DimensionForcing.leanreality_from_one_distinction unclear?
unclearRelation between the paper passage and the cited Recognition theorem.
We reconstruct the cosmic web at redshifts z=0, 0.5, 1, 2, 3, and 4 with the Monte Carlo Physarum Machine density estimator and the DisPerSE structure identification framework.
What do these tags mean?
- matches
- The paper's claim is directly supported by a theorem in the formal canon.
- supports
- The theorem supports part of the paper's argument, but the paper may add assumptions or extra steps.
- extends
- The paper goes beyond the formal theorem; the theorem is a base layer rather than the whole result.
- uses
- The paper appears to rely on the theorem as machinery.
- contradicts
- The paper's claim conflicts with a theorem or certificate in the canon.
- unclear
- Pith found a possible connection, but the passage is too broad, indirect, or ambiguous to say the theorem truly supports the claim.
Forward citations
Cited by 1 Pith paper
-
Euclid preparation. 3D reconstruction of the cosmic web with simulated Euclid Deep spectroscopic samples
Simulations of Euclid Deep Fields show that cosmic web structures can be reconstructed from H-alpha galaxies with biases from redshift distortions and selection effects that can be partially mitigated, allowing recove...
Reference graph
Works this paper leans on
-
[1]
Abadi, M. G., Navarro, J. F., Steinmetz, M., & Eke, V. R. 2003, ApJ, 597, 21
work page 2003
-
[2]
Allgood, B., Flores, R. A., Primack, J. R., et al. 2006, MNRAS, 367, 1781
work page 2006
-
[3]
Alpaslan, M., Robotham, A. S. G., Obreschkow, D., et al. 2014, MNRAS, 440, L106
work page 2014
- [4]
-
[5]
Bahe, Y. M., & Jablonka, P. 2025, arXiv e-prints, arXiv:2502.06484
- [6]
-
[7]
Barsanti, S., Colless, M., Welker, C., et al. 2022, MNRAS, 516, 3569
work page 2022
-
[8]
Battisti, A. J., Calzetti, D., & Chary, R. R. 2016, ApJ, 818, 13
work page 2016
-
[9]
Battisti, A. J., Cunha, E. d., Shivaei, I., & Calzetti, D. 2020, ApJ, 888, 108
work page 2020
-
[10]
Behroozi, P., Wechsler, R. H., Hearin, A. P., & Conroy, C. 2019, MNRAS, 488, 3143 Blue Bird, J., Davis, J., Luber, N., et al. 2020, MNRAS, 492, 153
work page 2019
-
[11]
Blumenthal, G. R., Faber, S. M., Primack, J. R., & Rees, M. J. 1984, Nature, 311, 517
work page 1984
- [12]
-
[13]
Brammer, G. B., van Dokkum, P. G., Franx, M., et al. 2012, ApJS, 200, 13
work page 2012
-
[14]
N., Elek, O., Tejos, N., et al
Burchett, J. N., Elek, O., Tejos, N., et al. 2020, ApJL, 891, L35
work page 2020
-
[15]
Busch, P., & White, S. D. M. 2020, MNRAS, 493, 5693 32Hasan et al
work page 2020
- [16]
- [17]
- [18]
-
[19]
Calzetti, D., Kinney, A. L., & Storchi-Bergmann, T. 1994, ApJ, 429, 582
work page 1994
- [20]
- [21]
- [22]
-
[23]
K., Kereš, D., Oñorbe, J., et al
Chan, T. K., Kereš, D., Oñorbe, J., et al. 2015, MNRAS, 454, 2981
work page 2015
-
[24]
Charlot, S., & Fall, S. M. 2000, ApJ, 539, 718
work page 2000
- [25]
-
[26]
Codis, S., Pichon, C., Devriendt, J., et al. 2012, MNRAS, 427, 3320
work page 2012
- [27]
-
[28]
Cohn, J. D. 2022, MNRAS, 513, 624
work page 2022
- [29]
- [30]
-
[31]
2015, MNRAS, 449, 2087 De Almeida, A
Primack, J. 2015, MNRAS, 449, 2087 De Almeida, A. P., Mamon, G. A., Dekel, A., & Lima Neto, G. B. 2024, A&A, 687, A131
work page 2015
-
[32]
Data Release 1 of the Dark Energy Spectroscopic Instrument
Dekel, A., & Burkert, A. 2014, MNRAS, 438, 1870 DESI Collaboration, Adame, A. G., Aguilar, J., et al. 2024, AJ, 168, 58 DESI Collaboration, Abdul-Karim, M., Adame, A. G., et al. 2025, arXiv e-prints, arXiv:2503.14745
work page internal anchor Pith review Pith/arXiv arXiv 2014
-
[33]
Dolag, K., Borgani, S., Murante, G., & Springel, V. 2009, MNRAS, 399, 497
work page 2009
-
[34]
Donnari, M., Pillepich, A., Nelson, D., et al. 2019, MNRAS, 485, 4817 Doré, O., Werner, M. W., Ashby, M., et al. 2016, arXiv e-prints, arXiv:1606.07039
work page internal anchor Pith review Pith/arXiv arXiv 2019
- [35]
-
[36]
Dubois, Y., Pichon, C., Welker, C., et al. 2014, MNRAS, 444, 1453
work page 2014
-
[37]
Dubois, Y., Beckmann, R., Bournaud, F., et al. 2021, A&A, 651, A109
work page 2021
-
[38]
Durbin, M. J., Beaton, R. L., Monson, A. J., & Swidler, B. 2025, arXiv e-prints, arXiv:2506.13627
-
[39]
Dalcanton, J. J. 2023, AJ, 166, 236
work page 2023
-
[40]
Elek, O., Burchett, J. N., Prochaska, J. X., & Forbes, A. G. 2021, IEEE Transactions on Visualization and Computer Graphics, 27, 806-816 —. 2022, Artificial Life, 28
work page 2021
-
[41]
Schaffer, M. A. 2005, ApJ, 631, 85 Euclid Collaboration, Laigle, C., Gouin, C., et al. 2025a, arXiv e-prints, arXiv:2503.15333 Euclid Collaboration, Mellier, Y., Abdurro’uf, et al. 2025b, A&A, 697, A1 Euclid Collaboration, Malavasi, N., Sarron, F., et al. 2025c, arXiv e-prints, arXiv:2508.15915
- [42]
- [43]
-
[44]
2025, arXiv e-prints, arXiv:2507.08925
Feldmann, R., & Bieri, R. 2025, arXiv e-prints, arXiv:2507.08925
-
[45]
2023, MNRAS, 522, 3831 Förster Schreiber, N
Feldmann, R., Quataert, E., Faucher-Giguère, C.-A., et al. 2023, MNRAS, 522, 3831 Förster Schreiber, N. M., & Wuyts, S. 2020, ARA&A, 58, 661 Galárraga-Espinosa, D., Cadiou, C., Gouin, C., et al. 2024, A&A, 684, A63 Ganeshaiah Veena, P., Cautun, M., Tempel, E., van de
work page 2023
-
[46]
Weygaert, R., & Frenk, C. S. 2019, MNRAS, 487, 1607 Ganeshaiah Veena, P., Cautun, M., van de Weygaert, R.,
work page 2019
-
[47]
Tempel, E., & Frenk, C. S. 2021, MNRAS, 503, 2280 Ganeshaiah Veena, P., Cautun, M., van de Weygaert, R., et al. 2018, MNRAS, 481, 414
work page 2021
-
[48]
Genel, S., Fall, S. M., Hernquist, L., et al. 2015, ApJL, 804, L40
work page 2015
-
[49]
Genel, S., Nelson, D., Pillepich, A., et al. 2018, MNRAS, 474, 3976
work page 2018
-
[50]
Gordon, K. D., Clayton, G. C., Misselt, K. A., Landolt, A. U., & Wolff, M. J. 2003, ApJ, 594, 279
work page 2003
-
[51]
Greene, J., Bezanson, R., Ouchi, M., Silverman, J., & the PFS Galaxy Evolution Working Group. 2022, arXiv e-prints, arXiv:2206.14908
-
[52]
Grogin, N. A., Kocevski, D. D., Faber, S. M., et al. 2011, ApJS, 197, 35
work page 2011
-
[53]
Guzzo, L., Scodeggio, M., Garilli, B., et al. 2014, A&A, 566, A108
work page 2014
-
[54]
Hahn, C., Wilson, M. J., Ruiz-Macias, O., et al. 2023, AJ, 165, 253
work page 2023
-
[55]
Hahn, O., Carollo, C. M., Porciani, C., & Dekel, A. 2007, MNRAS, 381, 41
work page 2007
-
[56]
Hasan, F., Burchett, J. N., Hellinger, D., et al. 2024, ApJ, 970, 177 33
work page 2024
- [57]
- [58]
-
[59]
Kartaltepe, J. S., Rose, C., Vanderhoof, B. N., et al. 2023, ApJL, 946, L15
work page 2023
-
[60]
Kauffmann, G., White, S. D. M., Heckman, T. M., et al. 2004, MNRAS, 353, 713
work page 2004
- [61]
-
[62]
Kirkby, D., Robitaille, T., Weaver, B. A., et al. 2024, desihub/speclite: Bug fix release: General clean- up prior to refactoring package infrastructure, v0.20, Zenodo. https://doi.org/10.5281/zenodo.13225530
-
[63]
Klypin, A., Yepes, G., Gottlöber, S., Prada, F., & Heß, S. 2016, MNRAS, 457, 4340
work page 2016
-
[64]
Koekemoer, A. M., Faber, S. M., Ferguson, H. C., et al. 2011, ApJS, 197, 36
work page 2011
- [65]
-
[66]
Kraljic, K., Duckworth, C., Tojeiro, R., et al. 2021, MNRAS, 504, 4626
work page 2021
-
[67]
Kravtsov, A. V. 2013, ApJL, 764, L31
work page 2013
- [68]
- [69]
- [70]
- [71]
-
[72]
Lagos, C. d. P., Theuns, T., Stevens, A. R. H., et al. 2017, MNRAS, 464, 3850
work page 2017
-
[73]
Laigle, C., Pichon, C., Codis, S., et al. 2015, MNRAS, 446, 2744
work page 2015
-
[74]
Laigle, C., McCracken, H. J., Ilbert, O., et al. 2016, ApJS, 224, 24
work page 2016
-
[75]
Lapiner, S., Dekel, A., Freundlich, J., et al. 2023, MNRAS, 522, 4515
work page 2023
- [76]
-
[77]
2018, MNRAS, 473, 1489 López, P., Cautun, M., Paz, D., Merchán, M., & van de
Li, H., Mao, S., Emsellem, E., et al. 2018, MNRAS, 473, 1489 López, P., Cautun, M., Paz, D., Merchán, M., & van de
work page 2018
-
[78]
2021, MNRAS, 502, 5528 López, P., Merchán, M
Weygaert, R. 2021, MNRAS, 502, 5528 López, P., Merchán, M. E., & Paz, D. J. 2019, MNRAS, 485, 5244
work page 2021
-
[79]
Lu, Y. S., Mandelker, N., Oh, S. P., et al. 2024, MNRAS, 527, 11256
work page 2024
-
[80]
Luber, N. M., Hasan, F., van Gorkom, J. H., et al. 2025, ApJ, 985, 214
work page 2025
discussion (0)
Sign in with ORCID, Apple, or X to comment. Anyone can read and Pith papers without signing in.