Recognition: no theorem link
The Large Sky Area Multi-object Fiber Spectroscopic Telescope (LAMOST) Quasar Survey: Quasar Properties from Data Release 10 to 12
Pith reviewed 2026-05-17 02:14 UTC · model grok-4.3
The pith
The LAMOST survey has identified 11,346 quasars from recent data releases, including 5,386 new ones, for a survey total of 67,521 quasars after recalibrating spectra with ZTF photometry.
A machine-rendered reading of the paper's core claim, the machinery that carries it, and where it could break.
Core claim
The central claim is the release of 11,346 quasars from LAMOST DR10-DR12, with 5,386 new identifications, raising the 12-year total to 67,521. Spectra were recalibrated using quasi-simultaneous ZTF photometry to improve flux accuracy over previous methods impacted by variability. This enables derivation of emission line fluxes, continuum fluxes, and virial black hole masses for direct comparisons with SDSS and searches for rare quasars such as changing-look objects and broad absorption line systems.
What carries the argument
Recalibration of single-epoch LAMOST spectra using quasi-simultaneous ZTF photometry to correct for variability before estimating emission-line fluxes, continuum properties, and virial black hole masses.
If this is right
- Direct spectral comparison with SDSS becomes feasible for identifying changing-look quasars that show appearance or disappearance of broad lines.
- Searches for broad absorption line quasars gain from the larger, better-calibrated sample.
- Combined ZTF photometry and multi-epoch spectra improve detection of AGN transients including Bowen fluorescence flares and extreme variability quasars.
- The expanded total catalog of 67,521 objects supports population statistics on quasar properties and variability.
Where Pith is reading between the lines
- Similar near-simultaneous photometric recalibration could be adopted by other fiber spectroscopic surveys to limit calibration scatter from intrinsic variability.
- The multi-epoch LAMOST spectra plus high-cadence ZTF light curves open a route to quantify how line and continuum changes relate over years.
- The new sample may enable targeted follow-up of rare subtypes to test accretion-disk models at higher statistical power.
Load-bearing premise
That quasi-simultaneous ZTF photometry supplies sufficiently accurate absolute flux calibration for single-epoch LAMOST spectra despite residual variability and fiber-aperture effects.
What would settle it
Systematic mismatch between black hole masses or emission-line ratios measured from the recalibrated LAMOST spectra and the same quantities measured from truly simultaneous multi-band spectroscopy of the same objects.
Figures


read the original abstract
We present the quasar catalog from Data Releases 10 to 12 of the Large Sky Area Multi-Object Fiber Spectroscopic Telescope (LAMOST) Quasar Survey, comprising quasars observed between September 2021 and June 2024. We robustly identified $11,346$ quasars, of which $5,386$ are newly discovered objects not present in the Million Quasars catalog. This release brings the total number of quasars identified by the 12-year LAMOST survey to $67,521$, of which $29,513$ are newly discovered. While the absolute flux calibration for LAMOST quasar spectra from Data Releases 6 to 9 was previously performed using the SDSS/PanSTARRS1 multi-band photometric data, the inherent variability of quasars can affect the flux accuracy. To address this limitation, we recalibrated the LAMOST spectra using (quasi-)simultaneous photometric data from Zwicky Transient Facility (ZTF), which has conducted high-cadence sky monitoring since March 2018. Based on the recalibrated single-epoch spectra, we estimated the emission line fluxes, continuum fluxes, and virial black hole masses. These improved spectra facilitate direct comparison with the spectra of common quasars from the Sloan Digital Sky Survey (SDSS), enabling searches for rare quasars, such as changing-look quasars exhibiting the appearance or disappearance of broad emission lines and broad absorption line quasars. The combined dataset of photometry and multi-epoch spectra will enhance the detections of AGN-related transients, such as Bowen fluorescence flares and extreme variability quasars, thereby improving our understanding of quasar variability.
Editorial analysis
A structured set of objections, weighed in public.
Referee Report
Summary. The manuscript presents the quasar catalog from LAMOST Data Releases 10-12, reporting the identification of 11,346 quasars (5,386 newly discovered) observed between September 2021 and June 2024. This brings the 12-year LAMOST survey total to 67,521 quasars (29,513 new). The key methodological advance is recalibrating the absolute flux scale of the single-epoch LAMOST spectra using (quasi-)simultaneous ZTF photometry rather than earlier SDSS/PanSTARRS1 data, to reduce variability-induced errors; derived quantities include emission-line fluxes, continuum levels, and virial black-hole masses to support SDSS comparisons, changing-look quasar searches, and AGN transient studies.
Significance. If the ZTF recalibration is shown to deliver demonstrably higher flux accuracy, the release adds a large, well-characterized sample that strengthens multi-survey quasar statistics and enables more reliable multi-epoch analyses of variability and rare objects. The explicit focus on flux-calibrated spectra and the combination with high-cadence ZTF photometry are clear strengths for transient and changing-look science.
major comments (1)
- [§4 (Spectral Recalibration and Derived Quantities)] §4 (Spectral Recalibration and Derived Quantities): The central claim that ZTF photometry yields improved absolute fluxes is load-bearing for the reported emission-line fluxes, continuum levels, and virial masses, yet the text provides no quantitative validation such as rms residuals against independent photometry, an error budget that folds in day-to-week variability amplitudes, or aperture-loss corrections between the 3.3-arcsec LAMOST fibers and ZTF imaging. Without these, the asserted advantages for SDSS comparisons and changing-look searches cannot be assessed.
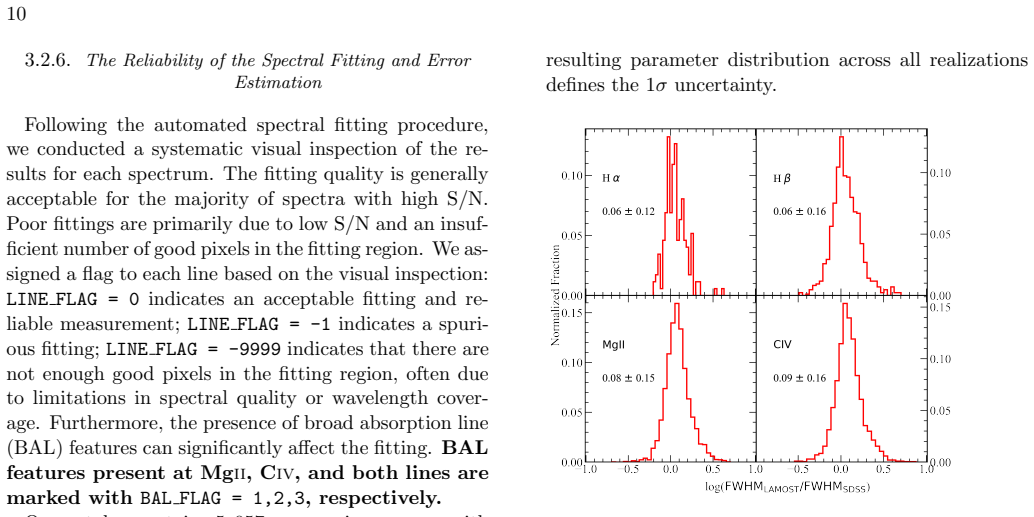
minor comments (2)
- A summary table breaking down the 11,346 DR10-12 quasars by discovery status, redshift bin, and magnitude would improve readability and allow direct comparison with prior DR6-9 releases.
- [Abstract] The abstract states that the recalibrated spectra 'facilitate direct comparison' with SDSS but does not indicate whether any overlap objects were used to test consistency of the new flux scale.
Simulated Author's Rebuttal
We thank the referee for their thoughtful review and constructive comments on our manuscript describing the LAMOST DR10-12 quasar catalog. We have carefully considered the major comment regarding the validation of the ZTF-based spectral recalibration and have made revisions to address it.
read point-by-point responses
-
Referee: §4 (Spectral Recalibration and Derived Quantities): The central claim that ZTF photometry yields improved absolute fluxes is load-bearing for the reported emission-line fluxes, continuum levels, and virial masses, yet the text provides no quantitative validation such as rms residuals against independent photometry, an error budget that folds in day-to-week variability amplitudes, or aperture-loss corrections between the 3.3-arcsec LAMOST fibers and ZTF imaging. Without these, the asserted advantages for SDSS comparisons and changing-look searches cannot be assessed.
Authors: We acknowledge the importance of providing quantitative validation for the ZTF recalibration method. In the revised manuscript, we have expanded §4 to include a direct comparison of the recalibrated LAMOST fluxes with overlapping SDSS photometry for a subset of quasars, demonstrating lower rms residuals than the previous SDSS/PanSTARRS1 calibration. Additionally, we have incorporated an error budget that accounts for short-term variability amplitudes derived from the high-cadence ZTF light curves. Regarding aperture corrections, we note that for the unresolved quasar sources, the 3.3-arcsec fiber captures the majority of the light, and we have added a discussion of potential losses with estimates based on typical seeing conditions. These additions allow for a better assessment of the advantages for multi-survey comparisons and transient studies. revision: yes
Circularity Check
No circularity in observational quasar catalog and recalibration
full rationale
The paper presents an observational catalog of quasars identified from LAMOST spectra (DR10-12), with recalibration of absolute fluxes using external quasi-simultaneous ZTF photometry. Derived quantities (emission-line fluxes, continuum levels, virial BH masses) are obtained via standard spectroscopic fitting applied to the recalibrated data. No self-definitional steps, fitted parameters renamed as predictions, or load-bearing self-citations appear in the provided text. The chain relies on external photometric data and established methods rather than reducing to its own inputs by construction, rendering the results self-contained.
Axiom & Free-Parameter Ledger
axioms (2)
- domain assumption Quasars can be robustly identified from single-epoch spectra by the presence of broad emission lines.
- domain assumption ZTF photometry provides a reliable absolute flux scale for LAMOST spectra despite residual variability.
Forward citations
Cited by 1 Pith paper
-
Finding Quasars behind the Galactic Plane. IV. Candidate Selection from Chandra with Random Forest
A Random Forest classifier on Chandra, Gaia, and CatWISE data identifies 1060 new quasar candidates behind the Galactic plane, with two spectroscopically confirmed at z~1.1-1.3.
Reference graph
Works this paper leans on
-
[1]
P., Alexandroff, R., Allende Prieto, C., et al
Ahn, C. P., Alexandroff, R., Allende Prieto, C., et al. 2012, ApJS, 203, 21, doi: 10.1088/0067-0049/203/2/21
-
[2]
L., Wu, X.-B., Yang, J., et al
Ai, Y. L., Wu, X.-B., Yang, J., et al. 2016, AJ, 151, 24, doi: 10.3847/0004-6256/151/2/24
-
[3]
F., Argudo-Fern´ andez, M., et al
Almeida, A., Anderson, S. F., Argudo-Fern´ andez, M., et al. 2023, ApJS, 267, 44, doi: 10.3847/1538-4365/acda98
-
[4]
1993, ARA&A, 31, 473, doi: 10.1146/annurev.aa.31.090193.002353
Antonucci, R. 1993, ARA&A, 31, 473, doi: 10.1146/annurev.aa.31.090193.002353
-
[5]
Assef, R. J., Denney, K. D., Kochanek, C. S., et al. 2011, ApJ, 742, 93, doi: 10.1088/0004-637X/742/2/93
-
[6]
Becker, R. H., Fan, X., White, R. L., et al. 2001, AJ, 122, 2850, doi: 10.1086/324231
-
[7]
Bellm, E. C., Kulkarni, S. R., Graham, M. J., et al. 2019, PASP, 131, 018002, doi: 10.1088/1538-3873/aaecbe
-
[8]
Boller, T., Freyberg, M. J., Tr¨ umper, J., et al. 2016, A&A, 588, A103, doi: 10.1051/0004-6361/201525648
-
[9]
2005, AJ, 130, 381, doi: 10.1086/431722
Boroson, T. 2005, AJ, 130, 381, doi: 10.1086/431722
-
[10]
Boroson, T. A., & Green, R. F. 1992, ApJS, 80, 109, doi: 10.1086/191661
-
[11]
Bovy, J., Hennawi, J. F., Hogg, D. W., et al. 2011, ApJ, 729, 141, doi: 10.1088/0004-637X/729/2/141
-
[12]
Boyle, B. J., Shanks, T., Croom, S. M., et al. 2000, MNRAS, 317, 1014, doi: 10.1046/j.1365-8711.2000.03730.x
-
[13]
Chadid, M., Wade, G. A., Shorlin, S. L. S., & Landstreet, J. D. 2004, A&A, 413, 1087, doi: 10.1051/0004-6361:20031600 19 Figure 17.An example of CLAGN candidates selected from the EVQ sample. The top panel presents the comparison for the spectra from LAMOST and SDSS. The middle panel presents zoomed regions for Hβ, and Hαemission lines. The broad Hβ compo...
-
[14]
Chambers, K. C., Magnier, E. A., Metcalfe, N., et al. 2016, arXiv e-prints, arXiv:1612.05560, doi: 10.48550/arXiv.1612.05560
work page internal anchor Pith review Pith/arXiv arXiv doi:10.48550/arxiv.1612.05560 2016
-
[15]
2019, A&A, 625, A123, doi: 10.1051/0004-6361/201833996
Coffey, D., Salvato, M., Merloni, A., et al. 2019, A&A, 625, A123, doi: 10.1051/0004-6361/201833996
-
[16]
2012, Research in Astronomy and Astrophysics, 12, 1197, doi: 10.1088/1674-4527/12/9/003
Cui, X.-Q., Zhao, Y.-H., Chu, Y.-Q., et al. 2012, Research in Astronomy and Astrophysics, 12, 1197, doi: 10.1088/1674-4527/12/9/003
-
[17]
Denney, K. D. 2012, ApJ, 759, 44, doi: 10.1088/0004-637X/759/1/44
-
[18]
Howell, D. A. 2023, ApJ, 957, 57, doi: 10.3847/1538-4357/ace971
-
[19]
2025, ApJ, 986, 160, doi: 10.3847/1538-4357/add331
Dong, Q., Zhang, Z.-X., Gu, W.-M., Sun, M., & Zheng, Y.-G. 2025, ApJ, 986, 160, doi: 10.3847/1538-4357/add331
-
[20]
Dong, X. Y., Wu, X.-B., Ai, Y. L., et al. 2018, AJ, 155, 189, doi: 10.3847/1538-3881/aab5ae
-
[21]
Dye, S., Warren, S. J., Hambly, N. C., et al. 2006, MNRAS, 372, 1227, doi: 10.1111/j.1365-2966.2006.10928.x 20
-
[22]
Fan, X., Ba˜ nados, E., & Simcoe, R. A. 2023, ARA&A, 61, 373, doi: 10.1146/annurev-astro-052920-102455
-
[23]
2024, MNRAS, 532, 3669, doi: 10.1093/mnras/stae1610
Filbert, S., Martini, P., Seebaluck, K., et al. 2024, MNRAS, 532, 3669, doi: 10.1093/mnras/stae1610
-
[24]
Flesch, E. W. 2023, The Open Journal of Astrophysics, 6, 49, doi: 10.21105/astro.2308.01505
-
[25]
Flewelling, H. A., Magnier, E. A., Chambers, K. C., et al. 2020, ApJS, 251, 7, doi: 10.3847/1538-4365/abb82d
-
[26]
Fu, Y. 2021, QSOFITMORE: a python package for fitting UV-optical spectra of quasars, v1.1.0, Zenodo, Zenodo, doi: 10.5281/zenodo.5810042
-
[27]
2021, ApJS, 254, 6, doi: 10.3847/1538-4365/abe85e
Fu, Y., Wu, X.-B., Yang, Q., et al. 2021, ApJS, 254, 6, doi: 10.3847/1538-4365/abe85e
-
[28]
2022, ApJS, 261, 32, doi: 10.3847/1538-4365/ac7f3e
Fu, Y., Wu, X.-B., Jiang, L., et al. 2022, ApJS, 261, 32, doi: 10.3847/1538-4365/ac7f3e
-
[29]
2024, ApJS, 271, 54, doi: 10.3847/1538-4365/ad2ae6
Fu, Y., Wu, X.-B., Li, Y., et al. 2024, ApJS, 271, 54, doi: 10.3847/1538-4365/ad2ae6
-
[30]
Guo, H., Shen, Y., & Wang, S. 2018, PyQSOFit: Python code to fit the spectrum of quasars, Astrophysics Source Code Library, record ascl:1809.008. http://ascl.net/1809.008
work page 2018
-
[31]
2019, ApJL, 883, L44, doi: 10.3847/2041-8213/ab4138
Guo, H., Sun, M., Liu, X., et al. 2019, ApJL, 883, L44, doi: 10.3847/2041-8213/ab4138
-
[32]
Guo, W.-J., Zou, H., Fawcett, V. A., et al. 2024, ApJS, 270, 26, doi: 10.3847/1538-4365/ad118a
-
[33]
Hennawi, J. F., & Prochaska, J. X. 2007, ApJ, 655, 735, doi: 10.1086/509770
-
[34]
2010, Research in Astronomy and Astrophysics, 10, 612, doi: 10.1088/1674-4527/10/7/002
Huo, Z.-Y., Liu, X.-W., Yuan, H.-B., et al. 2010, Research in Astronomy and Astrophysics, 10, 612, doi: 10.1088/1674-4527/10/7/002
-
[35]
2013, AJ, 145, 159, doi: 10.1088/0004-6256/145/6/159 —
Huo, Z.-Y., Liu, X.-W., Xiang, M.-S., et al. 2013, AJ, 145, 159, doi: 10.1088/0004-6256/145/6/159 —. 2015, Research in Astronomy and Astrophysics, 15, 1438, doi: 10.1088/1674-4527/15/8/023
-
[36]
2025, ApJS, 278, 6, doi: 10.3847/1538-4365/adba52
Huo, Z.-Y., Fu, Y., Huang, Y., et al. 2025, ApJS, 278, 6, doi: 10.3847/1538-4365/adba52
-
[37]
2023, ApJS, 265, 25, doi: 10.3847/1538-4365/acaf89
Jin, J.-J., Wu, X.-B., Fu, Y., et al. 2023, ApJS, 265, 25, doi: 10.3847/1538-4365/acaf89
-
[38]
2019, MNRAS, 485, 4539, doi: 10.1093/mnras/stz680
Jin, X., Zhang, Y., Zhang, J., et al. 2019, MNRAS, 485, 4539, doi: 10.1093/mnras/stz680
-
[39]
2007, ApJL, 667, L33, doi: 10.1086/522002
Komossa, S., & Xu, D. 2007, ApJL, 667, L33, doi: 10.1086/522002
-
[40]
Kormendy, J., & Ho, L. C. 2013, ARA&A, 51, 511, doi: 10.1146/annurev-astro-082708-101811
work page internal anchor Pith review doi:10.1146/annurev-astro-082708-101811 2013
-
[41]
LaMassa, S. M., Cales, S., Moran, E. C., et al. 2015, ApJ, 800, 144, doi: 10.1088/0004-637X/800/2/144
-
[42]
Lawrence, A., Warren, S. J., Almaini, O., et al. 2007, MNRAS, 379, 1599, doi: 10.1111/j.1365-2966.2007.12040.x Lightkurve Collaboration, Cardoso, J. V. d. M., Hedges, C., et al. 2018, Lightkurve: Kepler and TESS time series analysis in Python, Astrophysics Source Code Library. http://ascl.net/1812.013 L´ opez-Navas, E., Ar´ evalo, P., Bernal, S., et al. 2...
-
[43]
L., Zhang, H.-T., Zhao, Y.-H., et al
Luo, A. L., Zhang, H.-T., Zhao, Y.-H., et al. 2012, Research in Astronomy and Astrophysics, 12, 1243, doi: 10.1088/1674-4527/12/9/004
-
[44]
L., Zhao, Y.-H., Zhao, G., et al
Luo, A. L., Zhao, Y.-H., Zhao, G., et al. 2015, Research in Astronomy and Astrophysics, 15, 1095, doi: 10.1088/1674-4527/15/8/002
-
[45]
Lyu, J., Alberts, S., Rieke, G. H., & Rujopakarn, W. 2022, ApJ, 941, 191, doi: 10.3847/1538-4357/ac9e5d
-
[46]
MacLeod, C. L., Ross, N. P., Lawrence, A., et al. 2016, MNRAS, 457, 389, doi: 10.1093/mnras/stv2997
-
[47]
MacLeod, C. L., Green, P. J., Anderson, S. F., et al. 2019, ApJ, 874, 8, doi: 10.3847/1538-4357/ab05e2
-
[48]
2023, ApJ, 953, 32, doi: 10.3847/1538-4357/ace1ee Pˆ aris, I., Petitjean, P., Aubourg,´E., et al
Makrygianni, L., Trakhtenbrot, B., Arcavi, I., et al. 2023, ApJ, 953, 32, doi: 10.3847/1538-4357/ace1ee Pˆ aris, I., Petitjean, P., Aubourg,´E., et al. 2012, A&A, 548, A66, doi: 10.1051/0004-6361/201220142 —. 2018, A&A, 613, A51, doi: 10.1051/0004-6361/201732445
-
[49]
B., Scranton , R., M \'e nard , B., et al
Peng, N., Zhang, Y., Zhao, Y., & Wu, X.-b. 2012, MNRAS, 425, 2599, doi: 10.1111/j.1365-2966.2012.21191.x
-
[50]
2019, MNRAS, 483, 2362, doi: 10.1093/mnras/sty3261
Hoenig, S. 2019, MNRAS, 483, 2362, doi: 10.1093/mnras/sty3261
-
[51]
Rakshit, S., Stalin, C. S., & Kotilainen, J. 2020, ApJS, 249, 17, doi: 10.3847/1538-4365/ab99c5
-
[52]
2024, ApJ, 963, 7, doi: 10.3847/1538-4357/ad17cb
Ren, W., Wang, J., Cai, Z., & Hu, X. 2024, ApJ, 963, 7, doi: 10.3847/1538-4357/ad17cb
-
[53]
Richards, G. T., Strauss, M. A., Fan, X., et al. 2006, AJ, 131, 2766, doi: 10.1086/503559
-
[54]
Richards, G. T., Myers, A. D., Gray, A. G., et al. 2009, ApJS, 180, 67, doi: 10.1088/0067-0049/180/1/67
-
[55]
Robinson, L. B., & Wampler, E. J. 1972, PASP, 84, 161, doi: 10.1086/129265
-
[56]
Ross, N. P., Myers, A. D., Sheldon, E. S., et al. 2012, ApJS, 199, 3, doi: 10.1088/0067-0049/199/1/3
-
[57]
2018, ApJ, 854, 160, doi: 10.3847/1538-4357/aaa9b6
Rumbaugh, N., Shen, Y., Morganson, E., et al. 2018, ApJ, 854, 160, doi: 10.3847/1538-4357/aaa9b6
-
[58]
Runco, J. N., Cosens, M., Bennert, V. N., et al. 2016, ApJ, 821, 33, doi: 10.3847/0004-637X/821/1/33
-
[59]
A., Gebhardt, K., & Bonning, E
Salviander, S., Shields, G. A., Gebhardt, K., & Bonning, E. W. 2007, ApJ, 662, 131, doi: 10.1086/513086
-
[60]
Schlegel, D. J., Finkbeiner, D. P., & Davis, M. 1998, ApJ, 500, 525, doi: 10.1086/305772 21
work page internal anchor Pith review doi:10.1086/305772 1998
-
[61]
2018, A&A, 615, A13, doi: 10.1051/0004-6361/201731557
Weidmann, W. 2018, A&A, 615, A13, doi: 10.1051/0004-6361/201731557
-
[62]
1963, Nature, 197, 1040, doi: 10.1038/1971040a0
Schmidt, M. 1963, Nature, 197, 1040, doi: 10.1038/1971040a0
-
[63]
Schneider, D. P., Hall, P. B., Richards, G. T., et al. 2007, AJ, 134, 102, doi: 10.1086/518474
-
[64]
Shen, Y., Richards, G. T., Strauss, M. A., et al. 2011, ApJS, 194, 45, doi: 10.1088/0067-0049/194/2/45
-
[65]
Shen, Y., Hall, P. B., Horne, K., et al. 2019, ApJS, 241, 34, doi: 10.3847/1538-4365/ab074f
-
[66]
Shin, J., Nagao, T., Woo, J.-H., & Le, H. A. N. 2019, ApJ, 874, 22, doi: 10.3847/1538-4357/ab05da
-
[67]
Song, Y.-H., Luo, A. L., Comte, G., et al. 2012, Research in Astronomy and Astrophysics, 12, 453, doi: 10.1088/1674-4527/12/4/009
-
[68]
2004, ChJA&A, 4, 1, doi: 10.1088/1009-9271/4/1/1
Su, D.-Q., & Cui, X.-Q. 2004, ChJA&A, 4, 1, doi: 10.1088/1009-9271/4/1/1
-
[69]
Trager, S. C., Worthey, G., Faber, S. M., Burstein, D., & Gonz´ alez, J. J. 1998, ApJS, 116, 1, doi: 10.1086/313099
-
[70]
2019, Nature Astronomy, 3, 242, doi: 10.1038/s41550-018-0661-3
Trakhtenbrot, B., Arcavi, I., Ricci, C., et al. 2019, Nature Astronomy, 3, 242, doi: 10.1038/s41550-018-0661-3
-
[71]
2006, ApJ, 650, 57, doi: 10.1086/506376 Vanden Berk, D
Tsuzuki, Y., Kawara, K., Yoshii, Y., et al. 2006, ApJ, 650, 57, doi: 10.1086/506376 Vanden Berk, D. E., Richards, G. T., Bauer, A., et al. 2001, AJ, 122, 549, doi: 10.1086/321167
-
[72]
Vestergaard, M., & Peterson, B. M. 2006, ApJ, 641, 689, doi: 10.1086/500572
work page internal anchor Pith review doi:10.1086/500572 2006
-
[73]
Vestergaard, M., & Wilkes, B. J. 2001, ApJS, 134, 1, doi: 10.1086/320357
-
[74]
Wang, J., Xu, D. W., Wang, Y., et al. 2019a, ApJ, 887, 15, doi: 10.3847/1538-4357/ab4d90
-
[75]
2009, ApJ, 707, 1334, doi: 10.1088/0004-637X/707/2/1334
Wang, J.-G., Dong, X.-B., Wang, T.-G., et al. 2009, ApJ, 707, 1334, doi: 10.1088/0004-637X/707/2/1334
-
[76]
2019, ApJ, 877, 116, doi: 10.3847/1538-4357/ab1c61
Wang, S., & Chen, X. 2019, ApJ, 877, 116, doi: 10.3847/1538-4357/ab1c61
-
[77]
2019b, ApJ, 882, 4, doi: 10.3847/1538-4357/ab322b
Wang, S., Shen, Y., Jiang, L., et al. 2019b, ApJ, 882, 4, doi: 10.3847/1538-4357/ab322b
-
[78]
1996, ApOpt, 35, 5155, doi: 10.1364/AO.35.005155
Wang, S.-G., Su, D.-Q., Chu, Y.-Q., Cui, X., & Wang, Y.-N. 1996, ApOpt, 35, 5155, doi: 10.1364/AO.35.005155
-
[79]
Warren, S. J., Hewett, P. C., & Foltz, C. B. 2000, MNRAS, 312, 827, doi: 10.1046/j.1365-8711.2000.03206.x
-
[80]
A., Coriat, M., Traulsen, I., et al
Webb, N. A., Coriat, M., Traulsen, I., et al. 2020, A&A, 641, A136, doi: 10.1051/0004-6361/201937353
discussion (0)
Sign in with ORCID, Apple, or X to comment. Anyone can read and Pith papers without signing in.