REVIEW 3 major objections 4 minor 4 references
Not Just How Much, But Where: Decomposing Epistemic Uncertainty into Per-Class Contributions
T0 review · 3 major / 4 minor · reviewed 2026-08-02 · deepseek-v4-flash
Pith's one-line read Epistemic uncertainty in classification decomposes per class into a variance-to-mean ratio, C_k = Var[p_k]/(2 μ_k), and the sum closely recovers mutual information.
desk verdict The per-class MI decomposition is mathematically sound and useful, but the paper's main empirical advantage over scalar MI appears to come from knowing the safe/critical partition rather than from the per-class decomposition. read the letter →
The pith
A machine-rendered reading of the paper's core claim, the machinery that carries it, and where it could break.
The reading
What carries the argument
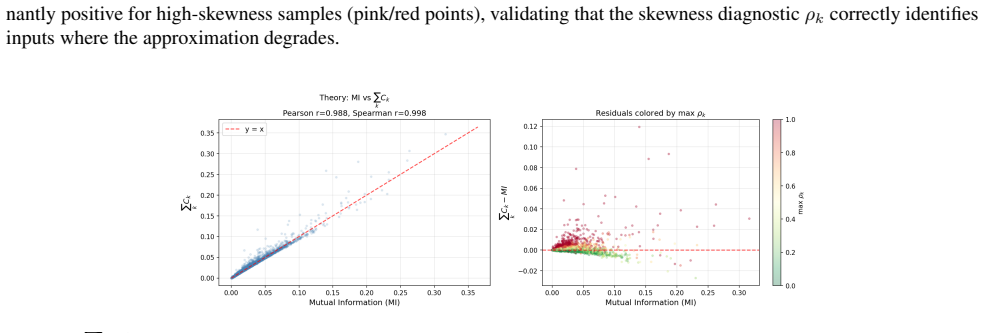
The key object is the per-class epistemic vector C(x) with components C_k = σ_k^2/(2 μ_k), where μ_k and σ_k^2 are the mean and variance of the class-k softmax probability across stochastic forward passes. It follows from a second-order Taylor expansion of entropy whose Hessian is diagonal, so the approximation to mutual information splits additively over classes. The 1/μ_k factor is the entropy curvature and doubles as a dispersion-index normalisation that prevents boundary suppression. A companion skewness diagnostic ρ_k = |m3,k|/(3 μ_k σ_k^2) measures the third-order correction relative to the second-order term, flagging when C_k is unreliable; for such cases, a cross-boundary confusion s
What would settle it
For samples where the paper's own skewness diagnostic reports ρ_k>0.3 (e.g., 37% of Grade 3 diabetic retinopathy samples), compute exact MI and compare with Σ C_k; if the per-class attribution reverses the ordering of classes or the error exceeds the third-order term, the second-order decomposition is falsified exactly where the diagnostic warns.
Extended reading notes
Core claim
Mutual information I(y;ω|x) can be approximately decomposed per class as C_k(x)=Var[p_k](x)/(2 μ_k(x)), so that Σ_k C_k ≈ I. The decomposition follows from the diagonal Hessian of Shannon entropy: expanding expected entropy about the mean μ yields a curvature-weighted sum of per-class variances. The 1/μ_k weight corrects boundary suppression (raw variance vanishes as μ_k→0) and makes components comparable across rare and common classes. The aggregate satisfies axioms of non-negativity, vanishing at certainty, and monotonicity under mean-preserving spreads; a skewness diagnostic flags where the second-order approximation degrades. Critical-class C_k reduces selective risk in diabetic retinopa
Load-bearing premise
The central approximation—that the second-order Taylor expansion of entropy is accurate for each class—is weakest precisely for rare, safety-critical classes with skewed posterior samples; the paper's own diagnostic shows only 63% of Grade 3 samples are reliable (ρ_k<0.3), so C_k can be untrustworthy where it matters most.
Editorial extensions
If this is right
- Because Σ_k C_k ≈ I(y;ω|x) with near-perfect rank correlation (Spearman r=0.998), practitioners can replace scalar MI with the vector and retain MI's interpretation while adding class resolution.
- Targeting critical-class C_k (Ccrit_max) improves selective prediction for diabetic retinopathy: AUSC drops 34.7% vs MI and 56.2% vs raw variance, with the gain persisting under deep ensembles.
- The per-class view exposes 'epistemic signatures' of errors: catastrophic misses and severity underestimates have nearly identical MI but distinct C_k profiles, enabling different remediation strategies.
- For out-of-distribution detection, Σ_k C_k gives the highest AUROC on FashionMNIST→KMNIST and MIMIC-III→Newborn, and the per-class decomposition reveals asymmetric shifts (e.g., MIMIC mortality signal concentrated in the survival class).
- Under controlled label noise, Σ_k C_k is less entangled with aleatoric uncertainty than MI in 19 of 20 end-to-end conditions; transfer learning degrades both metrics by an order of magnitude, showing posterior quality is as important as the metric.
Reading between the lines
- The paper leaves implicit an active-learning application: because C_k attributes MI to specific classes, acquisition functions could query instances where a target class's C_k is highest, directly reducing per-class error rather than global MI; this is testable on class-imbalanced benchmarks.
- Since C_k is the index of dispersion (Fano factor) scaled by 1/2, the decomposition connects to classical dispersion theory; a natural extension is modelling p_k with a Poisson-binomial or Dirichlet-multinomial and deriving exact per-class terms beyond the second order.
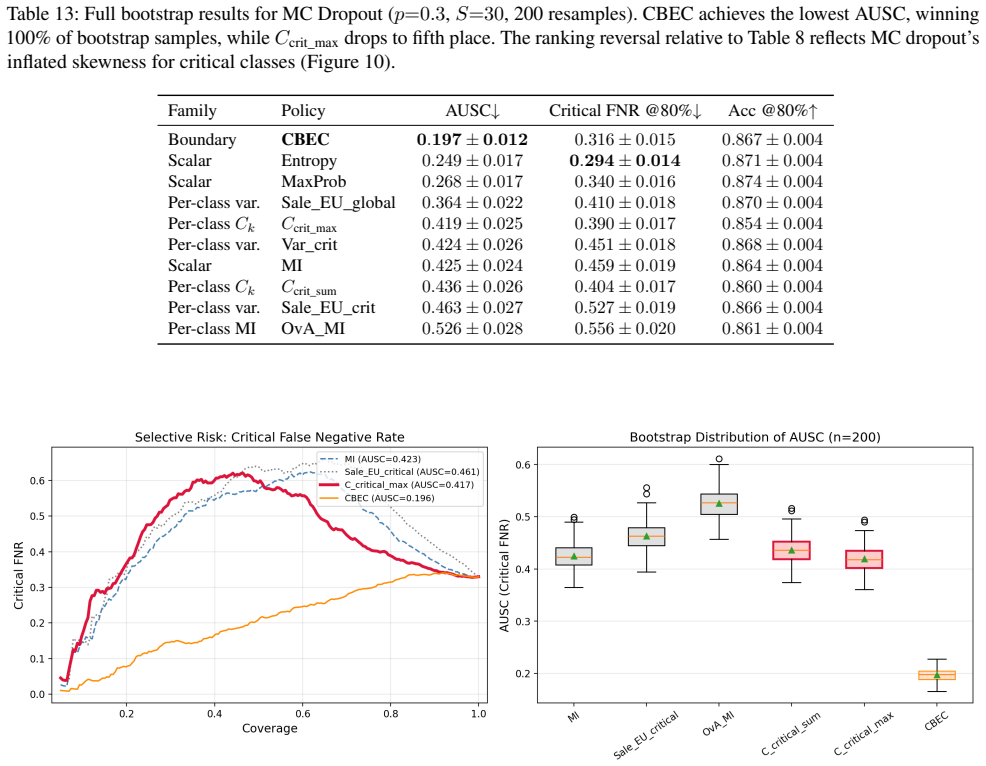
- A meta-criterion suggested by the results but not formalised: use the skewness diagnostic ρ_k as a switch between Ccrit_max (when ρ_k<0.3) and CBEC (when ρ_k>0.3); the paper's MC-dropout ranking reversal indicates this switch could be automated.
- The strong dependence of disentanglement on training regime implies that benchmarks comparing uncertainty metrics should control for inference scheme; otherwise metric rankings may reflect the posterior approximation rather than the metric itself.
Editorial analysis
A structured set of objections, weighed in public.
Referee Report
Summary. The paper proposes a per-class epistemic uncertainty decomposition C_k(x) = Var[p_k]/(2 mu_k), derived from a second-order Taylor expansion of the mutual information I(y; omega | x). The sum of C_k over classes is claimed to approximate MI, with a skewness diagnostic rho_k flagging inputs where the approximation degrades. The authors evaluate the method on three tasks: selective prediction for diabetic retinopathy, where critical-class aggregates (Ccrit_max, Ccrit_sum, CBEC) are compared against scalar and variance baselines; out-of-distribution detection on FashionMNIST->KMNIST and MIMIC-III->Newborn; and label-noise disentanglement experiments under end-to-end versus transfer learning. The headline empirical claim is that Ccrit_max reduces selective risk (AUSC) by 34.7% over MI for diabetic retinopathy grading.
Significance. The theoretical core is clean and the decomposition is genuinely parameter-free apart from a numerical epsilon. The per-class vector, if reliable, would be a useful diagnostic tool that is absent from current scalar MI practice. The paper also provides a thoughtful axiomatic analysis, a skewness diagnostic, and validation across multiple inference regimes and datasets, with code and models made available. These are real strengths. However, the main empirical claim is currently undercut by an omitted baseline: a binary cross-boundary MI evaluated on the known safe/critical partition ties Ccrit_max in AUSC. If that result stands, the selective-prediction advantage is driven by knowing the class partition rather than by the per-class decomposition itself. The OoD improvements are also small and not shown to be statistically significant. The manuscript is therefore not ready for acceptance in its present form, but the issues are addressable.
major comments (3)
- [§3.3, Table 2 vs. Appendix D.6, Table 8 footnote] The headline '34.7% reduction over MI' compares Ccrit_max (AUSC 0.285) to multiclass scalar MI (0.436), but the appendix reports a binary cross-boundary MI baseline computed on the known collapsed partition S={0,1}, C={2,3} that achieves AUSC 0.284±0.015, statistically tied with Ccrit_max (mutual win rate 49.5%/50.5%). This baseline controls for the most important confound — knowledge of the safe/critical partition — and should be included in Table 2. The reasons given for excluding it ('not part of the C_k framework', 'numerical instability') are not scientific justifications; the instability is unquantified and applies to a small fraction of samples. As it stands, the central selective-prediction claim is not supported: the improvement is attributable to the partition, not to the per-class decomposition.
- [§3.3 and §2.5, Table 7] The primary metric Ccrit_max relies on C_k for critical classes, but the paper's own skewness diagnostic shows that Grade 3 has only 63.4% of samples with rho_k<0.3 and median rho=0.218. For Grade 3, mu_k≈0.06 and the third-order remainder scales as 1/mu_k^2, so C_k can be unreliable for a large fraction of exactly the samples that should drive deferral. The manuscript acknowledges this and proposes CBEC as a fallback, but Ccrit_max remains the recommended primary metric and its AUSC advantage is not recomputed on the subset of samples where all critical classes have rho<0.3. The paper should report performance stratified by skewness reliability, or explicitly condition the recommendation on the reliability regime.
- [§4.2, Table 3] The OoD improvements of sum_k C_k over MI are small and no significance testing is reported. On FashionMNIST, 0.735±0.009 vs. 0.724±0.009; on MIMIC-III, 0.815±0.017 vs. 0.802±0.004. With means and standard deviations overlapping or nearly overlapping, the claim that sum_k C_k 'achieves the highest AUROC' needs bootstrap or paired-test evidence. This is a secondary claim, but it is presented as a validation of the decomposition and should be supported.
minor comments (4)
- [Abstract / §3.3] The abstract's '34.7% over MI' should specify that the comparison is to class-agnostic multiclass MI, not to the binary cross-boundary MI that ties with Ccrit_max. The current wording is misleading.
- [Appendix D.6, Table 8] The footnote about the binary cross-boundary MI baseline is easy to miss and contains the most important control result of the paper. It should be moved to the main text and discussed honestly.
- [§2.5, Definition 2.10] The skewness ratio rho_k is defined as |m_{3,k}|/(3 mu_k Var[p_k]). The text explains it as the ratio of third- to second-order corrections, but the denominator is 3 mu_k Var[p_k], not 3 mu_k sigma^2_k. This is correct, but it would help to spell out that this equals |m_{3,k}|/(6 mu_k^2 C_k), clarifying the 1/mu_k^2 amplification.
- [Appendix F.3, Eq. (57)] The O(K^2) scaling formula assumes approximately uniform variance and a particular probability allocation. This is a useful heuristic, but it should be labeled as a worst-case asymptotic sketch rather than a general result, since MI itself is bounded by log K.
Circularity Check
No material circularity: the C_k decomposition is derived from a Taylor expansion, not fitted; the only self-citation is non-load-bearing.
full rationale
The central derivation is self-contained. Theorem 2.2 obtains sum_k C_k ≈ MI from a second-order Taylor expansion of the entropy, using the diagonal Hessian from Lemma 2.1; Definition 2.3 then sets C_k = Var[p_k]/(2 mu_k). The additive relation is an analytical identity, not a fitted or renamed input. The reported Pearson r=0.988 is an empirical check on the neglected Taylor remainder, not a validation of a fitted parameter. No parameter is fit to a subset of data and then called a prediction, and no load-bearing claim is justified only by a self-citation. The only self-citation is the low-rank variational inference framework of Toure and Stephens [2026], used to build the EfficientNet-B4 backbone; the C_k derivation, axiomatic analysis, and OoD/label-noise experiments do not hinge on that framework. The paper also explicitly discloses the Taylor-remainder limitation and provides a skewness diagnostic, and the Appendix D.6 footnote admits that a binary cross-boundary MI baseline on the known safe/critical partition is essentially tied with Ccrit_max (0.284 vs 0.285) but was excluded from the main comparison. That is a genuine empirical-comparison caveat — the selective-prediction advantage may be partly attributable to the class partition rather than to the per-class decomposition — but it is not circularity: C_k is not defined in terms of the deferral baseline, and the tie does not show that C_k reduces by construction to the binary MI score. Overall, the paper's theoretical contribution is independent of its inputs, with only a minor non-load-bearing self-citation and a disclosed baseline-selection issue.
Assumptions & free parameters
free parameters (3)
- skewness threshold =
0.3
- CBEC design choices =
geometric mean, correlation gate max(0,-ρ_ij), S×C domain
- epsilon denominator =
1e-10
assumptions (6)
- standard math Entropy Hessian is diagonal: ∂²H/∂p_k∂p_j = -δ_kj/p_k
- domain assumption Second-order Taylor expansion of E[H(p)] with negligible remainder
- domain assumption MC samples p^(s) are i.i.d. from an approximate posterior Q
- standard math Simplex constraint rank≤K-1 does not invalidate the trace formula
- ad hoc to paper Safe/critical class partition is specified and meaningful
- domain assumption Low-rank variational posterior is accurate enough for the Taylor approximation
invented entities (3)
-
Per-class epistemic uncertainty vector C(x)
independent evidence
-
Skewness diagnostic ρ_k
independent evidence
-
CBEC cross-boundary metric
independent evidence
Cite this review
Pith. "Pith review of Not Just How Much, But Where: Decomposing Epistemic Uncertainty into Per-Class Contributions." pith.science (2026). https://pith.science/paper/WD4ODE53
@misc{pith2026260221160,
  author       = {Pith},
  title        = {Pith review of: Not Just How Much, But Where: Decomposing Epistemic Uncertainty into Per-Class Contributions},
  year         = {2026},
  howpublished = {\url{https://pith.science/paper/WD4ODE53}},
  note         = {Machine review of arXiv:2602.21160}
}
abstract
In safety-critical classification, the cost of failure is often asymmetric, yet Bayesian deep learning summarises epistemic uncertainty with a single scalar, mutual information (MI), that cannot distinguish whether a model's ignorance involves a benign or safety-critical class. We decompose MI into a per-class vector $C_k(x)=\sigma_k^{2}/(2\mu_k)$, with $\mu_k{=}\mathbb{E}[p_k]$ and $\sigma_k^2{=}\mathrm{Var}[p_k]$ across posterior samples. The decomposition follows from a second-order Taylor expansion of the entropy; the $1/\mu_k$ weighting corrects boundary suppression and makes $C_k$ comparable across rare and common classes. By construction $\sum_k C_k \approx \mathrm{MI}$, and a companion skewness diagnostic flags inputs where the approximation degrades. After characterising the axiomatic properties of $C_k$, we validate it on three tasks: (i) selective prediction for diabetic retinopathy, where critical-class $C_k$ reduces selective risk by 34.7\% over MI and 56.2\% over variance baselines; (ii) out-of-distribution detection on clinical and image benchmarks, where $\sum_k C_k$ achieves the highest AUROC and the per-class view exposes asymmetric shifts invisible to MI; and (iii) a controlled label-noise study in which $\sum_k C_k$ shows less sensitivity to injected aleatoric noise than MI under end-to-end Bayesian training, while both metrics degrade under transfer learning. Across all tasks, the quality of the posterior approximation shapes uncertainty at least as strongly as the choice of metric, suggesting that how uncertainty is propagated through the network matters as much as how it is measured.
Figures


Figures from the paper (13 more)




Reference graph
Works this paper leans on
-
[2]
with π= 0.5 , σ1 = 1.0, σ2 =e −6. Posterior initialisation uses He-scaled uniform means with ρ initialised so that softplus(ρ)≈0.09 p 2/din. Training uses KL annealing with the scale frozen at zero for the first epochs, then linearly warmed up. BatchNormalization layers remain deterministic. Full-rank layers.Depthwise convolutions lack the m×n matrix stru...
arXiv 2018
-
[3]
URL https://proceedings.neurips. cc/paper_files/paper/2018/file/ a981f2b708044d6fb4a71a1463242520-Paper. pdf. Lewis Smith and Yarin Gal. Understanding measures of uncertainty for adversarial example detection. InProceed- ings of the 34th Conference on Uncertainty in Artificial Intelligence (UAI), pages 560–569, 2018. Mingxing Tan and Quoc V . Le. Efficien...
arXiv 2018
-
[2018]
cc/paper_files/paper/2018/file/ 3ea2db50e62ceefceaf70a9d9a56a6f4-Paper
URL https://proceedings.neurips. cc/paper_files/paper/2018/file/ 3ea2db50e62ceefceaf70a9d9a56a6f4-Paper. pdf. Bálint Mucsányi, Michael Kirchhof, and Seong Joon Oh. Benchmarking uncertainty disentanglement: specialized uncertainties for specialized tasks. InProceedings of the 38th International Conference on Neural Information Processing Systems, pages 509...
2018
-
[2019]
URL https://www.kaggle.com/c/ aptos2019-blindness-detection. Zeynep Sonat Baltaci, Kemal Oksuz, Selim Kuzucu, Kivanc Tezoren, Berkin Kerim Konar, Alpay Ozkan, Emre Akbas, and Sinan Kalkan. Class uncertainty: A measure to miti- gate class imbalance.arXiv preprint arXiv:2311.14090, 2023. David M Blei, Alp Kucukelbir, and Jon D McAuliffe. Vari- ational infer...
arXiv 2023
Reviewed August 2, 2026 · model on record in the stance chip above.
Discussion (0). Continue with ORCID to comment.