Recognition: 2 theorem links
· Lean TheoremNovel insights into the Coma Cluster kinematics with DESI. I. Linking mass profile, orbital anisotropy, and galaxy populations
Pith reviewed 2026-05-15 09:52 UTC · model grok-4.3
The pith
Using DESI spectroscopy, the Coma cluster virial mass is measured as 1.04 × 10^15 solar masses assuming an NFW profile.
A machine-rendered reading of the paper's core claim, the machinery that carries it, and where it could break.
Core claim
By jointly fitting the mass and anisotropy profiles to DESI line-of-sight velocities under an NFW assumption, the analysis yields M_200 = 1.04_{-0.08}^{+0.07} (stat) ± 0.09 (syst) × 10^15 M_⊙ and r_200 = 2.07 ± 0.05 Mpc, with a dark-matter mass M_200^DM = 8.6^{+1.2}_{-0.8} × 10^14 M_⊙. Separate analysis of color-selected populations shows green-valley galaxies with more radial orbits in the inner regions and blue-cloud galaxies with more radial orbits at large radii, each subsample producing slightly different virial-mass estimates.
What carries the argument
The MG-MAMPOSSt code that solves the spherical Jeans equation for a joint mass-anisotropy fit, applied to the full sample and to color-selected subsamples of galaxies.
If this is right
- The kinematic mass profile supplies the tightest robust constraint on Coma to date and can be used as a benchmark for cosmological simulations.
- Differences in orbital anisotropy between green-valley and blue-cloud galaxies indicate that star-formation state correlates with dynamical history inside the cluster.
- Blue-cloud galaxies analyzed alone return a higher virial mass, showing that population selection affects inferred cluster properties.
- Consistency checks across radial ranges and rest-frame choices confirm that the main mass and anisotropy results are stable.
Where Pith is reading between the lines
- The radial-orbit signature of blue galaxies at large radii may mark recent field infall that has not yet been fully processed by the cluster environment.
- The observed link between color and anisotropy could be inserted into semi-analytic models to predict how quenching timescales depend on orbital parameters.
- Repeating the identical analysis on other DESI clusters would test whether the green-valley versus blue-cloud orbital pattern is universal.
Load-bearing premise
The total mass follows a Navarro-Frenk-White density profile and the cluster is in dynamical equilibrium.
What would settle it
An independent weak-lensing or X-ray hydrostatic mass measurement falling outside the reported 1.04 × 10^15 solar-mass range at comparable precision would falsify the NFW-based kinematic result.
Figures


read the original abstract
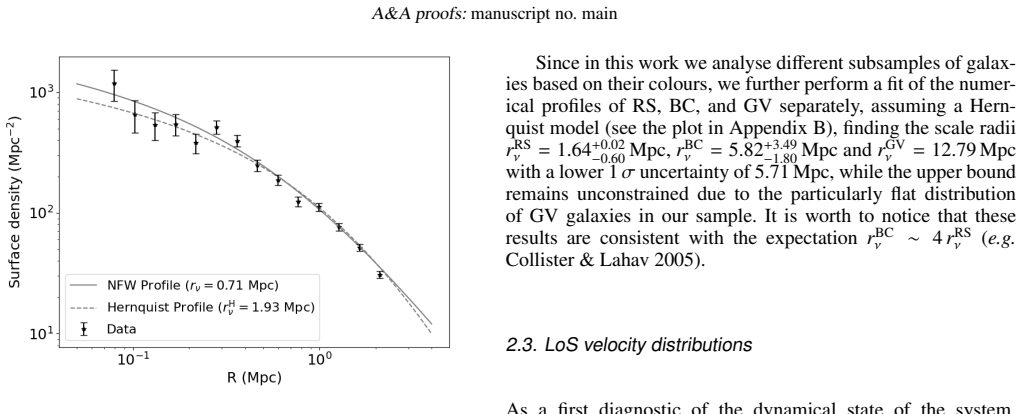
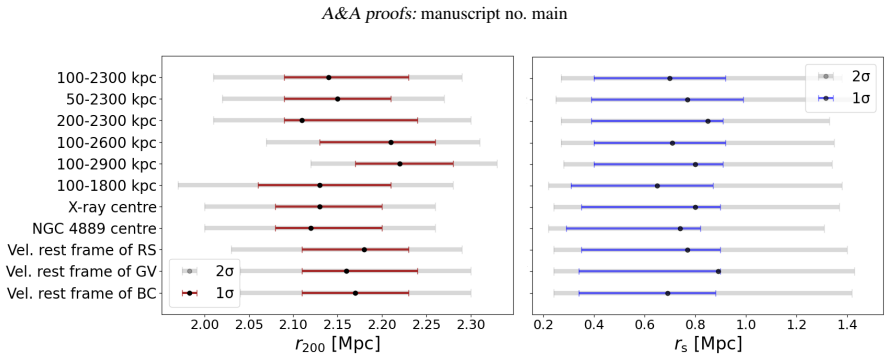
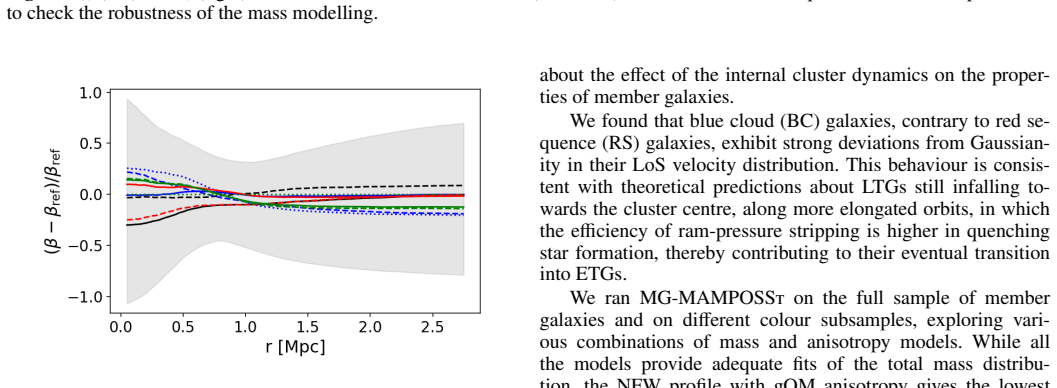
We investigate the kinematic properties of the Coma galaxy cluster using a new, large spectroscopic sample of member galaxies, from the Dark Energy Spectroscopic Instrument (DESI). By means of the MG-MAMPOSSt code, based on the Jeans equation, we jointly reconstruct the total cluster mass profile and the velocity anisotropy profile. Assuming a Navarro-Frenk-White model, we estimate a virial mass $M_{200}=1.04_{-0.08}^{+0.07}~({\rm stat})\pm 0.09~({\rm syst})\times 10^{15}\,\mathrm{M}_\odot $, corresponding to $r_{200}=2.07 \pm 0.05\,\mathrm{Mpc}$ and a scale radius for the mass profile $r_{\rm s}=0.73^{+0.24}_{-0.30}\,\mathrm{Mpc}$, which provides the tightest robust kinematic mass profile constraint to date. By considering separately the mass of the hot gas and the galaxy stellar mass, we determine the dark matter mass profile, with $M_{200}^{\rm DM}=8.6^{+1.2}_{-0.8}\times 10^{14}\,\text{M}_\odot$. We discuss the impact of the mass and number density parametrisations, the effect of different choices of the cluster's rest frame and of the radial range of the kinematic analysis, further comparing our results with previous estimates from the literature. The cluster dynamical state has also been assessed, using the spatial and line-of-sight velocity distributions of the members. We perform a kinematic study of different subsamples of galaxy populations, based on their colour (red sequence, green valley, and blue cloud), focusing on the anisotropy profiles and line-of-sight velocity distributions. The orbits of green valley and blue cloud galaxies appear to be more radial in the centre and in the outskirts, respectively, with the latter predicting a higher cluster virial mass. This study provides new insights on the interplay between dynamical and intrinsic properties of galaxies in massive structures, fundamental to verify the tight connection between galaxy evolution and environment.
Editorial analysis
A structured set of objections, weighed in public.
Referee Report
Summary. The manuscript analyzes the kinematics of the Coma galaxy cluster using a new large DESI spectroscopic sample of member galaxies. It employs the MG-MAMPOSSt code to solve the spherical Jeans equation and jointly reconstruct the total mass profile (assuming NFW) and velocity anisotropy profile, reporting M_{200} = 1.04_{-0.08}^{+0.07} (stat) ± 0.09 (syst) × 10^{15} M_⊙ with r_{200} = 2.07 ± 0.05 Mpc and r_s = 0.73^{+0.24}_{-0.30} Mpc. The work separates the dark matter mass component, assesses the cluster dynamical state via spatial and LOS velocity distributions, examines impacts of mass parametrizations, rest-frame choices and radial range, and performs a kinematic study of galaxy subpopulations by color (red sequence, green valley, blue cloud) focusing on anisotropy and velocity distributions.
Significance. If the NFW and equilibrium assumptions hold, the analysis supplies the tightest robust kinematic mass constraint for Coma to date from a large new spectroscopic dataset, cleanly separates the DM mass profile, and links orbital properties to galaxy populations, providing useful input for studies of cluster dynamics and environmental effects on galaxy evolution. The joint fitting of mass and anisotropy plus explicit discussion of systematic choices (radial range, rest frame) are strengths.
major comments (1)
- [dynamical state assessment and Jeans modeling sections] The assessment of dynamical equilibrium (stated in the abstract and the relevant results section) relies on qualitative inspection of spatial and line-of-sight velocity distributions but supplies no quantitative metric (Dressler-Shectman statistic, velocity kurtosis, or direct comparison to N-body mocks) demonstrating that deviations remain small enough not to shift the recovered M_{200} outside the quoted 0.09 systematic uncertainty. Because r_s is left free in the NFW fit, any violation of the spherical steady-state assumption in the Jeans equation couples directly into both mass normalization and concentration; this is therefore the single most load-bearing modeling choice for the headline M_{200} result.
minor comments (2)
- [Abstract] The abstract asserts 'the tightest robust kinematic mass profile constraint to date' without naming the specific prior works or samples used for the comparison; adding one sentence with the key reference values would improve context.
- [Tables and figures] Notation for the combined statistical and systematic errors on M_{200} is clear in the text, but ensure the same convention (sub/superscript placement and units) is used uniformly in all tables and figure captions.
Simulated Author's Rebuttal
We thank the referee for the constructive and detailed report. The single major comment raises an important point about quantifying the dynamical state assessment, which we address below by agreeing to strengthen the manuscript with additional metrics while defending the robustness of our quoted systematic uncertainty.
read point-by-point responses
-
Referee: [dynamical state assessment and Jeans modeling sections] The assessment of dynamical equilibrium (stated in the abstract and the relevant results section) relies on qualitative inspection of spatial and line-of-sight velocity distributions but supplies no quantitative metric (Dressler-Shectman statistic, velocity kurtosis, or direct comparison to N-body mocks) demonstrating that deviations remain small enough not to shift the recovered M_{200} outside the quoted 0.09 systematic uncertainty. Because r_s is left free in the NFW fit, any violation of the spherical steady-state assumption in the Jeans equation couples directly into both mass normalization and concentration; this is therefore the single most load-bearing modeling choice for the headline M_{200} result.
Authors: We agree that a more quantitative assessment of dynamical equilibrium would strengthen the paper. In the revised manuscript we will add the Dressler-Shectman statistic applied to the full DESI member sample and report the kurtosis of the line-of-sight velocity distribution; both quantities will be shown to be consistent with only mild deviations from equilibrium. We will explicitly link these metrics to the quoted 0.09 systematic uncertainty by demonstrating that the variations already explored (different radial ranges and rest-frame choices) produce mass shifts of comparable size. Regarding the free r_s parameter, we note that the joint mass-anisotropy fit already marginalizes over concentration, and our tests with alternative mass parametrizations (Section 4.2) provide a partial check on the coupling; we will expand the discussion to cite literature estimates of Jeans-equation bias in mildly unrelaxed clusters and argue that any residual effect remains within the reported systematic. We cannot, however, perform a new set of tailored N-body mocks for the exact DESI selection function within the scope of this work. revision: partial
- Direct comparison to tailored N-body mocks for the precise DESI sample selection and completeness
Circularity Check
Mass profile obtained by direct fit to independent DESI velocities; no reduction to inputs by construction
full rationale
The reported M200 is the direct output of fitting NFW parameters (M200, rs) and anisotropy profile inside MG-MAMPOSSt to the DESI line-of-sight velocity data under the Jeans equation. No equation in the paper equates the fitted mass to a prior fitted quantity or to an input parameter by definition. The dynamical-state assessment uses the same spatial and velocity distributions but is presented only as a consistency check, not as a load-bearing input that forces the mass value. No self-citation chain, ansatz smuggling, or renaming of known results is invoked to justify the central result. The derivation therefore remains self-contained against the external spectroscopic dataset.
Axiom & Free-Parameter Ledger
free parameters (2)
- NFW scale radius rs =
0.73 Mpc
- Virial mass M200 =
1.04e15 solar masses
axioms (2)
- domain assumption Navarro-Frenk-White density profile describes the total mass distribution
- domain assumption Jeans equation holds under dynamical equilibrium
Lean theorems connected to this paper
-
IndisputableMonolith/Cost/FunctionalEquation.leanwashburn_uniqueness_aczel unclear?
unclearRelation between the paper passage and the cited Recognition theorem.
By means of the MG-MAMPOSSt code, based on the Jeans equation, we jointly reconstruct the total cluster mass profile and the velocity anisotropy profile. Assuming a Navarro-Frenk-White model, we estimate a virial mass M200=1.04...×10^15 M⊙
-
IndisputableMonolith/Foundation/AlexanderDuality.leanalexander_duality_circle_linking unclear?
unclearRelation between the paper passage and the cited Recognition theorem.
the stationary and spherically symmetric Jeans equation... d[ν(r)σ²r(r)]/dr + 2β(r)ν(r)σ²r(r)/r = −ν(r)dΦ(r)/dr
What do these tags mean?
- matches
- The paper's claim is directly supported by a theorem in the formal canon.
- supports
- The theorem supports part of the paper's argument, but the paper may add assumptions or extra steps.
- extends
- The paper goes beyond the formal theorem; the theorem is a base layer rather than the whole result.
- uses
- The paper appears to rely on the theorem as machinery.
- contradicts
- The paper's claim conflicts with a theorem or certificate in the canon.
- unclear
- Pith found a possible connection, but the passage is too broad, indirect, or ambiguous to say the theorem truly supports the claim.
Reference graph
Works this paper leans on
- [1]
-
[2]
Adami, C., Biviano, A., Durret, F., & Mazure, A. 2005, A&A, 443, 17
work page 2005
-
[3]
Anderson, T. W. & Darling, D. A. 1952, Ann. Math. Stat., 23, 193
work page 1952
-
[4]
Annunziatella, M., Biviano, A., Mercurio, A., et al. 2014, A&A, 571, A80
work page 2014
-
[5]
Baier, F. W., Fritze, K., & Tiersch, H. 1990, Astron. Nachr., 311, 89
work page 1990
- [6]
-
[7]
2025, arXiv e-prints, arXiv:2504.04135
Benisty, D., Wagner, J., Haridasu, S., & Salucci, P. 2025, arXiv e-prints, arXiv:2504.04135
-
[8]
Bertocco, S., Goz, D., Tornatore, L., et al. 2020, in ASP Conf. Ser., ed. R. Pizzo, E. R. Deul, J. D. Mol, J. de Plaa, & H. Verkouter, V ol. 527, 303
work page 2020
-
[9]
1998, in Untangling Coma Berenices: A New Vision of an Old Clus- ter, ed
Biviano, A. 1998, in Untangling Coma Berenices: A New Vision of an Old Clus- ter, ed. A. Mazure, F. Casoli, F. Durret, & D. Gerbal, 1
work page 1998
- [10]
-
[11]
Biviano, A., Girardi, M., Giuricin, G., Mardirossian, F., & Mezzetti, M. 1992, ApJ, 396, 35
work page 1992
- [12]
-
[13]
Biviano, A., Maraboli, E. A., Pizzuti, L., et al. 2025, arXiv e-prints, arXiv:2508.05195
-
[14]
Biviano, A., Poggianti, B. M., Jaffé, Y ., et al. 2024, ApJ, 965, 117
work page 2024
- [15]
- [16]
-
[17]
Boquien, M., Burgarella, D., Roehlly, Y ., et al. 2019, A&A, 622, A103
work page 2019
- [18]
- [19]
-
[20]
Boselli, A., V oyer, E., Boissier, S., et al. 2014, A&A, 570, A69
work page 2014
-
[21]
Budzynski, J. M., Koposov, S. E., McCarthy, I. G., McGee, S. L., & Belokurov, V . 2012, MNRAS, 423, 104–121
work page 2012
- [22]
-
[23]
Caldwell, N., Rose, J. A., Sharples, R. M., Ellis, R. S., & Bower, R. G. 1993, ApJ, 106, 473
work page 1993
- [24]
- [25]
-
[26]
Churazov, E., Khabibullin, I., Lyskova, N., Sunyaev, R., & Bykov, A. M. 2021, A&A, 651, A41
work page 2021
- [27]
-
[28]
Collister, A. A. & Lahav, O. 2005, MNRAS, 361, 415
work page 2005
-
[29]
Data Release 1 of the Dark Energy Spectroscopic Instrument
Costa, A. P., Ribeiro, A. L. B., de Morais Neto, F. R., & dos Santos Junior, J. 2025, Universe, 11 DESI Collaboration, Abdul-Karim, M., Adame, A. G., et al. 2025, arXiv e-prints, arXiv:2503.14745
work page internal anchor Pith review Pith/arXiv arXiv 2025
-
[30]
Dixon, W. J. & Mood, A. M. 1946, J. Am. Stat. Assoc., 41, 557
work page 1946
- [31]
-
[32]
Fusco-Femiano, R., Cavaliere, A., & Lapi, A. 2009, ApJ, 705, 1019
work page 2009
-
[33]
Gavazzi, G., Fumagalli, M., Cucciati, O., & Boselli, A. 2010, A&A, 517, A73
work page 2010
-
[34]
Gavazzi, R., Adami, C., Durret, F., et al. 2009, A&A, 498, L33–L36
work page 2009
-
[35]
Geller, M. J., Diaferio, A., & Kurtz, M. J. 1999, ApJ, 517, L23
work page 1999
- [36]
-
[37]
Gunn, J. E. & Gott, III, J. R. 1972, ApJ, 176, 1
work page 1972
-
[38]
Hansen, S. H. & Moore, B. 2006, New Astron., 11, 333–338
work page 2006
- [39]
- [40]
- [41]
-
[42]
Hwang, H. S. & Lee, M. G. 2008, ApJ, 676, 218
work page 2008
-
[43]
Kang, W., Hwang, H. S., Okabe, N., & Park, C. 2025, ApJS, 278, 51
work page 2025
- [44]
-
[45]
Kruskal, W. H. & Wallis, W. A. 1952, J. Am. Stat. Assoc., 47, 583
work page 1952
-
[46]
Lin, Y .-T., Mohr, J. J., & Stanford, S. A. 2004, ApJ, 610, 745 Łokas, E. L. 2002, MNRAS, 333, 697 Łokas, E. L. & Mamon, G. A. 2003, MNRAS, 343, 401–412
work page 2004
-
[47]
Lyskova, N., Churazov, E., Zhang, C., et al. 2019, MNRAS, 485, 2922
work page 2019
-
[48]
Malavasi, N., Aghanim, N., Tanimura, H., Bonjean, V ., & Douspis, M. 2020, A&A, 634, A30
work page 2020
-
[49]
Mamon, G. A., Biviano, A., & Boué, G. 2013, MNRAS, 429, 3079–3098
work page 2013
-
[50]
Mamon, G. A., Biviano, A., & Murante, G. 2010, A&A, 520, A30
work page 2010
-
[51]
A., Cava, A., Biviano, A., et al
Mamon, G. A., Cava, A., Biviano, A., et al. 2019, A&A, 631, A131
work page 2019
- [52]
-
[53]
Mirakhor, M. S. & Walker, S. A. 2020, MNRAS, 497, 3204
work page 2020
- [54]
- [55]
- [56]
-
[57]
M., Arnaud, M., Gastaud, R., et al
Neumann, D. M., Arnaud, M., Gastaud, R., et al. 2001, A&A, 365, L74
work page 2001
-
[58]
Osipkov, L. P. 1979, Sov. Astron. Lett., 5, 42
work page 1979
- [59]
-
[60]
Pizzuti, L., Boumechta, Y ., Haridasu, S., et al. 2024, JCAP, 2024, 014
work page 2024
-
[61]
Pizzuti, L., Saltas, I. D., & Amendola, L. 2021, MNRAS, 506, 595–612
work page 2021
-
[62]
Pizzuti, L., Saltas, I. D., Umetsu, K., & Sartoris, B. 2022, MNRAS, 512, 4280
work page 2022
-
[63]
Pizzuti, L., Sartoris, B., Borgani, S., & Biviano, A. 2020, JCAP, 2020, 024–024
work page 2020
- [64]
-
[65]
Ribeiro, A. L. B., de Carvalho, R. R., Trevisan, M., et al. 2013, MNRAS, 434, 784–795
work page 2013
-
[66]
Roberts, I. D., Parker, L. C., & Hlavacek-Larrondo, J. 2018, MNRAS, 475, 4704–4716
work page 2018
-
[67]
Sampaio, V . M., de Carvalho, R. R., Aragón-Salamanca, A., et al. 2024, MN- RAS, 532, 982–994
work page 2024
-
[68]
Sarazin, C. L. 1980, ApJ, 236, 75
work page 1980
-
[69]
Sartoris, B., Biviano, A., Rosati, P., et al. 2020, A&A, 637, A34
work page 2020
-
[70]
Sato, T., Matsushita, K., Ota, N., et al. 2011, PASJ, 63, S991–S1007
work page 2011
-
[71]
Singh, A., Gulati, M., & Bagla, J. S. 2019, MNRAS, 489, 5582 Sodré, L. J., Capelato, H. V ., Steiner, J. E., & Mazure, A. 1989, AJ, 97, 1279
work page 2019
-
[72]
Sunyaev, R. A. & Zeldovich, Y . B. 1972, Comments Astrophys. Space Phys., 4, 173
work page 1972
-
[73]
Taffoni, G., Becciani, U., Garilli, B., et al. 2020, in ASP Conf. Ser., ed. R. Pizzo, E. R. Deul, J. D. Mol, J. de Plaa, & H. Verkouter, V ol. 527, 307
work page 2020
-
[74]
Tammann, G. A. 1972, A&A, 21, 355
work page 1972
-
[75]
Tiret, O., Combes, F., Angus, G. W., Famaey, B., & Zhao, H. S. 2007, A&A, 476, L1
work page 2007
-
[76]
2016, ApJ, 821, 116 Vallés-Pérez, D., Planelles, S., & Quilis, V
Umetsu, K., Zitrin, A., Gruen, D., et al. 2016, ApJ, 821, 116 Vallés-Pérez, D., Planelles, S., & Quilis, V . 2025, A&A, 699, A1 V ollmer, B., Cayatte, V ., Balkowski, C., & Duschl, W. J. 2001, ApJ, 561, 708
work page 2016
-
[77]
White, S. D. M., Briel, U. G., & Henry, J. P. 1993, MNRAS, 261, L8
work page 1993
-
[78]
Xie, L., De Lucia, G., Fossati, M., F., F., & Hirschmann. 2025, A&A, 698, A73
work page 2025
- [79]
-
[80]
Zabludoff, A. I. & Franx, M. 1993, AJ, 106, 1314
work page 1993
discussion (0)
Sign in with ORCID, Apple, or X to comment. Anyone can read and Pith papers without signing in.