Recognition: no theorem link
Post-Selection Distributional Model Evaluation
Pith reviewed 2026-05-15 00:55 UTC · model grok-4.3
The pith
PS-DME uses e-values to control post-selection false coverage rate for distributional KPI estimates after arbitrary pre-selection.
A machine-rendered reading of the paper's core claim, the machinery that carries it, and where it could break.
Core claim
PS-DME is a general framework for statistically valid distributional model assessment after arbitrary data-dependent model pre-selection. Building on e-values, it controls post-selection false coverage rate (FCR) for the distributional KPI estimates and establishes explicit conditions under which it is provably more sample efficient than a baseline method based on sample splitting.
What carries the argument
e-values constructed to remain valid under arbitrary data-dependent pre-selection, which are then used to bound the post-selection false coverage rate for the full distributional KPI estimates.
If this is right
- Valid estimates of full test-time KPI distributions become available without reserving separate data for selection versus evaluation.
- Users can compare candidate models across a range of reliability levels in a single procedure.
- Fewer total samples suffice for the same guarantee when the stated efficiency conditions hold.
- The same framework applies to model selection in language model decoding and network configuration tuning.
Where Pith is reading between the lines
- The e-value construction may extend directly to other post-selection tasks such as confidence intervals for selected parameters rather than full distributions.
- Integration into automated machine learning pipelines could reduce the fraction of data held out for validation.
- Adaptive or sequential selection rules could be accommodated if the e-value update remains martingale-valid.
Load-bearing premise
e-values can be built that stay valid for any data-dependent pre-selection rule without extra restrictions on the KPI or the selection process.
What would settle it
A simulation with known ground-truth KPI distributions in which the empirical coverage of the estimated distributions drops below the nominal level after a data-dependent selection step would show that FCR control fails.
Figures


read the original abstract
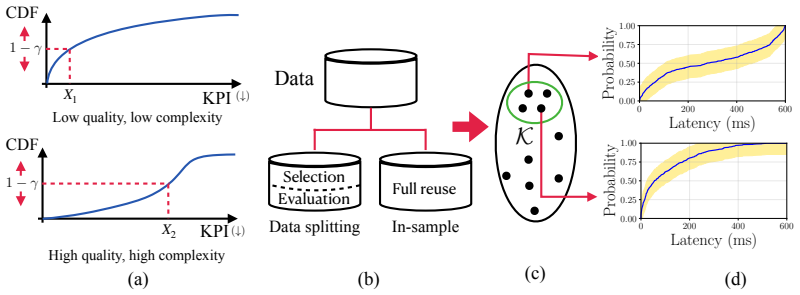
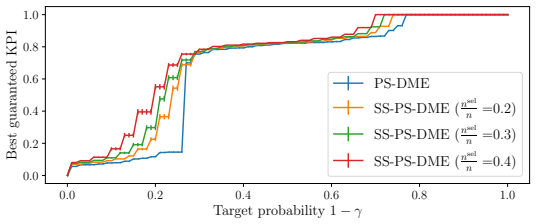
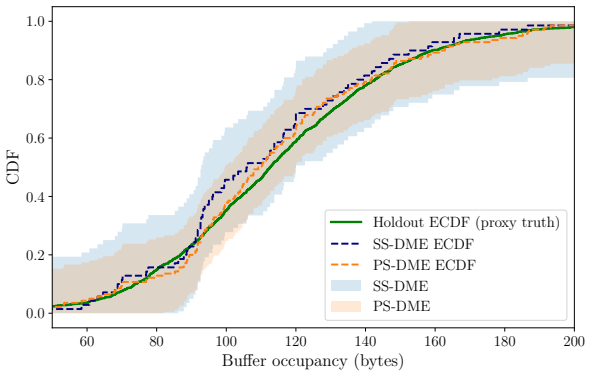
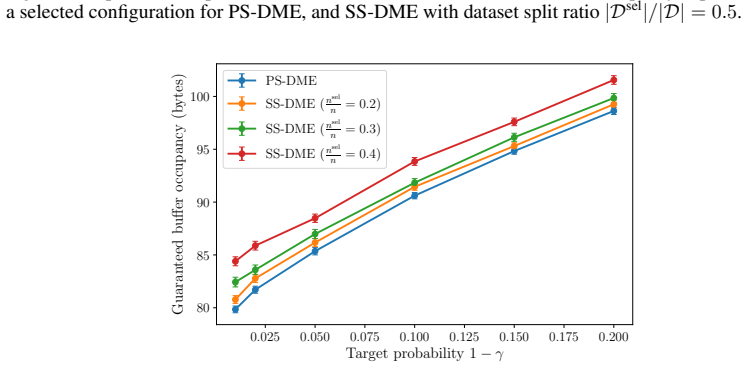
Formal model evaluation methods typically certify that a model satisfies a prescribed target key performance indicator (KPI) level. However, in many applications, the relevant target KPI level may not be known a priori, and the user may instead wish to compare candidate models by analyzing the full trade-offs between performance and reliability achievable at test time by the models. This task, requiring the reliable estimate of the test-time KPI distributions, is made more complicated by the fact that the same data must often be used both to pre-select a subset of candidate models and to estimate their KPI distributions, causing a potential post-selection bias. In this work, we introduce post-selection distributional model evaluation (PS-DME), a general framework for statistically valid distributional model assessment after arbitrary data-dependent model pre-selection. Building on e-values, PS-DME controls post-selection false coverage rate (FCR) for the distributional KPI estimates and we establish explicit conditions under which it is provably more sample efficient than a baseline method based on sample splitting. Experiments on synthetic data, text-to-SQL decoding with large language models, and telecom network performance evaluation demonstrate that PS-DME enables reliable comparison of candidate configurations across a range of reliability levels, supporting the statistically reliable exploration of performance--reliability trade-offs.
Editorial analysis
A structured set of objections, weighed in public.
Referee Report
Summary. The paper introduces post-selection distributional model evaluation (PS-DME), a framework extending e-value machinery to construct valid distributional KPI estimates after arbitrary data-dependent model pre-selection. It claims that PS-DME controls the post-selection false coverage rate (FCR) for the full distributional estimates and establishes explicit conditions under which the method is provably more sample-efficient than a sample-splitting baseline. The approach is demonstrated on synthetic data, LLM text-to-SQL decoding, and telecom network performance evaluation.
Significance. If the validity and efficiency claims hold, the work enables statistically reliable exploration of performance-reliability trade-offs without data splitting, which is valuable for applications like LLM evaluation and network optimization where post-selection bias is common. The extension of e-values to full distributional control after arbitrary selection is a technically interesting contribution.
major comments (2)
- [Abstract] Abstract and theoretical development: the claim that e-values remain valid for arbitrary pre-selection and control FCR for the full distributional KPI without additional restrictions on the KPI or selection rule requires explicit verification that the supermartingale property holds under optional stopping; if the KPI is unbounded and selection correlates with tail behavior, uniform integrability may be needed to prevent failure of the FCR bound.
- [Theoretical results] Efficiency comparison: the explicit conditions under which PS-DME is provably more sample efficient than splitting are not fully detailed in terms of the specific assumptions on the selection rule and KPI moments; without these, the efficiency gain claim cannot be assessed as general.
minor comments (2)
- [Experiments] Experiments: provide details on the number of independent runs, error-bar computation method, and exact KPI definitions for the telecom and LLM tasks to support reproducibility.
- [Method] Notation: clarify the filtration used for the e-value supermartingale to include both the selection step and the distributional statistics.
Simulated Author's Rebuttal
We thank the referee for their constructive and detailed comments on our manuscript. We address each major comment below and indicate the revisions we will make to clarify the theoretical foundations and strengthen the presentation.
read point-by-point responses
-
Referee: [Abstract] Abstract and theoretical development: the claim that e-values remain valid for arbitrary pre-selection and control FCR for the full distributional KPI without additional restrictions on the KPI or selection rule requires explicit verification that the supermartingale property holds under optional stopping; if the KPI is unbounded and selection correlates with tail behavior, uniform integrability may be needed to prevent failure of the FCR bound.
Authors: We appreciate the referee's observation on the technical conditions required for the supermartingale property under optional stopping. Our framework relies on e-values as non-negative supermartingales, with FCR control following from the optional stopping theorem. To address potential issues with unbounded KPIs and tail correlations, we will add an explicit uniform integrability assumption to the main theorem and provide a short verification argument in the appendix showing that the FCR bound continues to hold under this condition. revision: yes
-
Referee: [Theoretical results] Efficiency comparison: the explicit conditions under which PS-DME is provably more sample efficient than splitting are not fully detailed in terms of the specific assumptions on the selection rule and KPI moments; without these, the efficiency gain claim cannot be assessed as general.
Authors: We agree that the efficiency comparison would benefit from a more explicit statement of assumptions. The current result holds when the selection rule is measurable with respect to the training data and the KPI possesses finite second moments. We will revise the relevant theorem to enumerate these conditions clearly, including the precise measurability requirement on the selection rule and the moment conditions on the KPI, thereby making the scope of the efficiency gain fully assessable. revision: yes
Circularity Check
No significant circularity: derivation extends e-value framework without self-referential reduction
full rationale
The paper's central claims rest on extending established e-value supermartingale properties to control post-selection FCR for distributional KPI estimates after arbitrary pre-selection, with explicit efficiency comparisons to sample splitting. No step in the abstract or described derivation reduces by construction to a fitted parameter renamed as prediction, a self-definitional loop, or a load-bearing self-citation whose validity depends on the present work. The framework is presented as building on prior e-value machinery without smuggling ansatzes or renaming known results via internal definitions. The derivation chain is therefore self-contained against external benchmarks.
Axiom & Free-Parameter Ledger
axioms (1)
- domain assumption E-values can be constructed to control post-selection false coverage rate for distributional KPI estimates after arbitrary data-dependent model pre-selection
Reference graph
Works this paper leans on
-
[1]
Conformal risk control.arXiv preprint arXiv:2208.02814,
Anastasios N Angelopoulos, Stephen Bates, Adam Fisch, Lihua Lei, and Tal Schuster. Conformal risk control.arXiv preprint arXiv:2208.02814,
-
[2]
Tom Brown, Benjamin Mann, Nick Ryder, Melanie Subbiah, Jared D Kaplan, Prafulla Dhariwal, Arvind Neelakantan, Pranav Shyam, Girish Sastry, Amanda Askell, et al. Language models are few-shot learners.Advances in neural information processing systems, 33:1877–1901,
work page 1901
-
[3]
Abhinav Chakraborty, Junu Lee, and Eugene Katsevich. Comparing three learn-then-test paradigms in a multivariate normal means problem.arXiv preprint arXiv:2601.07764,
-
[4]
Post-hoc large-sample statistical inference.arXiv preprint arXiv:2603.08002,
Ben Chugg, Etienne Gauthier, Michael I Jordan, Aaditya Ramdas, and Ian Waudby-Smith. Post-hoc large-sample statistical inference.arXiv preprint arXiv:2603.08002,
-
[5]
The Curious Case of Neural Text Degeneration
Ari Holtzman, Jan Buys, Li Du, Maxwell Forbes, and Yejin Choi. The curious case of neural text degeneration.arXiv preprint arXiv:1904.09751,
work page internal anchor Pith review Pith/arXiv arXiv 1904
-
[6]
MobileLLM-Flash: Latency-Guided On-Device LLM Design for Industry Scale Deployment
URLhttps://arxiv.org/abs/2603.15954. 10 Leah Jager and Jon A. Wellner. Goodness-of-fit tests via phi-divergences.The Annals of Statistics, 35(5):2018 – 2053,
work page internal anchor Pith review Pith/arXiv arXiv 2018
-
[7]
doi: 10.1214/0009053607000000244. URL https://doi.org/10. 1214/0009053607000000244. Kaggle Contributors. Http server logs dataset. https://www.kaggle.com/,
-
[9]
URL https: //arxiv.org/abs/2312.08040. Stan Koobs and Nick W. Koning. Equivalence testing with data-dependent and post-hoc equivalence margins,
-
[10]
URLhttps://arxiv.org/abs/2603.16213. Arun Kumar Kuchibhotla. Post-selection inference. InInternational Encyclopedia of Statistical Science, pages 1920–1924. Springer,
-
[11]
A Gentle Introduction to Conformal Prediction and Distribution-Free Uncertainty Quantification
Bates Stephen et al. A gentle introduction to conformal prediction and distribution-free uncertainty quantification.arXiv preprint arXiv: 2107.07511,
work page internal anchor Pith review Pith/arXiv arXiv
-
[12]
Self-Consistency Improves Chain of Thought Reasoning in Language Models
Xuezhi Wang, Jason Wei, Dale Schuurmans, Quoc Le, Ed Chi, Sharan Narang, Aakanksha Chowdh- ery, and Denny Zhou. Self-consistency improves chain of thought reasoning in language models. arXiv preprint arXiv:2203.11171,
work page internal anchor Pith review Pith/arXiv arXiv
-
[13]
11 Eric Yanchenko, Jonathan P Williams, and Ryan Martin. Hypothesis testing for community structure in temporal networks using e-values.arXiv preprint arXiv:2507.23034,
-
[14]
URL https://arxiv.org/abs/2407.10671. Tao Yu, Rui Zhang, Kai Yang, Michihiro Yasunaga, Dongxu Wang, Zifan Li, James Ma, Irene Li, Qingning Yao, Shanelle Roman, et al. Spider: A large-scale human-labeled dataset for complex and cross-domain semantic parsing and text-to-sql task.arXiv preprint arXiv:1809.08887,
work page internal anchor Pith review Pith/arXiv arXiv
-
[15]
12 A Additional Illustrations In this section, we provide additional illustrations for concepts introduced in the main text. Fig. 5 illustrates the definition of a miscoverage eventO k, as defined in (5). −3 −2 −1 0 1 2 3 x 0.0 0.2 0.4 0.6 0.8 1.0 F (x) True CDF Empirical CDF Confidence Band (a) −3 −2 −1 0 1 2 3 x 0.0 0.2 0.4 0.6 0.8 1.0 F (x) True CDF Emp...
work page 2025
-
[16]
E " 1 max{|K|,1} X k∈K 1{Fk /∈ Ck} K ## (20a) =E K
for a recent review. A key limitation of this literature is that it focuses on scalar performance metrics, e.g., average risk, relative to a pre-specified target level. In contrast, this work aims atdistributionalevaluation, enabling comparison of models across all test-time reliability levels without committing to a single KPI threshold. Confidence bands...
work page 1956
-
[17]
Tk(F) = sup x∈R bFk(x)−F(x) .(22) By the DKW inequality (Dvoretzky et al., 1956), under the null hypothesis (21), the inequality P(Tk(F)> ε| H 0,k(F))≤2 exp −2nkε2 (23) holds. As shown next, this implies that the following statistic pk(F) = min n 1,2 exp −2nk(Tk(F)) 2 o (24) is a valid p-value for the null hypothesis (21). Lemma 3.For the null hypothesis ...
work page 1956
-
[18]
Note, however, that the functionf VS(p)is not a valid e-calibrator
states that for the power family of calibrators (12) we have fVS(p) = max τ∈(0,1) fτ(p) = −exp(−1) plogp , p≤e −1, 1, p > e −1, (33) where arg max τ∈(0,1) fτ(p) =− 1 logp (34) Hence, for allp∈(0,1)andτ∈(0,1), the inequality fτ(p)≤f VS(p)(35) 15 holds. Note, however, that the functionf VS(p)is not a valid e-calibrator. Since function fτ(·) is decreas...
work page 1979
-
[19]
To study the effect of the e-calibrator on both inferential tightness and post-selection reliability, we compare three members of the power-family of e-calibrators (12), and consider three parameters τ∈ {1/3,1/2,2/3} . For each calibrator, the corresponding band width is computed according to (14), and the same selected set K is used across all calibrator...
work page 2000
discussion (0)
Sign in with ORCID, Apple, or X to comment. Anyone can read and Pith papers without signing in.